Open Journal of Fluid Dynamics
Vol.2 No.4A(2012), Article ID:26364,7 pages DOI:10.4236/ojfd.2012.24A040
Arteriovenous Graft Modeling and Hemodynamic Interpretation
1Department of Mechanical Engineering, Soongsil University, Seoul, South Korea
2Department of Radiology, Seoul National University Boramae Hospital, Seoul, South Korea
3Department of Thoracic and Cardiovascular Surgery, Seoul National University Boramae Hospital, Seoul, South Korea
Email: *cyho50168@naver.com
Received September 25, 2012; revised November 7, 2012; accepted November 16, 2012
Keywords: Ateriovenous Fistula; Bypass Graft; Hemodynamic Interpretation; Numerical Analysis
ABSTRACT
Arteriovenous graft (AVG) is artificially made with graft for hemodialysis in the patients with renal failure. Stenosis in the arterial or venous anastomosis of AVG results in its malfunction. Here, we made an AVG hemodynamic model with three different anastomotic angles (20˚, 30˚, 40˚) and analyzed hemodynamic parameters such as velocity vectors, WSS and OSI in the arterial and venous anastomosis to find what helps in developing new surgical techniques to reduce stenosis in the anastomosis. Recirculation flow, low WSS and high OSI in the venous anastomosis were demonstrated in 30˚ and 40˚ models, and recirculation flow, high WSS and high OSI in the arterial anastomosis were shown in all models. Conclusively, higher anastomosis angle in the venous anastomosis cause stenosis, but stenosis in the arterial anastomosis happens irregardless of anastomosis angle.
1. Introduction
The incidence of renal failure is increasing due to increase in aged people and patients with diabetes mellitus. The treatments of renal failure are kidney transplantation or dialysis. The limitation of kidney donors drives most patients with renal failure to dialysis, peritoneal dialysis or hemodialysis. Peritoneal dialysis takes a longer time and more frequent laps to do than hemodialysis. For the reasons, hemodialysis is commonly used.
Arteriovenous fistula (AVF) should be made artificially for hemodialysis. Arteriovenous graft (AVG) is a kind of arteriovenous fistulas, and it connects the artery and vein with graft to supply a large vessel for needling of hemodialysis. The luminal patency of AVG like Figure 1 is mainly upon the patency at the arterial or venous anastomosis. Stenosis in the venous anastomosis is more common and results in AVG dysfunction [1-3]. New surgical techniques at the anastomosis are required to reduce stenosis and hemodynamic models are needed to experiment new techniques.
In the present study, hemodynamics in AVG was numerically investigated with computational fluid dynamics. In the simulation, the three-dimensional geometry of the artery, vein and graft is used for computational mesh, and transient velocity profile of blood flow measured in ultrasonography is used for inlet and outlet boundary condition. Using this system, various simulations are carried out to analyze the effects of geometry of the artery, vein and graft on flow patterns and WSS and OSI distributions [4-6].
2. Numerical Analysis
2.1. Geometry Modeling and Mesh Generation
Figure 2 shows that 3D modeling was performed by Design modeler. Anastomosis angle (θ) is set to 20˚, 30˚, 40˚. To calculate the flow in geometry, computational mesh was generated with ICEM CFD using FEM (Finite Element Method) as shown in Figure 2. The total number of elements and nodes is 351,584 and 323,907 respectively.
2.2. Governing Equations
In order to investigate the numerical analysis of the bio fluid dynamic characteristics in AVG, the governing and constitutive equations are adopted as followings. Among various constitutive equations in Figure 3, the Carreau model of Equation (3) is used to specify the apparent
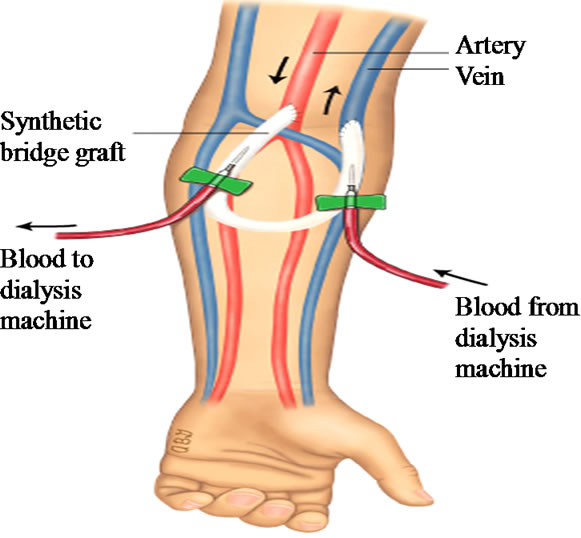
Figure 1. AVG for hemodialysis.
 (a)
(a)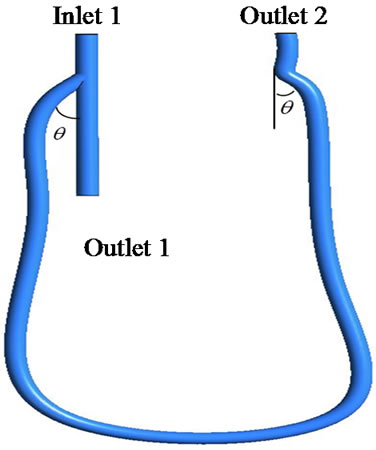 (b)
(b)
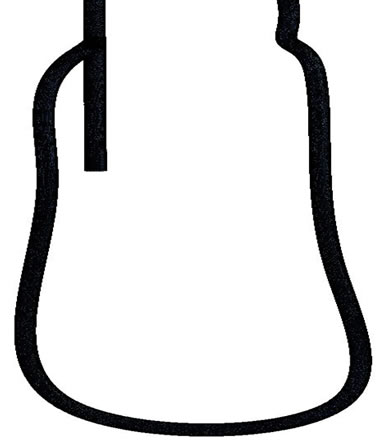
Figure 2. 3D-model and computational mesh. (a) 3D-model; (b) Computational mesh.
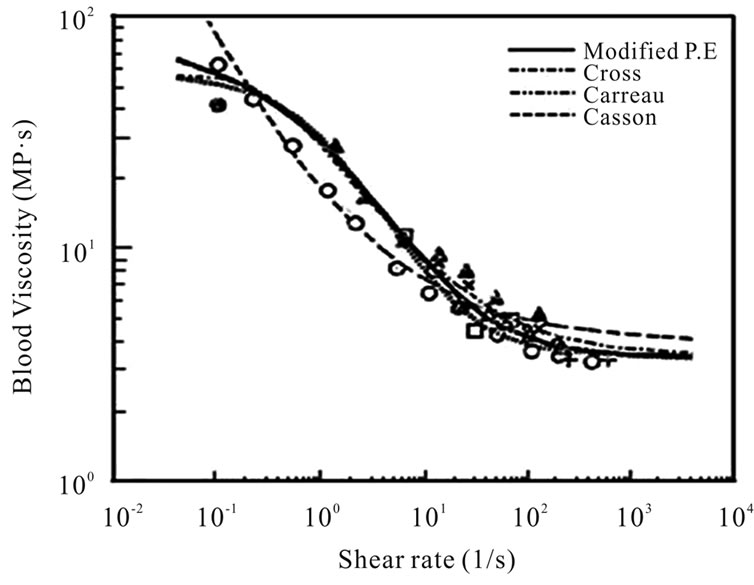
Figure 3. Blood viscosities versus shear rates.
viscosity of blood as a function of the shear rate where ρ,  , p,
, p,  are density, velocity vectors, pressure and apparent
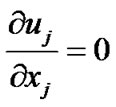 (1)
(1)
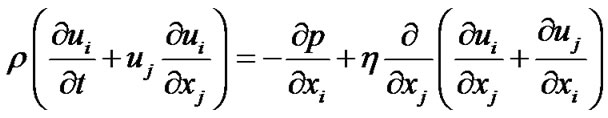 (2)
(2)
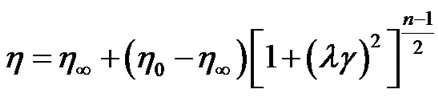 (3)
(3)
viscosity respectively. In the model,  denotes the shear rate.
  and
and  are the apparent viscosities at infinite-shear-rate and zero-shear-rate, respectively.
  and n represent the characteristic time and index of this model. The rheological values of blood as a nonNewtonian fluid are taken to be η0 = 0.056 Pa·s, η∞ = 0.00345 Pa·s,
 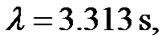 and n = 0.356. The Blood viscosity as a function of the shear rate is shown in Figure 3.
2.3. Boundary Conditions
Not only the geometry but also the boundary condition is also an important parameter to predict the hemodynamics in AVG because blood pressure and flow rate are different from patient to patient. Figure 4 shows measured doppler waveforms. The inflow and outflow boundary conditions are applied with clinical data of blood flow. The boundary condition at the wall is non-slip, and the wall of the artery is assumed to be rigid. The initial condition is given by fully developed flow field.
3. Results
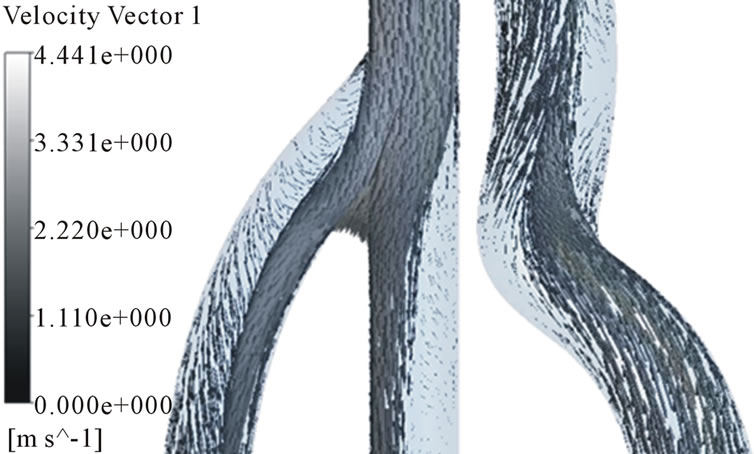
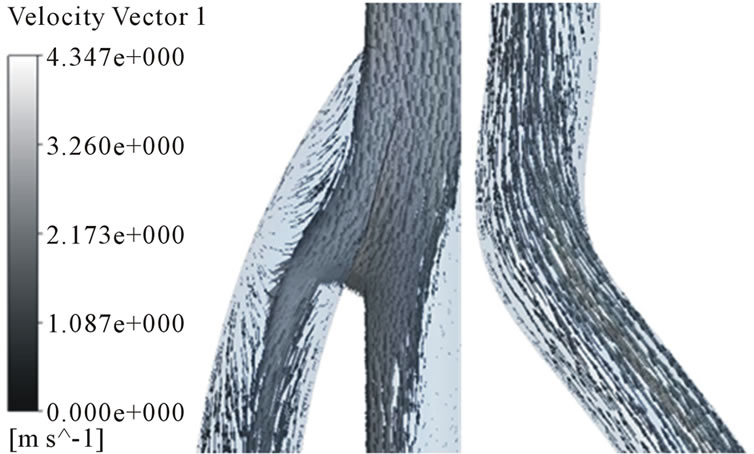
In order to analyze the hemodynamic characteristics of AVG, important times in a flow cycle were set; at the peak and lowest velocity, at a same velocity in acceleration and deceleration phase (Figure 5). Velocity distributions in the arterial and venous anastomosis of AVG are shown in Figures 6-8. Recirculation flow is bigger in 30˚,
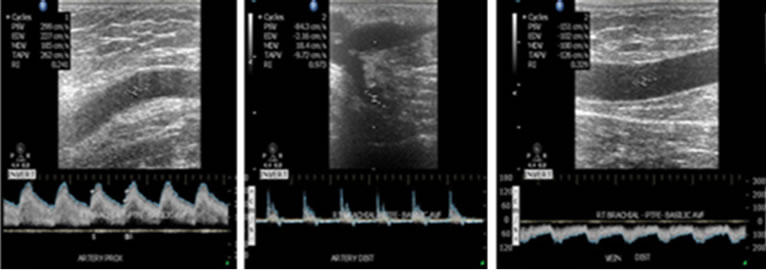
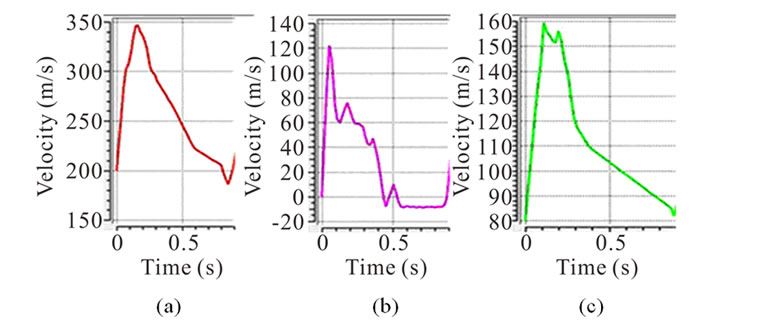
Figure 4. Applied Doppler waveform for inlet 1, outlet 1 and outlet 2. (a) Inlet 1; (b) Outlet 1; (c) Outlet 2.
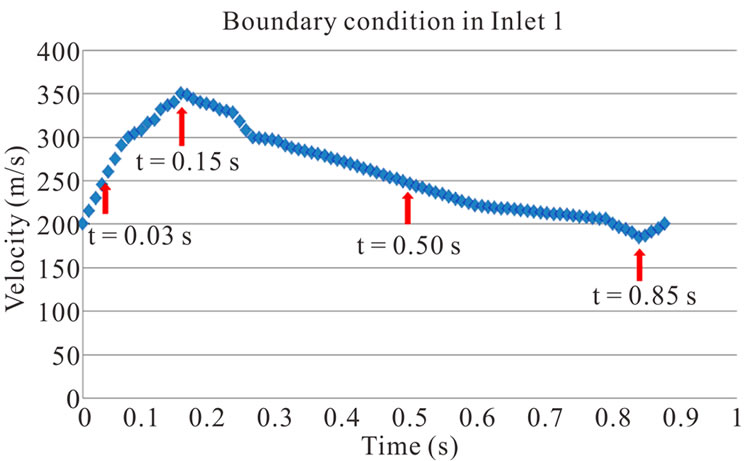
Figure 5. Velocity waveform for evaluating hemodynamic characteristics of AVG.
40˚ models than 20˚ model at the venous anastomosis. On the other hand, all models have big recirculation flow at the arterial anastomosis. Because more problems in AVG happen in the venous anastomosis, we had better focus on velocity distributions in the area. The recirculation zone is seen to be growing depending on increase in anastomosis angle. Cross-sectional velocity distributions at the venous anastomosis are shown in Figure 9. Secondary flow in the x-z cross sections is shown. 30˚ and 40˚ models turn out to have a noticeable velocity distribution. The secondary flow mainly consists of swirling flow in a transverse plane, which is caused by the vascular curvature. The secondary flow near the wall causes high WSS. In 30˚ and 40˚ models, secondary flow is shown well near the wall. However, in 20˚ model, secondary flow is not so strong and axial flow is shown near the wall instead.
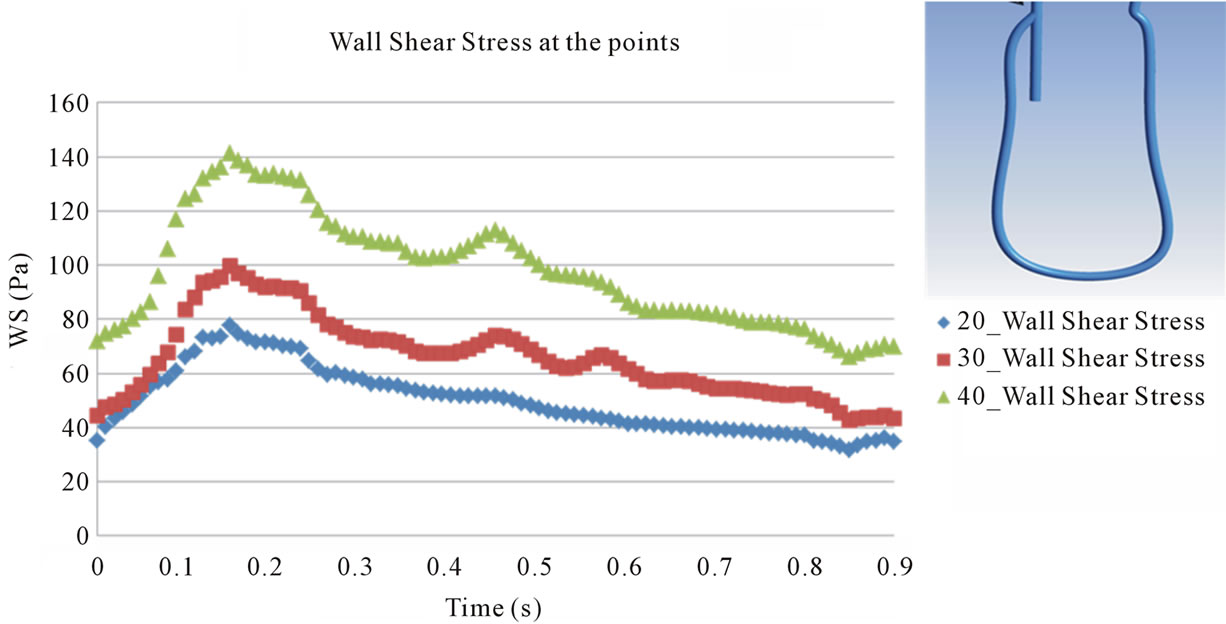
3.1. Transient Behavior of Wall Shear Stress
Points evaluated for WSS are shown in Figures 10 and 11 presents the transient behavior of WSS at the points. At point 1 and 4, the behavior of WSS in each model is similar to each other and is also similar to that of the flow velocity at the inlet 1 and outlet 2 (see Figure 4). This implies that the behavior of WSS is directly affected by the behavior of the flow at the inlet 1 and outlet 2. On the other hand, at points 2 and 3, the behavior of WSS is a little different from the behavior of the flow at the outlet 1 and outlet 2. In all points except point 3, maximum magnitude of WSS appears in the systole and the magnitude is larger in 40˚ models than in the other models. The maximum magnitude of about 2000 dyne/cm2 is about thirty times as large as the usual value measured in the normal artery, 10 - 70 dyne/cm2.
In Figure 11(b), it is shown that the maximum magnitude of WSS increases at inner wall of a branch close to vascular bifurcation like point 2. In contrast, the maximum magnitude of WSS at outer wall of a branch close to vascular bifurcation decreases like point 3. Such
 (a)
(a) (b)
(b)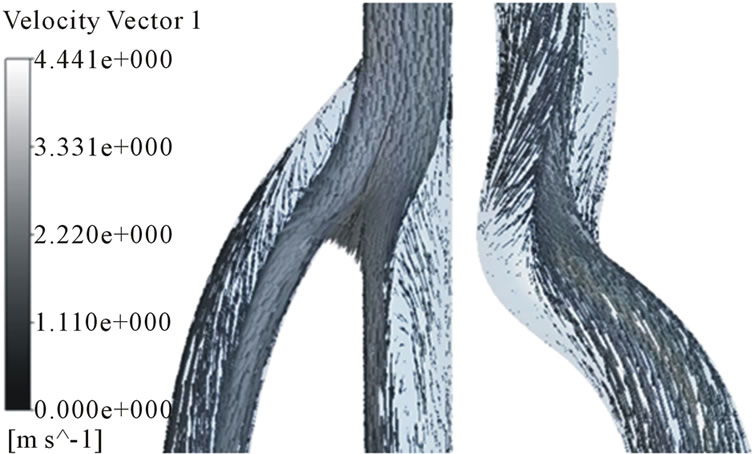 (c)
(c)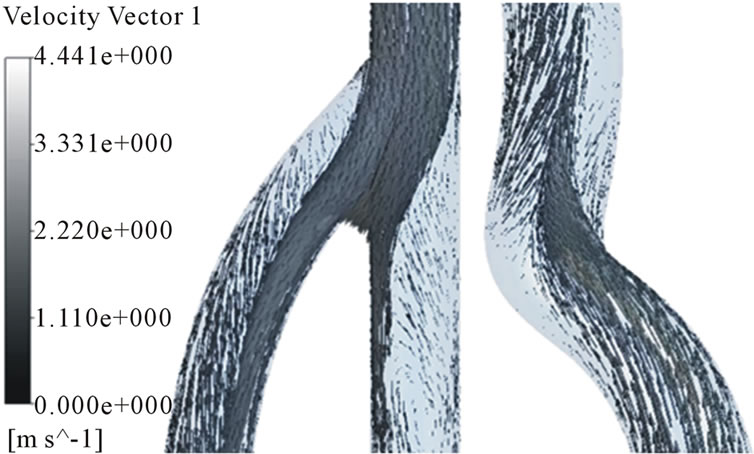 (d)
(d)
Figure 6. Velocity distributions in the arterial and venous anastomosis of AVG (40˚). (a) t = 0.03 s; (b) t = 0.15 s; (c) t = 0.5 s; (d) t = 0.85 s.
 (a)
(a)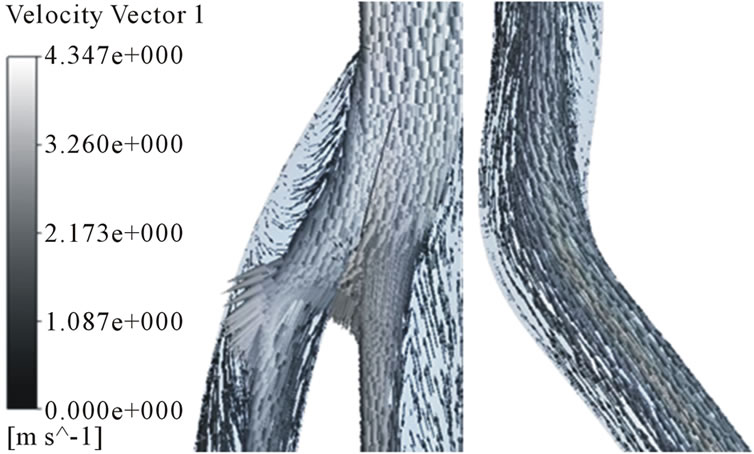 (b)
(b)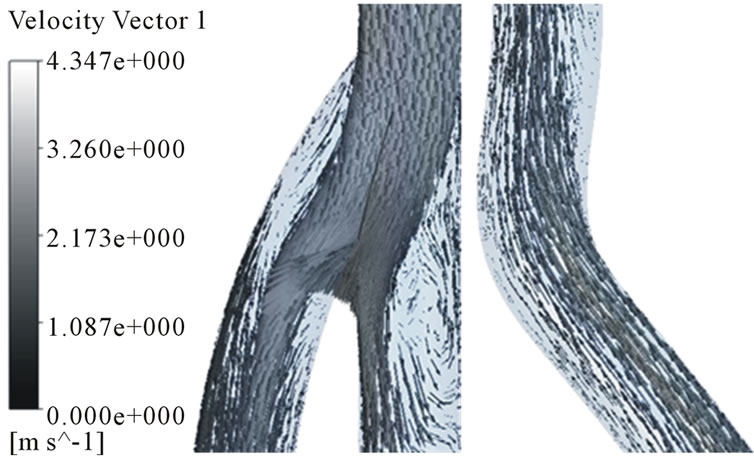 (c)
(c)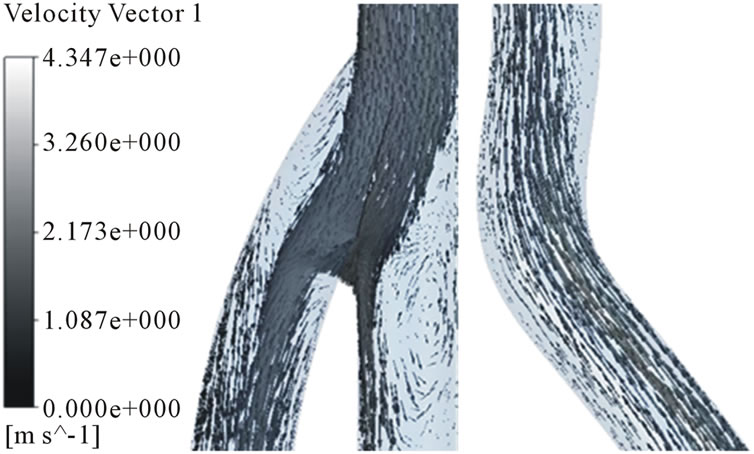 (d)
(d)
Figure 7. Velocity distributions in the arterial and venous anastomosis of AVG (30˚). (a) t = 0.03 s; (b) t = 0.15 s; (c) t = 0.5 s; (d) t = 0.85 s.
 (a)
(a)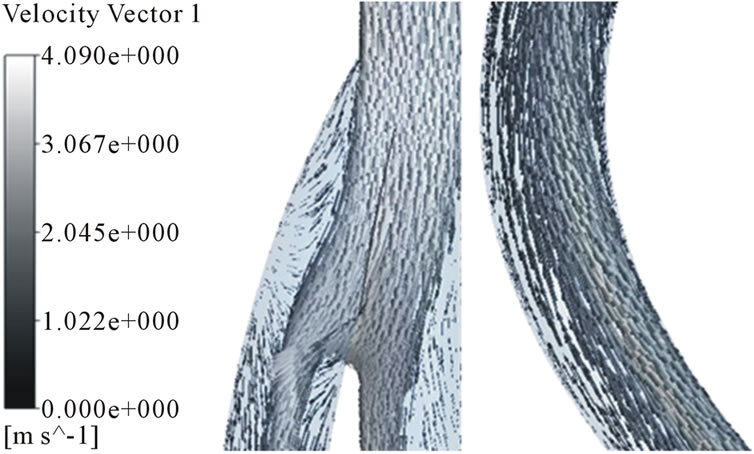 (b)
(b) (c)
(c)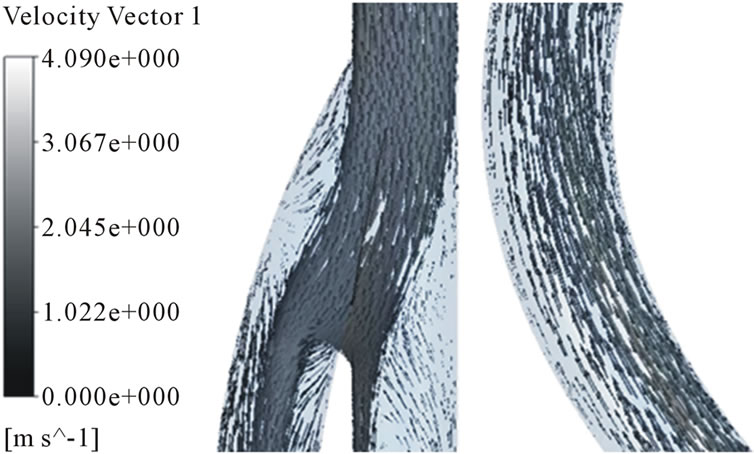 (d)
(d)
Figure 8. Velocity distributions in the arterial and venous anastomosis of AVG (20˚). (a) t = 0.03 s; (b) t = 0.15 s; (c) t = 0.5 s; (d) t = 0.85 s.
 (a)
(a)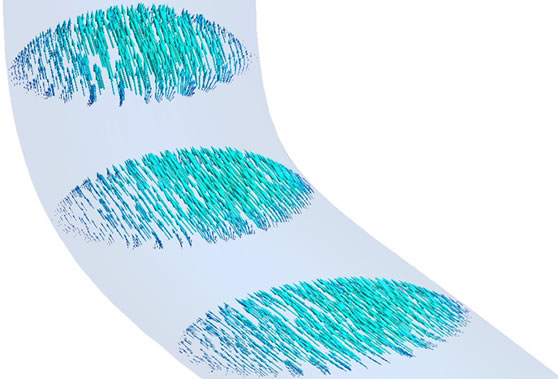 (b)
(b)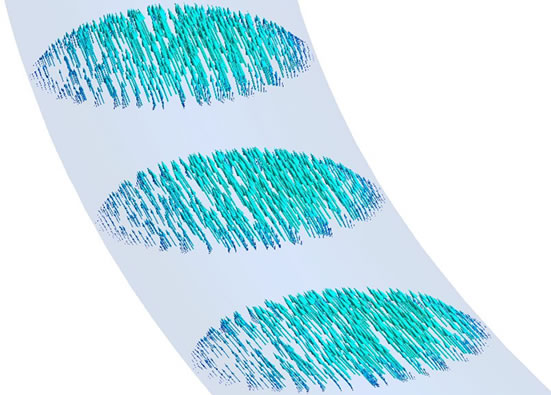 (c)
(c)
Figure 9. Velocity distributions in radial in the venous anastomosis of AVG. (a) 40˚ model; (b) 30˚ model; (c) 20˚ model.
a change in WSS may damage the vascular wall because endothelial cells are known to be sensitive to WSS. The change of WSS is mainly affected by combination of shape of the artery, vein and graft. In Figure 11(c), 30˚ and 40˚ models demonstrated low WSS at point 3, but 20˚ models showed a normal range of WSS. The low WSS can cause stenosis in the venous anastomosis of AVG.
3.2. Oscillatory Shear Index
To examine the spatial dependence of the temporal variation of normalized WSS, we compute the spatial distribution of OSI, which is a sensitive measure of the time variation of the direction of the wall shear stress vector.
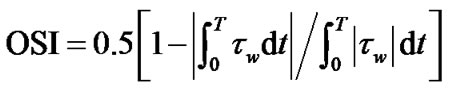 (4)
(4)
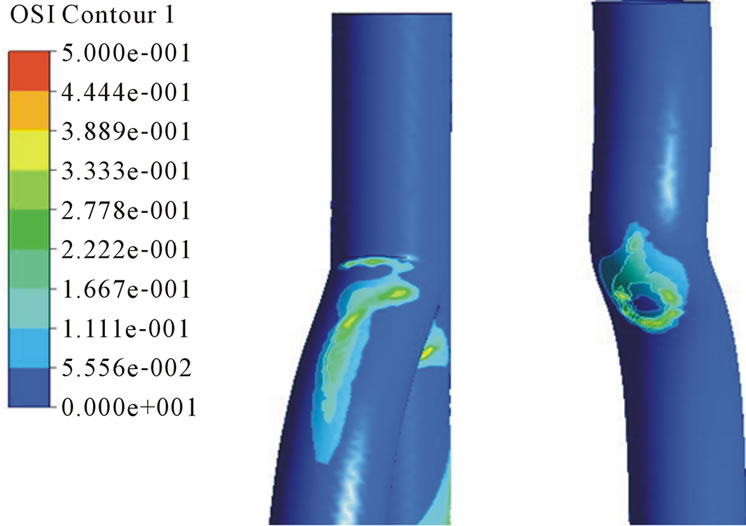
OSI is a dimensionless parameter that accounts for the degree of deviation of WSS vectors during the cardiac cycle. OSI values close to 0.5 indicate that WSS vectors are subject to large variations, and that WSS vectors can be very small or change direction at parts of the cardiac cycle, which means that instances all the time flow is
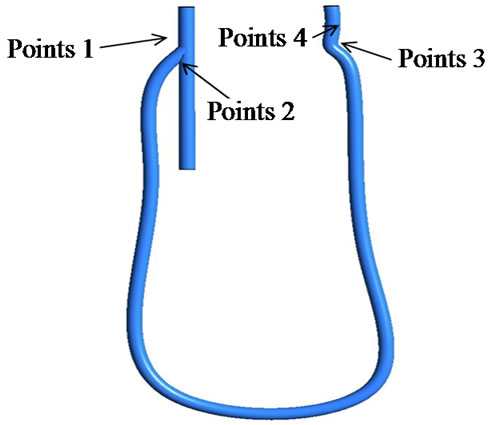
Figure 10. Point for the evaluation of wall shear stress.
 (a)
(a)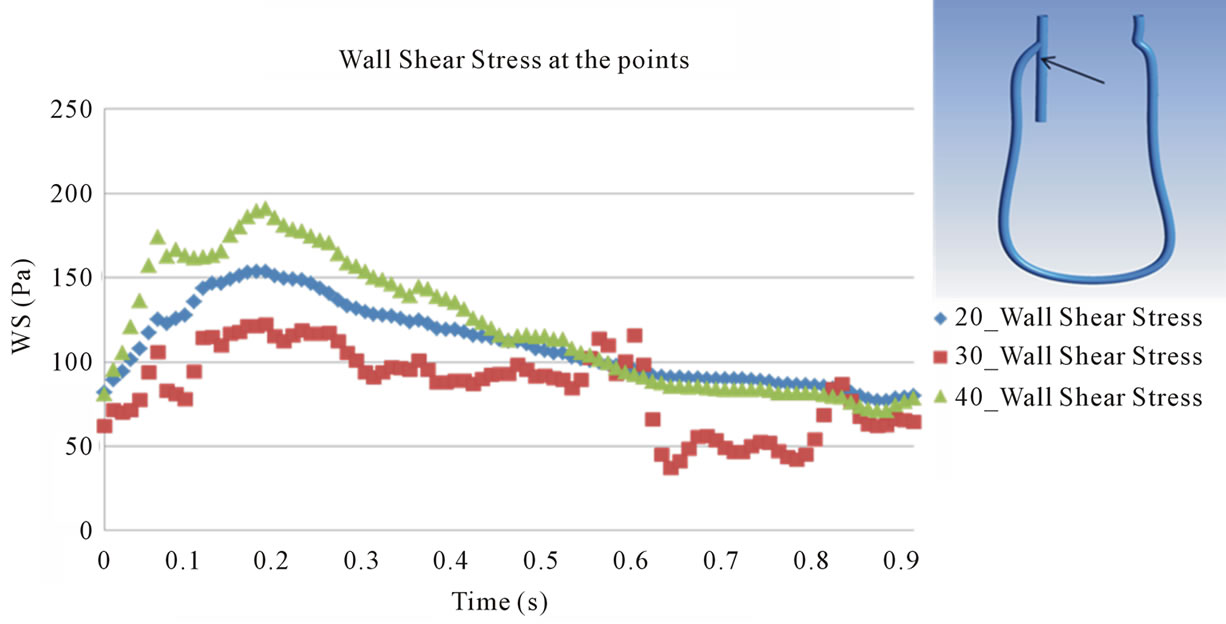 (b)
(b)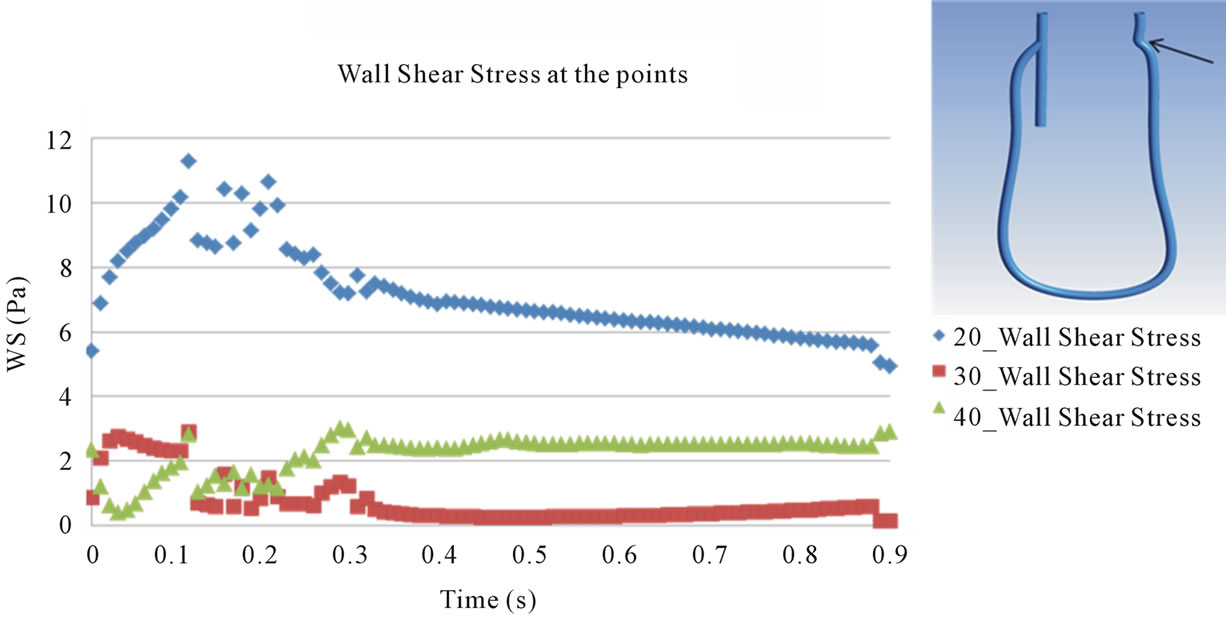 (c)
(c)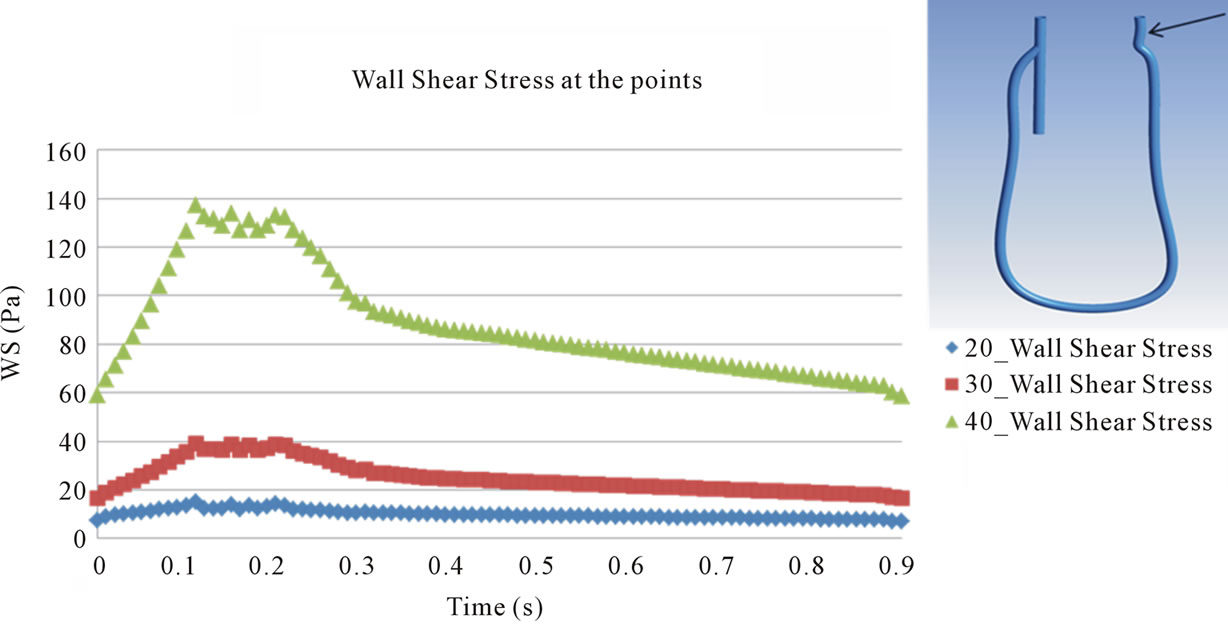 (d)
(d)
Figure 11. Evaluation of wall shear stress at the points. (a) Point 1; (b) Point 2; (c) Point 3; (d) Point 4.
 (a)
(a) (b)
(b)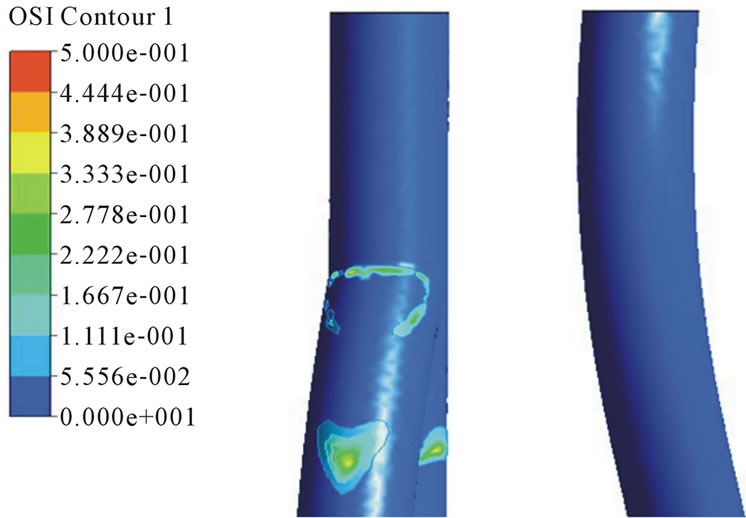 (c)
(c)
Figure 12. OSI distributions in the arterial and venous anastomosis of AVG. (a) 40˚ model; (b) 30˚ model; (c) 40˚ model.
stopped or reversed. Figure 12 shows OSI distributions in the arterial and venous anastomosis of AVG. In the venous anastomosis, 30˚, 40˚ models has higher OSI than 20˚ model and in the arterial anastomosis, all models have big OSI. When we consider OSI distributions, the venous anastomosis of 20˚ model is the area free from stenosis.
4. Conclusion
The numerical analysis based on clinical data is presented. It is found that flow patterns and WSS and OSI distributions in the arterial and venous anastomosis of AVG are affected by anastomosis angle. Stenosis in the venous anastomosis is higher with greater anastomosis angle, and stenosis in the arterial anastomosis happens irregardless of anastomosis angle.
5. Acknowledgements
This study was supported by grant No. 03-2012-7 from the Seoul National University Boramae Hospital Research Fund.
REFERENCES
- R. P. Campos, M. M. Do Nascimento, D. C. Chula, D. E. Do Nascimento and M. C. Riella, “Stenosis in Hemo-Dialysis Arteriovenous Fistula: Evaluation and Treatment,” Hemodialysis International, Vol. 10, No. 2, 2006, pp. 152- 161. doi:10.1111/j.1542-4758.2006.00087.x
- P. Haage and R. W. Günther, “Radiological Intervention to Maintain Vascular Access,” European Journal of Vascular Endovascular Surgery, Vol. 32, No. 1, 2006, pp. 84- 89. doi:10.1016/j.ejvs.2005.10.004
- L. Turmel-Rodrigues, J. Pengloan and P. Bourquelot, “Interventional Radiology in Hemodialysis Fistulae and Grafts: A Multidisciplinary Approach,” CardioVascular and Interventional Radiology, Vol. 25, No. 1, 2002, pp. 3-16. doi:10.1007/s00270-001-0082-y
- R. Torii, M. Oshima, T. Kobayashi and K. Takagi, “The Hemodynamic Study of the Cerebral Artery Using Numerical Simulation Based on Medical Imaging Data,” Journal of Visualization, Vol. 4, No. 3, 2001, pp. 277- 284. doi:10.1007/BF03182588
- S. H. Suh, H. H. Kim and J. S. Lee, “Analysis of Bypass Grafting Effects in Stenosed Coronary Arteries,” Proceeding of the KSME Fluids Engineering Division Spring Meeting, Vol. 36, No. 2, 2012, pp. 153-159.
- A. M. Malek, S. L. Alper and S. Izumo, “Hemodynamic Shear Stress and Its Role in Atherosclerosis,” The Journal of the American Medical Association, Vol. 282, No. 21, 1999, pp. 2035-2042. doi:10.1001/jama.282.21.2035
NOTES
*Corresponding author.