Theoretical Economics Letters
Vol.08 No.15(2018), Article ID:89252,27 pages
10.4236/tel.2018.815223
General Theory of Economics: CDR Supply Side Scientific Growth Law Unveiled
Dennis Ridley1,2
1School of Business & Industry, Florida A & M University, Tallahassee, FL, USA
2Department of Scientific Computing, Florida State University, Tallahassee, FL, USA

Copyright © 2018 by author and Scientific Research Publishing Inc.
This work is licensed under the Creative Commons Attribution International License (CC BY 4.0).
http://creativecommons.org/licenses/by/4.0/


Received: November 11, 2018; Accepted: December 17, 2018; Published: December 20, 2018
ABSTRACT
The capitalism (C), democracy (D) and rule of law (R)―CDR global invariant hypothesis was previously demonstrated for year 2014 cross country per capita real gross domestic product adjusted for purchasing power parity (G). Consistent with the principle of parsimony, the CDR index explained G with only these three variables. This paper re-estimates the model for the last 22 years of available data. The result is model parameters that are a set of global time invariant constants. These constants constitute the global time invariant CDR index defined by the vector inner (dot) product of the global constants and country C, D, R and C∙D∙R. This establishes the CDR global time invariant hypothesis. Exogenous and endogenous components of capital are decoupled to calculate and explain the values and roles of new ideas versus old capital stock. Based on the unitary entrepreneurship elasticity of G, the theoretical optimal reinvestment in capital stock is validated by empirical gross fixed capital formation. Together, these place economic growth on a scientific basis. Because of the absence of explicit definitions in the extant literature for concepts such as capitalist, capitalism, entrepreneurship and other consequential terminologies, they are clarified in concise nomenclature.
Keywords:
CDR Index, GDP, Capitalism, Democracy, Rule of Law, Entrepreneurship

1. Introduction
It has been suggested by North [1], Knack and Keefer [2], Glaeser, et al. [3], Acemoglu, Johnson, and Robinson [4], Acemoglu, et al. [5] and others that institutions are important for economic growth. However, none identified a highly efficient model for estimating GDP. This paper presents a highly efficient as well as global time invariant supply side CDR model that combines three institutions: capitalism (C), democracy (D) and rule of law (R) including a unique interaction term C∙D∙R.
Before explicitly revealing various features of the avantgarde CDR supply side economy, it bears reviewing how strictly demand sided the common view of economic equilibrium is. There are three traditional ways to determine gross domestic product (GDP) for a specified period. One is the market value of all domestic expenditures made on final goods and services, including consumption expenditures, investment expenditures, government expenditures, and net exports. Another is a tally of income earned by all the factors of production in an economy including the wages paid to labor, the rent earned by land, the return on capital in the form of interest, entrepreneurial profits, indirect business taxes and depreciation, and net foreign factor income. Another is the net product or value added. But, these demand side calculations can only be performed after the fact. They assume that a capital stock of facilities that produce final goods and services just exist somehow, do not have to be created, and that economics are concerned with how the goods are produced, distributed, exchanged and consumed. In reality, all such capitals must have been previously created. Its only source must be human capital ideas of imagination and creativity, otherwise known as entrepreneurship. The first growth model to include entrepreneurship was presented by Schumpeter [6] [7] [8] . Entrepreneurship is expressed as quanta of new information that if noticed, can be converted to tangible wealth in terms of goods and services. The traditional economic thought process is designed on the Malthusian [9] assumption of scarce resources. But, since Malthus, the world has seen massive population growth, undeterred by resources. It is as if each person brings their own wealth into the world (Simon [10] ).
If economics is currently a science it is one of the descriptive forensic postmortems. Even then, the extant literature is not in uniform agreement of that which has already occurred, or in general, how the various economies of the world got to be where they are currently. Traditional economics does not appear to have prescriptive ability.
As it turns out, G can be estimated ahead of time from the postulated CDR index. The CDR index is a blend of C, D and R, where C is measured by total market capitalization, and D and R are country rankings. We recognize that D and R contain many elements. However, the parsimony of the CDR model derives from the elements being subsumed in D and R. Statistical analysis does not require the inclusion of all the already correlated elements in the model. Their inclusion would only serve to reduce the available degrees of freedom. The ability to estimate demonstrates that high CDR countries will be relatively wealthy and low CDR countries will be relatively poor. Therefore, it establishes the importance for a country to raise its CDR. The CDR index was established by Ridley [11] [12] [13] by a successful test of hypothesis for year 2014 data. The model was constructed from global invariant parameters. Therefore, it will estimate G for any country. The purpose of this paper is to present a successful test of the CDR hypothesis for years other than 2014. We show that in addition to being parametrically global invariant, the CDR index is also time invariant. That is, the CDR hypothesis is shown to be universally true, as is expected in any law of science. We also calculate the total and marginal contributions to G from entrepreneurship. From the marginal contribution, we obtain the unitary entrepreneurship elasticity and the optimal reinvestment in capital stock.
We proffer that a well learned poor society can skip steps within the technology silo travelled by wealthy countries. For example they can skip whale oil and go straight to subterranean crude oil and gas. They can skip oil and gas and go straight to nuclear power. They can skip land line communications and go straight to mobile cell phone technology. But, to gain wealth, they cannot skip the organizational steps of the CDR law. This is now obvious from all the failed attempts by rich countries to help impecunious countries by way of loans, charity, and transfer of technology. What rich countries need to do is help poor countries develop their institutions (North [1] ) of democracy and rule of law. This will increase their CDR index and G. This is more difficult than it first appears because much of the creation of rich country institutions and property rights were accomplished by trial and error. And, many poor countries have developed a debilitating mindset of distrust for capitalism (Ridley [14], Ridley, Davis and Korovyakovskaya [15], Korovyakovskaya and Ridley [16] ). Poor countries would do better to recognize that CDR is not rapacious capitalism but capitalism in the presence of democracy and rule of law, consistent with the moral sentiments of Adam Smith [17] . Also, it would help greatly to reduce their angst if poor people would recognize that every rational human being is a capitalist (Smith [18] ) who deploys his personal effort so as to maximize his benefit. Should a capitalist who is also an entrepreneur become very rich he can only consume a tiny fraction of the products that he makes. The remainder is consumed by others who might otherwise be less well off. Entrepreneurs devote so much time to risk taking, inventing, and devising ways to manufacture high quality products cheaply so as to be affordable by others, they drastically reduce their own leisure time. The labor saving products that they develop create leisure time for others. That is, entrepreneurship is an act of giving. Instead of worthless envious worrying about equality of income, one should be thankful for all the numerous jobs created and the equality of consumption that rich countries make possible.
CDR is the mechanism that functions through the limited liability company (Micklethwait and Wooldridge [19] ) and requires a number of historical institutions, laws and events. At the behest of English barons in search of rights, English King John offered Magna Carta in 1215. English King Charles II granted the Royal Charter of 1662 for the study of science. Smith [18] recognized the mechanism of division of labor that creates surplus capital. The limited liability law of 1811 was enacted by the American State of New York, soon followed by English and German limited liability laws. These set the stage for the perfect storm that led to the English industrial revolution. It could have happened anywhere in the world where the prevailing conditions were to accumulate. As it turned out, it happened in England on or between 1760 and 1840. Since then, its Western European neighboring countries and their United State of America (USA) settlers and immigrants have never been the same. Whether they realized it or not, they adopted CDR policies and amassed tremendous wealth (Figure 1). At the time of this writing, their economic acceleration is its greatest, while poverty persists elsewhere (Keefer and Knack [20] ). There are no records and no blue prints on how it was done or how to repeat it from the beginning (de Soto [21] ). Still, as best we can tell, wealth comes from human capital. And, each human being brings his or her wealth into the world. Therefore, it is in the positive sum self-interest of rich countries to help raise all country CDR indices so that people in poor countries can also expand the world’s wealth and stability for the benefit of all.
Democracy is a mechanism for exploring a wider and larger set of options and forming consensus through discussing and weighting. It constrains predatory government (Acemoglu and Robinson [22], Acemoglu, Johnson and Robinson [4], North [1], Knack and Keefer [2] ) and provides for better institutional context for growth. It also provides for better corporate decision making regarding the deployment of capital. Even if it were true that the variance of genes is different for different sub populations of human beings, then in the case of more variance, even greater intensity of democracy is required to arrive at the optimal consensus. As the internet enables coordination of individual knowledge throughout the economy, democratic countries only grow richer. But, the internet cannot create democracy where it does not already exist.
The remainder of the paper is organized as follows. Section 2 introduces the mystery of wealth creation. Section 3 discusses the structure of the CDR model.

Figure 1. Gross domestic product after the industrial revolution of 1760 to 1840 shows massive creation of wealth. Previously, mercantilism and colonialism transferred wealth but did not create wealth. Source: Maddison for 1870 to 2006 extended with U.S. Department of commerce, Bureau of Economic Analysis data for 2007-2011.
Section 4 discusses the estimation and global application of the CDR model. Section 5 compares the relative importance of entrepreneurship and capital stock to G generation. Section 6 illustrates the marginal returns on C, D and R. Section 7 illustrates the entrepreneurship elasticity of G. We end with some conclusions in Section 8. Because of the absence of explicit definitions in the extant literature for concepts such as capitalist, capitalism, entrepreneurship and other consequential terminologies, defining nomenclature are given at the end of the paper.
2. How Supply Side Wealth Is Created
Wealth begins in the imagination and creativity of the mind as a human capital idea (Figure 2). Inventions are often considered irrelevant by the many persons who do not see their applications. Indeed, many of the applications will not have been invented as yet. Ideas that arise in the minds of the few may not arise in the minds of the many. Recall the supply side remark by Steve Jobs (1955-2011) that “A lot of times, people don’t know what they want until you show it to them.” And, Henry Ford’s (1863-1947) alleged “If I had asked people what they wanted, they would have said faster horses.” Therefore, the demand side of an economy can only act on existing products, and it cannot be the source of wealth. Division of labor (Smith [18] ) may create surplus capital but it is not the source of wealth. It is an idea, just like C, D and R. All three of these come from the human brain, the same place that all wealth comes from. To help understand this consider the journey from the silk road to Silicon Valley (see Garten [23], Gordon [24] ), and the enormous wealth and philanthropy produced by high technology companies: IBM, GE, Intel, Microsoft, Apple and Google, etc., that are unrelated to natural resources and manufactured goods. Knowledge related to ideas can be taught to other human beings via educational institutions, adding to human capital stock. This division of human capital (researchers, trainers and trainees), in so far as the application of the related knowledge spreads to other human beings and programmable storage devices, creates surplus wealth. Surplus wealth is also created when two or more ideas combine directly to stimulate yet another idea.
CDR is a supply side concept. It expands the supply and types of products and services that are available. It comes from the creation of affordable products, not
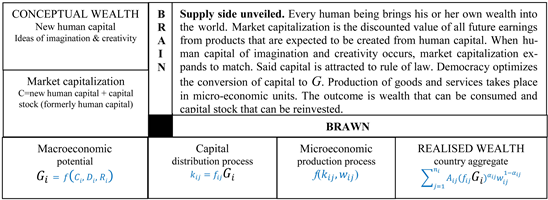
Figure 2. Methods of accounting for G in a perfect environment of democracy and rule of law.
from the demand for products. Affordable products create their own demand (Smith [18] ). The supply side is not necessarily top down. It can be bottom up. For example consider a trash can cleaner. All around the world trash cans were and still are emptied and cleaned by workers. In 1950, Harry Wasylyk and Larry Hansen invented the garbage bag at home. They thought to place a plastic bag in the trash can, then, collect the bag with the trash deposited inside it. They simply tied the bag at the top, collected the trash bag, and replaced it with a new one. The job changed from cleaning to simply collecting. This is an idea that started at the bottom, saved time and effort, thereby creating surplus wealth. This wealth generating change was supplied by the imagination and creative idea of the lowly home trash collector. As more people were taught the idea, the division of human capital created surplus wealth (Ridley [12] ). In the late 1960’s, the bag traveled up the corporate ladder to Union Carbide where it was manufactured. The demand for bags and the demand for plastic increased.
Capitalism is a macro-economic activity measured by market capitalization as an expression of confidence in human capital. Market capitalization is the discounted value of all future earnings from products that are expected to be created from human capital. Therefore, it takes into account current and all future years. Assuming perfect D and R, then simultaneous with the appearance of human capital (brain) is an increase in market capitalization. Simultaneous with the distribution of market capital to investee companies, said products are created in individual micro-economic units of production that employ capital stock and corporeal physical labor (brawn). This operating definition of homogenous labor is consistent with the original theory of comparative advantage (Ricardo [25] ).
A production function relates physical units of inputs to physical units of outputs from a single machine. Therefore, there can be no such thing as a macroeconomic function when the inputs are different types of items, or outputs are different types of items, or outputs are made by different constructs. Furthermore, there is the fallacy of composition that we can simply jump from microeconomic conceptions to an understanding of production by society as a whole (see Cohen and Harcourt [26], and see Ridley and Ngnepieba [27] for a mathematical proof). For this reason it might be that which is defined in the aggregate is a better standalone starting point for the conceptualization of aggregate G. Then, since we will already know G, we do not need an aggregate production function. However, it is assumed here that there exists a macroeconomic domain that maps homeomorphically into microeconomic domains (Ridley and Ngnepieba [27] ). Still, it is only under specific conditions related to elasticities in the Cobb-Douglas function that capital will be preserved under this mapping. And, these conditions are impossible to arrive at in practice. To make seemingly appropriate comparisons, all physical and chemical, etc., inputs and outputs are simply converted to economic value in terms of monetary units. After conversion to monetary units, can be integrated over any region of the economy with no loss of accuracy.
Consider the total value of ideas as measured (estimated) by market capitalization (C), inclusive of current ideas and former ideas that led to the formation of capital stock (K) as measured by fixed capital investment adjusted for depreciation and obsolescence plus skills and knowledge taught to others (see also Day [28] ). The part of C that is available comes from the market of publicly traded stocks. This is the best we can do because the private non-traded part of C is not available and never will be. The total value of innovation from entrepreneurship is C-K. K is measured by the sum of the book value of installed fixed capital and salaries paid to skilled and educated administrative and professional employees, where salaries are assumed to be proportional to the stock of human capital. The value of labor can be measured by wages (W) paid to unskilled hourly workers.
In general, consider m countries, , where country i contains microeconomic production units. Production of is obtained from the sum of micro-economic production units. Consider a deterministic Cobb-Douglas function applied to the jth unit of production in the ith country, where existing capital stock is replaced by capital obtained by the investment of the fraction of , is the matching quantity of physical labor in person-hours per annum, and is the annual value of production. All labor is identical in nature and functionality. Any human differences due to knowledge, experience and skills are transferred into the production capacity of capital stock. Assuming constant returns to scale, then , where is the total factor productivity and and are output elasticities of capital and labor respectively. The total monetary value of production for country is given by
.
The global monetary value of production for all m countries is therefore
3. Structures of CDR
Endogenous variables: The genesis of all wealth is imagination and creativity of the human mind. C is capital that comprises human capital of ideas from entrepreneurs and endogenous accumulated capital stock that was generated from investments in prior ideas, less depreciation and obsolescence. C is measured by the value of outstanding shares of stock sold on the capital markets. C is utilized in the C to G conversion. Some fraction of said G may be reinvested in capital stock. The decision and the fraction to reinvest are random and exogenous. Therefore, the amount reinvested is not predictable by G. Nevertheless, even after depreciation and obsolescence, the remainder can accumulate and become part of subsequent C and G generation. Said capital stock comprises fixed installed capital less depreciation and obsolescence, plus skills and knowledge acquired from entrepreneurs and taught to others. It is interesting to learn how much capital is new human capital and how much is residual capital stock. In this paper we use two stage least squares (2SLS) with latitude as an instrumental variable (IV) to separate exogenous entrepreneurial new human capital from endogenous accumulated capital stock.
Exogenous variables: The part of C that is human capital ideas from entrepreneurs is exogenous. D is the exogenous catalyst that creates new pathways for connecting, generating, extracting and combining ideas from human capital to generate G. Surowiecki [29] explains how the wisdom of crowds can yield a superior decision compared to that of any one member, even when that member is a superior individual. The direction of causation is obviously from D to G. Furthermore, D and R reflect economic freedom, and Gwartney, Holcombe and Lawson [30] [31] used Granger [32] testing to show the direction of causation to be from economic freedom of the world (EFW) to GDP. R is the exogenous catalyst of governance that recognizes property rights and discourages corruption (Goel, Mazhar and Nelson [33], Czap and Nur-tegin [34] ). In this study the reverse of corruption was chosen to represent R. It is a ranking of countries (the Transparency International graphic in Figure A1. depicting corruption speaks volumes). R encompasses property rights, an important feature for economic growth (McCloud and Kumbhakar [35] ). Country rankings based on corruption correspond inversely to country rankings based on property rights. Therefore, the reverse of corruption ranking captures property rights. But, property rights are a complex legal proposition that the average person might not fully understand. On the other hand, the concepts of fairness and justice versus corruption are intuitive.
The catalysts D and R perform a role similar to that suggested by Baron J. J. Berzelius [36] in 1835 to describe the property of substances that speed up or slow down chemical reactions without being consumed in them. D and R are heterogeneous exogenous catalysts because they exist in different structures from each other and from capital and G. That way they can remain robust and incorruptible by the G production that they facilitate. The human capital component of the process is what is now commonly referred to as entrepreneurship.
4. The Global Time Invariant CDR Model
To determine the relative contributions of C, D, R and natural resources (N), we standardize the variables to guarantee upper and lower bounds of 0 ≤ g, C, D, R, C∙D∙R, N ≤ 1 as follows:
Democracy and corruption are rank ordered, where the highest = 1 and the lowest = the number of countries. These transformations are all one hundred percent reversible.
The ordinary least squares (OLS) model is
where represents the ith country, the coefficients and variables are dimensionless, and the errors are random and normally distributed with zero mean and constant standard deviation. We regress g on C, D, R, and N to obtain the ith country estimated g as follows.

The variation in G that is explained by the model is 83%. The remaining 17% is due to unpredictable events such as natural disasters like hurricanes and earth quakes. Additionally, non-publicly traded stocks are not included because there are no data on their capitalization. The largest factor in explaining G is C (59%). This model shows that contrary to commonly held belief, natural resources contribute only 6% to G. C, D and R together contributes about (59 + 5 + 10 + 3)/6 = 13 times. This is in addition to the Dutch disease or natural resources curse they are known to cause [37] - [47] . Ridley [12] gives a didactic account of how Jamaica lost its currency to the bauxite natural resource curse. The C, D and R components have positive coefficients and are significant per the student ᵵ statistic. The coefficient of the interactive term is significant but negative. The negative value is due to friction in the decision making process permitted by a democratic process. It reduces G from the theoretical maximum possible value that would be attainable if the decision makers were in perfect agreement. Any disagreement must subtract from the theoretical optimal contribution. If there were perfect agreement and the agreement was the best possible decision, then the contribution from the interaction could neither be positive nor negative and must be zero. When government spending is added to the regression model (not shown), its coefficient is not significant and there is no change in .
Other growth models such as that of Solow [48] are based on installed capital stock and cannot capture entrepreneurial capital. Prior studies of data from 1949 to 1988 such as those by Adelman and Morris [49], Barro [50], Dick [51], Grier and Tullock [52], Helliwell [53], Huntington and Dominguez [54], Kohli [55], Kormendi and Meguire [56], Landau [57], Marsh [58], Pourgerami [59] [60], Przeworski and Limongi [61] [62], Remmer [63], Scully [64] [65], Sloan and Tedin [66] and Weede [67] excluded the interactive term, which inter alia, explains why the significance of D gave mixed results and was hitherto not captured. The prior mixed results were positive, negative, and no regression coefficient for D. These created the impression that D does not matter, until now. See also Acemoglu, et al. [5], Glaeser, et al. [3] . Also, economic freedom advocated by Friedman and Friedman [68], Friedman [69], Gwartney, Holcombe and Lawson [70], Gwartney and Lawson [71], Heritage Foundation [72], Sowell [73], Rand [74], reduced government and the empowerment of people, are consistent with the CDR model. Economic freedom appears to be working for GDP (Gwartney, Lawson and Hall [74], Hall and Lawson [76] ). But, the Gwartney, Holcombe and R. Lawson’s [31] model that uses the EFW index yielded an , considerably lower than the 83% obtained from the CDR index reported in this paper.
The CDR model may be applied to the global estimation of G (Figure 3). The high correlation between CDR and G is made obvious from the graph. The

Figure 3. Vexillological chart of year 2014 G vs CDR Index for 79 countries (line). Bubble size (21 countries) is the square root of population.
regression line is for 79 countries for which there are complete data and that represent almost all of the world’s population. In addition, the graph shows G bubbles for twenty one countries selected for variety in natural resources, government spending, country size, location, culture and physical characteristics of the population. As the graph is traversed from one end to the other, there is no systematic change in bubble size (population size). The high natural resource countries, namely Russia, Nigeria, Brazil, India to mention just a few have low CDR and G. The low natural resource countries, namely Singapore, Hong Kong, Taiwan, Bermuda, Japan to name a few have high CDR and high G. As noted earlier government spending has no effect on G. Government spending and its source of funds which are taxes, appear to cancel. The countries on the graph are from all over the map, and there is no indication that geographic location, culture and appearance of the population makes any difference. Sowell [73] speculated that geography might play a role but that is not supported here. The only exception is the preponderance of Western Europe and USA in the high G category. It is true that they exist in temperate climate zones, but so do low CDR Eastern Europe and Russia. The unique feature that Western Europe and USA have in common is high CDR. The high cross country of 83% and the straight line relationship between the countries and the CDR index establishes that the CDR model is global invariant.
To investigate the time invariance of the CDR model, the CDR model is re-estimated for different year g’s from 1995 to 2016. The results are shown on Table 1 and Figure 4. The B’s are used in place of since they are the closest to the available characters in the legend of the chart. The Bo’s (not shown) are all zero. For the last nine years from 2010 to 2016 the parameter estimates are nearly identical. For earlier years they are also similar. For all practical purposes the parameter estimates are the same and are therefore time invariant. Repeated year by year estimation does more to show potential variation in parameters than a panel data estimate. Obviously, if the year by year estimates are the same then the panel data estimate must be the same.

Figure 4. CDR model OLS parameters for 22 years.

Table 1. CDR model OLS parameters for 22years.
5. New Human Capital vs. Old Capital Stock from Prior Human Capital
It is recognized that there could be variables that might influence GDP but are missing from the regression model. Such variables cannot be included if they are either not available or measurable. Fortunately, the residuals from the CDR model (Ridley [77] ) are random and normally distributed, and show no patterns that could be attributable to missing variables. That and the high coefficient of multiple determination support the claim that there is no missing variables bias. We wish to decouple exogenous and endogenous capital. This can be accomplished by purging the endogenous capital from the total capital, leaving only exogenous capital. La Porta, et al. [78] identified three possible 2SLS IVs namely legal origin, latitude and ethnolinguistic fractionalization that will be considered here. The only one of these that could be relevant to is latitude. Latitude is a geography variable and geography is well known to impact agriculture. Temperate zones have more productive agriculture and healthier climates, that enhance the development of economies and possibly institutions as well (Landes [79] ). To serve as an IV latitude must be exogenous, and must be correlated with and uncorrelated with . It is obviously exogenous since GDP cannot influence latitude. The other two requirements will be illustrated below. The 2SLS models were fitted as follows. https://www.dropbox.com/s/0lm9se63o3hlljf/CDR%20data%20-%20for%2079%20countries.xlsx?dl=0
The OLS model is
|ᵵ| = (6.6) (1.69) (2.60) (4.40) (5.59)
The 1st stage least squares model is
where the IV is latitude ( ).
The estimated 1st stage least squares model is
|ᵵ| = (3.20) (3.77) (4.64) (6.43) (27.11) (0.61)
The 2nd stage least squares model where is replaced by is
The estimated 2nd stage least squares model for estimating g from exogenous new idea human capital entrepreneurship ( ) is
|ᵵ| = (2.66) (0.88) (1.95) (1.88) (4.45)
The results are summarized in Table 2.
Table 2. 2SLS Regression results.
Since
by construction,
is endogenous if and only if the structural error
If we knew we could calculate the OLS estimate for and perform a ᵵ test for significance. Unfortunately we do not know . Still, following the approach by Hausman ( [80] [81] ), replacing with from the above estimated 1st stage least squares model,
The result of the ᵵ test is that and that is endogenous. After capital stock is purged from the correlation with is negligible: .
The coefficient of is significantly different from zero (|ᵵ| = 3.77), supporting the requirement that be correlated with . The OLS stochastic error is unobservable, so we can only assume that the requirement that is uncorrelated with prevails (or any correlation is negligible). Note however that the coefficient is negative (−0.07), implying that the exogenous capital decreases the further a country is from the equator. No causation is posited for this but as latitude increases, vegetation decreases, and so does life, the source of human capital. Still, it is not important to our main objective here. As it turns out, when latitude is included in the OLS model, it contributes 4% raising to an impressive almost 90%. But, like N, it is negligible and is not under government decision making control. A country cannot move to gain from latitude or natural resources and must focus on raising its CDR index. When the endogenous capital stock is purged from C, the coefficient of capital changes from 1.53 to 1.30, implying that entrepreneurship contributes 100 (1.30/1.53) = 85% to G generation and capital stock contributes 100 (1.53 − 1.3)/1.53 = 15% to G generation. That is, new ideas contribute about 85/15~6 times as much as capital stock from old ideas. The amount of negative friction (−1.21) associated with the interaction when capital includes capital stock is less than the amount of negative friction (−0.98) associated with the interaction when capital is only entrepreneurship. In the case of entrepreneurship only, there could be as few as one person involved in decision making and democracy would not be significant (|ᵵ| = 0.88). In the case of capital stock there are more likely to be many decision makers involved and democracy would be significant (|ᵵ| = 1.69).
The 2nd stage least squares model is a less efficient estimator of G by the difference in of 0.83 − 0.74 = 0.09 per unit or 9%. The contribution of total capital to . So, this shows that new ideas are about (59 − 9)/9~6 times as important for economic growth as is capital stock from old ideas from a previous time. That is, it shows how rapidly capital stock declines from depreciation and obsolescence. Resting on our laurels is the wrong policy. Inheritance, when unenhanced, lasts only a short time. This is consistent with what we know that seventy percent of rich families lose their inheritance by the second generation. And, ninety percent lose it in three generations (Taylor [82] ). This is also consistent with and illustrated by the speed with which countries that adopted CDR policies (Chile, Poland, Hong Kong, Singapore) attracted human capital new ideas, thereby experiencing increases in G relative to their neighbors who would have had to rely on capital stock from old ideas.
This declining stock observation could be extended to the case of welfare. All rich countries have the problem of what to do about the indigent. With what appears to be an accumulation of capital stock, it is so unseemly that a rich country should be defined by its poor. The solution to date has been to institute minimum wage laws that put unqualified persons out of work, followed by welfare for the unemployed, paid for out of the apparent capital stock. But, welfare recipients cannot contribute to new idea generation for the simple reason that they are not engaged in the capital to G conversion process. Their payments from capital stock are not unlike inheritances, or the taxing thereof that accelerates its depletion. This is despite the potential 6 to 1 ratio from their potential contribution versus capital stock. Minimum wage workers may not be qualified to work in research and development. But, consider a negative income tax government wage supplement that places workers in jobs where their experience just does not justify them being hired. In addition to working, numerous small contributions of ideas on how to improve their job will occur in all kinds of ways and at times that are highly unpredictable. These are the kinds of ideas that only workers are likely to see, thereby making them eminently qualified in that sense. The negative income tax wage supplement could pay for itself from these micro innovations. Then, in about six months to a year the worker may become worth what the government defines as a living wage, and the employer will be willing to pay said wage with no need for any supplement (Ridley [13] ).
The above section on the structures of CDR explains why D and R are heterogeneous exogenous catalysts and therefore cannot in theory be endogenous. Still, D was tested for endogeneity using legal origin, latitude and ethnolinguistic fractionalization as 2SLS IVs for democracy. But, their regression coefficients were all found to be first stage insignificant.
The revised 2SLS parameters estimated for years 1995-2016 are given in Table 3. To demonstrate that the revised model has all exogenous regressors, a plot of the time variant parameter estimates is shown in Figure 5.
Consistency in the estimator of a parameter requires that the sampling distribution of the estimator becomes increasing concentrated around the population value as the sample size increases. In this case, as the sample goes from 2016 to 2016, 2015 to 2016, 2014 to 2016, 2013 to 2016, and so on. The Bd, Br and Bn parameter estimates from the CDR and ĈDR models are approximately constant for 22 years. They converge in the forward direction of time. The Bc and Bcdr estimates are approximately constant for the most recent 10 years. Prior to 2008, capitalization data were not available for all countries. So capitalization was held constant. Therefore, Bc and Bcdr increased in absolute value as G was decreasing, going back in time and capitalization was held constant. Constancy and convergence of the parameter estimates demonstrates model stability and consistency. In the case of the ĈDR model, it demonstrates that endogenous capital

Figure 5. model 2SLS parameters for 22 years.
Table 3. CDR model 2SLS parameters for 22 years.
stock K was purged from total capital to leave only exogenous entrepreneurship human capital . So, if the ĈDR model contains only exogenous regressors, the 2SLS parameter estimates must be best linear unbiased (blue) estimators. So the 2SLS parameters estimates are unbiased. The CDR data came from a real life uncontrolled experiment, but the 2SLS process yields a global time invariant ĈDR scientific law. Even if there were some bias, the model would yield useful stable estimates. Some two hundred and forty years after Adam Smith [18] announced an inquiry into the nature and causes of the wealth of nations, the cause is found to be capitalism, democracy and rule of law, and the ĈDR model places economics on a sound scientific footing.
6. Total and Marginal Contribution to g
The following analysis of total and marginal contributions is based on the revised 2SLS regression model. The total country contribution is . The marginal contributions to the mean in (denoted by ) from , is the partial derivative , for different fixed values of . The product is a product of fractions and is therefore small but positive. Therefore, the negative values for implies that .
Consider the scenario where a fraction of is reinvested in capital stock, such that
.
Then,
And, the marginal return on entrepreneurial capital ( ) is
.
The marginal utilities of D and R are
Simplifying,
The following will omit the country notation and apply the same fraction to all countries. The total contribution to g and marginal contribution from for three different fractions of reinvestment in capital stock are plotted in Figure 6(a) and Figure 6(b). In each case, g increases with C = D = R until C = D = R is approximately 0.75 then it declines. The post peak decline in g is due to the interaction effect of which can only be zero or negative. The peak g is 0.85 when there is no reinvestment. Higher peaks in g occur when the fraction reinvested is 0.1 and 0.2. This implies that division of human capital creates surplus g. The marginal return on falls with increasing D and R. Higher marginal returns occur when the fraction reinvested is 0.1 and 0.2. The difference in marginal return due to fraction reinvested is least when D and R are highest. Note that in reality there will be depreciation and obsolescence in capital
 (a)
(a) (b)
(b) (c)
(c)
Figure 6. (a) Total contributions to g; (b) Marginal contribution to g; (c) Entrepreneurship elasticity of g.
stock that reinvestment must surpass. https://www.dropbox.com/s/0lm9se63o3hlljf/CDR%20data%20-%20for%2079%20countries.xlsx?dl=0
7. Entrepreneurship Capital Elasticity of g
The entrepreneurial capital ( ) elasticity of g is defined from the percentage change in g in response to a 1% change in , ceteris paribus. This point elasticity can be investigated directly from the marginal return on . That is, from . From Figure 6(c), in general, as D and R increase, the elasticity of g falls. When there is no reinvestment (f = 0), g is always inelastic. As the reinvestment fraction increases to f = 0.1 and 0.2, the elasticity increases. If a unitary elasticity of 1.0 can be obtained for some combination of these variables, such that g is maximized, then the policy suggested is to reinvest about 10% when D and R are between 0 and 0.5. As D and R increase from 0.5 to 0.9, increase the fraction of reinvestment in like manner to about 20%. As D and R increase from 0.9 to 1.0, the fraction of reinvestment should be increased to about 25%. Assuming uniform distribution across countries, the average is about 10% + (25 − 10)% × 0.5 = 17.5%. Adding 3.5% for depreciation and obsolescence brings this number up to 21%. This is consistent with the World Bank report of 21% for year 2014 worldwide average gross fixed capital formation (GFCF). GFCF does not include book value recovery of depreciation for tax purposes, but it does include actual replacements. Neither one of these includes capital stock investment in training to develop knowledge and skills. Therefore, we proffer that the theoretical function is validated by the empirical GFCF.
8. Conclusions
The CDR model is a global time invariant scientific law. The law governs the mechanism by which human capital is converted to wealth for bifurcation into consumption and capital stock for future investment. The unitary capital elasticity of G provides an optimal policy guide for the CDR and reinvestment strategy that maximizes G. The contribution to G from intangible C, D and R is about thirteen times that from tangible natural resources. The law permits decoupling of exogenous and endogenous components of capital to calculate the values of new entrepreneurship ideas versus old capital stock. The contribution from entrepreneurship is about six times that from capital stock. If the source of wealth is indeed the human mind, then if entrepreneurial imagination and creativity are unlimited (Lotto [83] ), then wealth is unlimited (Ridley [11] ). Each human being brings his or her own wealth into the world. Ideas are the natural born enemy of the way things are. For only change can usher in new wealth. Sometimes it is the people among whom no one imagines anything of who do the things that no one can imagine (Moore [84] ). If wealth were fixed, each child could only contribute to the impoverishment of everybody else. The phenomenal wealth creation by the countries that have implemented CDR policies commensurate with population increases there, is proof that there is no such impoverishment. A country that knows where it is going will not get far. A country willing to create an entrepreneurial environment of risk taking and investment in the unknown may experience unlimited growth. Ridley [85], Llaugel and Ridley [86], and Ngnepieba, et al. [87] suggest ways for introducing university students to CDR growth economics as the source of human ideas of imagination and creativity.
In the mystery of capital, Hernando de Soto [21] implied that capital is hidden in land assets that can be acquired by titling through the property rights feature of rule of law. In reality, such a combination of assets and titles will remain barren in the absence of ideas. It will fall short of being working capital. Property is collateral that can be used to obtain financial capital. But, the true source of wealth is really the human capital of imagination and creativity of the mind. The remainder of the human being is physical labor. Human capital is contained in total capital measured by market capitalization. Wealth is realized through CDR. Rule of law attracts capital and democracy deploys it optimally to generate wealth contribution as measured by G. Assuming perfect democracy and rule of law, hence high signal to noise ratio channels of new quanta of entrepreneurial information, market capital expands and shrinks to match expansion and shrinkage in entrepreneurial imagination and creativity. Only a small number of sui generis people will be entrepreneurs. What the CDR model suggests is that an entrepreneurial environment is required such that when the entrepreneur does come along their message gets heard and acted on. Also contained in market capitalization may be capital for which fungible property based collateral is pledged. The capital that is deployed to appropriate units of production is converted to G. G is generated from CDR, independently of government spending, country size, culture, and physical characteristics of the population. Natural resources and location are negligible. The human capacity for ideas (human capital and entrepreneurship), and the virtues of democracy and rule of law are all that are required. Even if certain limiting human characteristics or natural resources were obstacles in some nations, CDR is salutary to economic development in terms of making the best of what is possible. As countries adopt policies that decrease CDR, their G falls. Such is the mystery of poverty. As countries adopt policies that increase CDR, their G increases. Such is the mystery of wealth. This is as far as science can take us (Ball [88] ). Counting on the next random invention is a leap of faith. The recommendation from this research is that low income countries should adopt a policy to raise their CDR index. Future research can investigate whether or not there is a relationship between the Singapore bonus system for government employees, their raised CDR index, and ultimately their impressively high GDP.
Acknowledgements
The author would like to thank FAMU’s Shawnta Friday-Stroud, Victor Oguledo and Nathaniel Johnson and FSU’s Randall Holcombe and Hugo Montesinos Yufa for probing questions and good discussions; Supercomputer Computations Research Institute’s Dennis Duke for questions on economic science for Paul Beaumont and myself in the early 1990’s; and the Chicago informed Clemson University laissez-faire school of economic thought, but takes full responsibility for any errors and omissions even after the discussants made their own views clear.
Conflicts of Interest
The author declares no conflicts of interest regarding the publication of this paper.
Cite this paper
Ridley, D. (2018) General Theory of Economics: CDR Supply Side Scientific Growth Law Unveiled. Theoretical Economics Letters, 8, 3637-3663. https://doi.org/10.4236/tel.2018.815223
References
- 1. North, D.C. (1991) Institutions. Journal of Economic Perspectives, 5, 97-112. https://doi.org/10.1257/jep.5.1.97
- 2. Knack, S. and Keefer, P. (1995) Institutions and Economic Performance: Cross Country Tests Using Alternative Institutional Measures. Economic & Politics, 7, 207-227. https://doi.org/10.1111/j.1468-0343.1995.tb00111.x
- 3. Glaeser, E. L., La Porta, R., Lopez-de-Silanes, F. and Shleifer, A. (2004) Do Institutions Cause Growth. Journal of Economic Growth, 9, 271-303. https://doi.org/10.1023/B:JOEG.0000038933.16398.ed
- 4. Acemoglu, D., Johnson, S., and Robinson, J.A. (2005) Institutions as a Fundamental Cause of Long-Run Growth. Handbook of Economic Growth, 1, 385-472. https://doi.org/10.1016/S1574-0684(05)01006-3
- 5. Acemoglu, D., Naidu, S., Restrepo, P. and Robinson, J.A. (2014) Democracy Does Cause Growth (No. w20004). National Bureau of Economic Research. https://doi.org/10.3386/w20004
- 6. Schumpeter, J.A. (1911) Theory of Economic Development. Harvard University Press, Cambridge.
- 7. Schumpeter, J.A. (1928) The Entrepreneur. In: Becker, M., Knudsen, T. and Swedberg, R., Eds., 2011. The Entrepreneur: Classic Texts by J. Schumpeter, Stanford University Press, Stanford, CA, 227-260.
- 8. Schumpeter, J.A. (1954) A History of Economic Analysis. Allen & Unwin, London.
- 9. Malthus, T.R. (1798, 1970) An Essay on the Principle of Population. Pelican Books, London.
- 10. Simon, J. (1981) The Ultimate Resource. Princeton University Press, Princeton.
- 11. Ridley, A.D. (2017) Wealth Is All in the Mind. International Journal of Social Science & Economic Research, 2, 3369-3379. http://ijsser.org/uploads/ijsser_02__208.pdf
- 12. Ridley, A.D. (2017) Division of Human Capital Creates Surplus Wealth. Bulletin of Political Economy, 11, 1-20. http://www.serialsjournals.com/serialjournalmanager/pdf/1520053852.pdf
- 13. Ridley, A.D. (2017) Micro Intrapreneurship. International Journal of Social Science & Economic Research, 2, 4729-4743. http://ijsser.org/uploads/ijsser_02__299.pdf
- 14. Ridley, A.D. (2016) The Entrepreneurial Community. Journal of Management and Engineering Integration, 9, 41-51.
- 15. Ridley, A.D., Davis, B. and Korovyakovskaya, I. (2017) Entrepreneurial Mindset and the University Curriculum. Journal of Higher Education Theory and Practice, 17, 79-100.
- 16. Korovyakovskaya, I. and Ridley, A.D. (2017) An Entrepreneurship Strategy for a Russian Curriculum. Journal of Economy and Entrepreneurship, 11, 438-443.
- 17. Smith, A. (1759, 2006) The Theory of Moral Sentiments. Dover Publications, New York.
- 18. Smith, A. (1776, 2000) An Inquiry into the Nature and Causes of the Wealth of Nations. Tantor.
- 19. Micklethwait, J. and Wooldridge, A. (2003) The Company. Random House, New York.
- 20. Keefer, P. and Knack, S. (1997) Why Don’t Poor Countries Catch Up? A Cross-National Test of an Institutional Explanation. Economic Inquiry, 35, 590-602. https://doi.org/10.1111/j.1465-7295.1997.tb02035.x
- 21. de Soto, H. (2000) The Mystery of Capital. Basic Books, New York.
- 22. Acemoglu, D. and Robinson, J.A. (2013) Why Nations Fail: The Origins of Power, Prosperity, and Poverty. Broadway Business.
- 23. Garten, J. (2016) From Silk to Silicon: The Story of Globalization through Ten Extraordinary Lives. Harper Collins, New York.
- 24. Gordon, R.J. (2016) The Rise and Fall of America Growth. Princeton University Press, Princeton, NJ. https://doi.org/10.1515/9781400873302
- 25. Ricardo, D. (1817) On the Principles of Political Economy and Taxation. J. M. Dent & Sons, 1911, Dover, 2004.
- 26. Cohen, A.J. and Harcourt, G.C. (2003) Retrospectives: Whatever Happened to the Cambridge Capital Theory Controversies? Journal of Economic Perspectives, 17, 199-214. https://doi.org/10.1257/089533003321165010
- 27. Ridley, A.D. and Ngnepieba, P. (2018) Conservation of Capital: Homeomorphic Mapping from Intangible Aggregate Macro-Economic CDR Space into Tangible Micro-Economic Production Spaces. Theoretical Economics Letters, 8, 2103-2115. https://doi.org/10.4236/tel.2018.811138
- 28. Day, C. (2016) Non-Scale Endogenous Growth with R&D and Human Capital. Scottish Journal of Political Economy, 63, 443-467. https://doi.org/10.1111/sjpe.12115
- 29. Surowiecki, J. (2005) The Wisdom of Crowds. Random House, New York.
- 30. Gwartney, J., Holcombe, R. and Lawson, R. (2004) Economic Freedom, Institutional Quality, and Cross-Country Differences in Income and Growth. Cato Journal, 24, 205-233.
- 31. Gwartney, J., Holcombe, R. and Lawson, R. (2006) Institutions and the Impact of Investments and Growth. Kyklos, 59, 255-273. https://doi.org/10.1111/j.1467-6435.2006.00327.x
- 32. Granger, C.W.J. (1969) Investigating Causal Relations by Econometric Models and Cross-Spectral Methods. Econometrica, 37, 424-438. https://doi.org/10.2307/1912791
- 33. Goel, R.K., Mazhar, U. and Nelson, M.A. (2016) Corruption across Government Occupations: Cross-National Survey Evidence. Journal of International Development, 28, 1220-1234. https://doi.org/10.1002/jid.3040
- 34. Czap, H.J. and Nur-tegin, K.D. (2012) Government Positions for Sale—A Model of Grand Corruption. Business and Politics, 14, 1-25. https://doi.org/10.1515/1469-3569.1414
- 35. McCloud, N. and Kumbhakar, S.C. (2012) Institutions, Foreign Direct Investment and Growth: A Hierarchical Bayesian Approach. Journal of the Royal Statistical Society (A), 175, 83-105. https://doi.org/10.1111/j.1467-985X.2011.00710.x
- 36. (1779-1848) Jons Jacob Berzelius. https://en.wikipedia.org/wiki/J%C3%B6ns_Jacob_Berzelius
- 37. Auty, R. (1993) Sustaining Development in Mineral Economies: The Resource Curse Thesis. Routledge, London.
- 38. Frankel, J.A. (2012) The Natural Resource Curse: A Survey of Diagnoses and Some Prescriptions. HKS Faculty Research Working Paper Series RWP12-014, John F. Kennedy School of Government, Harvard University.
- 39. Humphreys, M. (2005) Natural Resources, Conflict and Conflict Resolution. Journal of Conflict Resolution, 49, 508-537. https://doi.org/10.1177/0022002705277545
- 40. Norman, C. (2009) Rule of Law and the Resource Curse: Abundance versus Intensity. Environmental Resource Economics, 43, 183-207. https://doi.org/10.1007/s10640-008-9231-y
- 41. Peach, J. and Starbuck, C.M. (2011) Oil and Gas Production and Economic Growth in New Mexico. Journal of Economic Issues, 45, 511-526. https://doi.org/10.2753/JEI0021-3624450228
- 42. Sachs, J. and Warner, A.M. (2001) Natural Resources and Economic Development: The Curse of Natural Resources. European Economic Review, 45, 827-838. https://doi.org/10.1016/S0014-2921(01)00125-8
- 43. Sala-i-Martin, X. and Subramanian, A. (2003) Addressing the Natural Resource Curse: An Illustration from Nigeria. NBER Working Paper No. 9804, National Bureau of Economic Research, Cambridge, MA. https://doi.org/10.3386/w9804
- 44. van der Ploeg, F. (2011) Natural Resources: Curse or Blessing? Journal of Economic Literature, 49, 366-420. https://www.aeaweb.org/articles?id=10.1257/jel.49.2.366 https://doi.org/10.1257/jel.49.2.366
- 45. Wadho, W.A. (2014) Education, Rent Seeking and the Curse of Natural Resources. Economics & Politics, 26, 128-156. https://doi.org/10.1111/ecpo.12029
- 46. Murphy, K.M., Shleifer, A. and Vishny, R.W. (1991) The Allocation of Talent: Implication for Growth. The Quarterly Journal of Economics, 106, 503-530. https://doi.org/10.2307/2937945
- 47. Murphy, K.M., Shleifer, A. and Vishny, R.W. (1993) Why Is Rent-Seeking So Costly to Growth? The American Economic Review, 83, 409-414.
- 48. Solow, R.M. (1956) A Contribution to the Theory of Economic Growth. Quarterly Journal of Economics, 70, 65-94. https://doi.org/10.2307/1884513
- 49. Adelman, I. and Morris, C. (1967) Society, Politics and Economic Development. Johns Hopkins University Press, Baltimore.
- 50. Barro, R.J. (1996) Democracy and Growth. Journal of Economic Growth, 1, 1-27. https://doi.org/10.1007/BF00163340
- 51. Dick, W.G. (1974) Authoritarian versus Nonauthoritarian Approaches to Economic Development. Journal of Political Economy, 82, 817-827. https://doi.org/10.1086/260236
- 52. Grier, K.B. and Tullock, G. (1989) An Empirical Analysis of Cross-National Economic Growth, 1951-1980. Journal of Monetary Economics, 24, 259-276. https://doi.org/10.1016/0304-3932(89)90006-8
- 53. Helliwell, J.F. (1992) Empirical Linkages between Democracy and Economic Growth. NBER Working Paper #4066, National Bureau of Economic Research, Cambridge.
- 54. Huntington, S.P. and Dominguez, J.I. (1975) Political Development. In: Greenstein, F.I. and Polsby, N.W., Eds., Handbook of Political Science, Addison-Wesley, Reading, 1-114.
- 55. Kohli, A. (1986) Democracy and Development. In: Lewis, J.P. and Kallab, V., Eds., Development Strategies Reconsidered, Transaction Books, New Brunwick, 153-182.
- 56. Kormendi, R.C. and Meguire, P.G. (1985) Macroeconomic Determinants of Growth: Cross-Country Evidence. Journal of Monetary Economics, 162, 141-163. https://doi.org/10.1016/0304-3932(85)90027-3
- 57. Landau, D. (1986) Government and Economic Growth in the Less Developed Countries: An Empirical Study for 1960-1980. Economic Development and Cultural Change, 35, 35-75. https://doi.org/10.1086/451572
- 58. Marsh, R.M. (1988) Sociological Explanations of Economic Growth. Studies in Comparative International Development, 23, 41-76. https://doi.org/10.1007/BF02686984
- 59. Pourgerami, A. (1988) The Political Economy of Development: A Cross-National Causality Test of Development-Democracy-Growth Hypothesis. Public Choice, 58, 123-141. https://doi.org/10.1007/BF00125718
- 60. Pourgerami, A. (1991) The Political Economy of Development. An Empirical Investigation of the Wealth Theory of Democracy. Journal of Theoretical Politics, 3, 189-211. https://doi.org/10.1177/0951692891003002005
- 61. Przeworski, A. and Limongi, F. (1993) Political Regimes and Economic Growth. Journal of Economic Perspectives, 7, 51-69. https://doi.org/10.1257/jep.7.3.51
- 62. Przeworski, A. and Limongi, F. (1997) Modernization Theories and Facts. World Politics, 49, 155-183. https://doi.org/10.1353/wp.1997.0004
- 63. Remmer, K. (1990) Democracy and Economic Crisis: The Latin American Experience. World Politics, 42, 315-335. https://doi.org/10.2307/2010414
- 64. Scully, G.W. (1988) The Institutional Framework and Economic Development. Journal of Political Economy, 96, 652-662. https://doi.org/10.1086/261555
- 65. Scully, G.W. (1992) Constitutional Environments and Economic Growth. Princeton University Press, Princeton. https://doi.org/10.1515/9781400862832
- 66. Sloan, J. and Tedin, K.L. (1987) The Consequences of Regimes Type for Public-Policy Outputs. Comparative Political Studies, 20, 98-124. https://doi.org/10.1177/0010414087020001005
- 67. Weede, E. (1983) The Impact of Democracy on Economic Growth: Some Evidence from Cross-National Analysis. Kyklos, 36, 21-39. https://doi.org/10.1111/j.1467-6435.1983.tb02659.x
- 68. Friedman, M. and Friedman, R. (1980) Free to Choose. Houghton, Mifflin, Harcourt Publishing Company, Inc., New York.
- 69. Friedman, M. (2002) Capitalism and Freedom. University of Chicago Press, Chicago.
- 70. Gwartney, J., Holcombe, R. and Lawson, R. (1999) Economic Freedom and the Environment for Economic Growth. Journal of Institutional and Theoretical Economics, 155, 643-663.
- 71. Gwartney, J. and Lawson, R. (2003) The Concept and Measurement of Economic Freedom. European Journal of Political Economy, 19, 405-430. https://doi.org/10.1016/S0176-2680(03)00007-7
- 72. Heritage Foundation (1995-2016). http://www.heritage.org/index/about
- 73. Sowell, T. (2015) Wealth, Poverty and Politics. Blackstone Audio, Inc., Ashland.
- 74. Rand, A. (1961) The Virtue of Selfishness. New American Library, Penguin Group, New York. https://www.youtube.com/watch?v=3u8Jjth81_Q https://www.youtube.com/watch?v=rydsea_Y8xI
- 75. Gwartney, J., Lawson, R. and Hall, J. (2015) Economic Freedom of the World Annual Report. Fraser Institute, Vancouver.
- 76. Hall, J.C. and Lawson, R.A. (2014) Economic Freedom of The World: An Accounting of the Literature. Contemporary Economic Policy, 32, 207-227. https://doi.org/10.1111/coep.12010
- 77. Ridley, A.D. (2018) GDP Forecasting by CDR Composition. International Journal of Economics, Business and Management Research, 2, 103-109. http://ijebmr.com/uploads2018/IJEBMR_02_274.pdf
- 78. La Porta, R., Lopez-de-Silanes, F., Shleifer, A. and Vishny, R. (1999) The Quality of Government. Journal of Law, Economics and Organization, 15, 222-279. https://doi.org/10.1093/jleo/15.1.222
- 79. Landes, D. (1998) The Wealth and Poverty of Nations. W. W. Norton, New York.
- 80. Hausman, J.A. (1978) Specification Tests in Econometrics. Econometrica, 46, 1251-1271. https://doi.org/10.2307/1913827
- 81. Hausman, J. (1983) Chap. 7. Specification and Estimation of Simultaneous Equations Models. In: Grilliches, Z. and Intrillagator, M.D., Eds., Handbook of Econometrics, Vol. 1, North Holland, Amsterdam, 391-448.
- 82. Taylor, C. (2018) 70% of Rich Families Lose Their Wealth by the Second Generation. http://time.com/money/3925308/rich-families-lose-wealth/
- 83. Lotto, B. (2017) Deviate: The Science of Seeing Differently. Orion Publishing Group, London.
- 84. Moore, G. (2014) Screen Play: The Imitation Game. The Weinstein Company, New York.
- 85. Ridley, A.D. (2018) Entrepreneurial Economics: Revising the Econ 101 Course. International Journal of Economics, Business and Management Research, 2, 183-207. http://ijebmr.com/uploads2018/IJEBMR_02_280.pdf
- 86. Llaugel, F. and Ridley, A.D. (2018) Entrepreneurial Engineering: Revising the Engineering 101 Course. International Journal of Economics, Business and Management Research, 2, 258-271.
- 87. Ngnepieba, P., Ridley, A.D., Stephens, D., Johnson, L. and Edington, M. (2018) Entrepreneurial Mathematics: Revising the Math101 Course. International Journal of Economics, Business and Management Research, 2, 272-285. http://ijebmr.com/uploads2018/IJEBMR_02_287.pdf
- 88. Ball, P. (2012) Curiosity: How Science Became Interested in Everything. University of Chicago Press, Chicago.
Appendix A
A.1. Summary list of significant new CDR findings
Intangible C, D an R contribute thirteen times more to G than do tangible natural resources.
New ideas contribute approximately six times that of capital stock from old ideas.
The theoretical optimal reinvestment fraction estimated from CDR is equal to empirical GFCF.
Capital to G conversion is global time invariant.
Natural resources effect on G is negligible.
Government spending effect on G is negligible.
Country population size effect on G is negligible.
Location effect on G is negligible.
Culture effect on G is negligible.
Population physical characteristics effect on G is negligible.
Wealth is unlimited.
A.2. Nomenclature
Endogenous: Generated from within a system.
Entrepreneurship: The process of starting a business, typically a startup company offering an innovative product, process or service.
Exogenous: Generated from outside a system.
Capitalist: A person who deploys his personal capital so as to maximize his benefit.
Capitalism: Mechanism for the collection and assembly of capital.
Capital stock: Fixed installed capital less depreciation and obsolescence plus skills and knowledge acquired from entrepreneurs and taught to others.
Catalysis: The creation of alternative pathways to enable a process.
CDR index: The vector inner product (dot product) of the global constant [1.53 0.14 0.23 −1.21] and the country [C D R C∙D∙R].
Company: The instrument of capitalism for the profitable investment of capital.
Democracy: Private work force idea participation and periodic election of public representatives (catalyst for the process of generating G from capital).
Gross domestic product: The monetary value of all the finished goods and services produced within a country’s borders in a specific time period (economic growth = GDP per capita).
Limited liability: Limitation of loss to capital invested.
Natural resources rents: Surplus value of natural resources after all costs and normal returns are accounted for.
Property rights: Property is a legal expression of an economically meaningful consensus by people about assets, how they should be held, used and exchanged.
Rule of Law: Reverse of corruption (protection of shareholder and other property rights) (catalyst for the attraction of capital).
Shareholder: An owner of shares in a company.
Virtue: Self-governing human property that promotes fairness and justice without the need for central government.
A.3. World Corruption
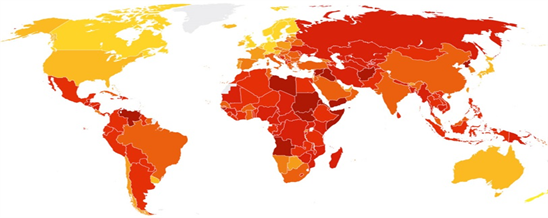
Figure A1. Corruption Perceptions Index 2016. Lighter color less corruption. Darker color more corruption. Source: Transparency International www.transparency.org/cpi.