Contrast Sensitivity and Eye Drops 61
Healthy volunteers without any ocular disease were
recruited for this study. Personal medical history was
recorded and all subjects were free of medication. Indi-
viduals reporting symptoms of dry eye or using any other
ophthalmic eye drops (natural tears included) and contact
lenses were excluded from the study. Written informed
consent was obtained from each participant. After a short
explanation of the procedure about to be followed sub-
jects were examined by an ophthalmologist under a slit
lamp. Individuals with abnormal findings from the ante-
rior segment or the fundus were also excluded. All indi-
viduals had Snellen visual acuity of 10/10.
A total of one hundred and twenty volunteers were el-
igible for inclusion and were finally enrolled in the study.
All participants had best-corrected visual acuity of 10/10
or better. The study adhered to the tenets of the Declara-
tion of Helsinki and the procedure followed a standard
protocol that was consistent across the examination.
The participants were randomly divided in four groups.
Each group consisted of 30 subjects, 15 males and 15
females. The CS function of each subject was assessed
with the Mentor B-VAT II-SG video acuity tester (Men-
tor O & O, Norwell, Mass). This monitor has been used
for the evaluation of visual function in several conditions
[6,7]. Apart from its other features, the monitor uses si-
nusoidal gratings of different spatial frequencies and
contrast levels for CS function measurements. In specific,
sixteen spatial frequencies are available from 1.5 c/d to
40 c/d yet we examined the CS function of our subjects
at 1.5 c/d, 3.0 c/d, 4.6 c/d, 6.0 c/d, 8.5 c/d, 12 c/d and 20
c/d. For every spatial frequency there are available thirty
two contrast levels varying from 98% to 0.1% of contrast.
From 98% to 16% contrast levels can be changed in steps
of 0.1 log CS units whilst from 10% to 0.1% contrast
level the log CS units are allocated at regular intervals of
0.2 log units.
The psychophysical method used was the three alter-
native forced choice. Subjects were left to adapt to me-
sopic conditions wearing their best-spectacle correction.
The test luminance was automatically calibrated to 85
cd/m2 and the sinusoidal gratings were presented by the
examiner for approximately 5 seconds using a hand held
controller. Grating’s orientation could be vertical, –14˚ to
the left or +14˚ to the right from vertical. The orientation
varied randomly between the trials. The measurements
advanced gradually from a higher to a lower contrast
level. At each level the subject was asked to identify the
grating’s orientation at four different trials. When three
out of four responses were correct (at random sequence)
the contrast level was considered to be passed and the
examiner advanced to a lower one. The last contrast level
they passed was defined as the contrast threshold of the
eye and was recorded. The measurements obtained were
converted to log CS for the statistical analysis. The test
was performed at a 3-meter distance.
CS was recorded for both eyes at baseline examination
before the instillation of the drugs.
After an initial assessment of CS in the 1st group of
patients (mean age 30.83 ± 10.13 years) diclofenac so-
dium eye drops were instilled, in the 2nd group (mean
age 31.73 ± 10.95 years) latanoprost eye drops, in the 3rd
group (mean age 32.60 ± 10.08 years) dorzolamide hy-
drochloride/timolol maleate and in the 4th group (mean
age 32.43 ± 8.86 years) brimonidine tartrate.
After the baseline CS examination the test was re-
peated 20 and 40 minutes after the instillation.
The data obtained were analyzed using paired-samples
t-test to assess the CS changes 20 minutes after the in-
stillation, given that the scores returned to baseline levels
40 minutes after the drug instillation for all groups and at
any spatial frequency. All statistical analyses were per-
formed using SPSS version 18.0 software (SPSS Inc.,
Chicago, IL); p < 0.05 was judged as statistically signifi-
cant.
3. Results
The log CS was recorded for all groups 20 and 40 min-
utes after the eye drop instillation.
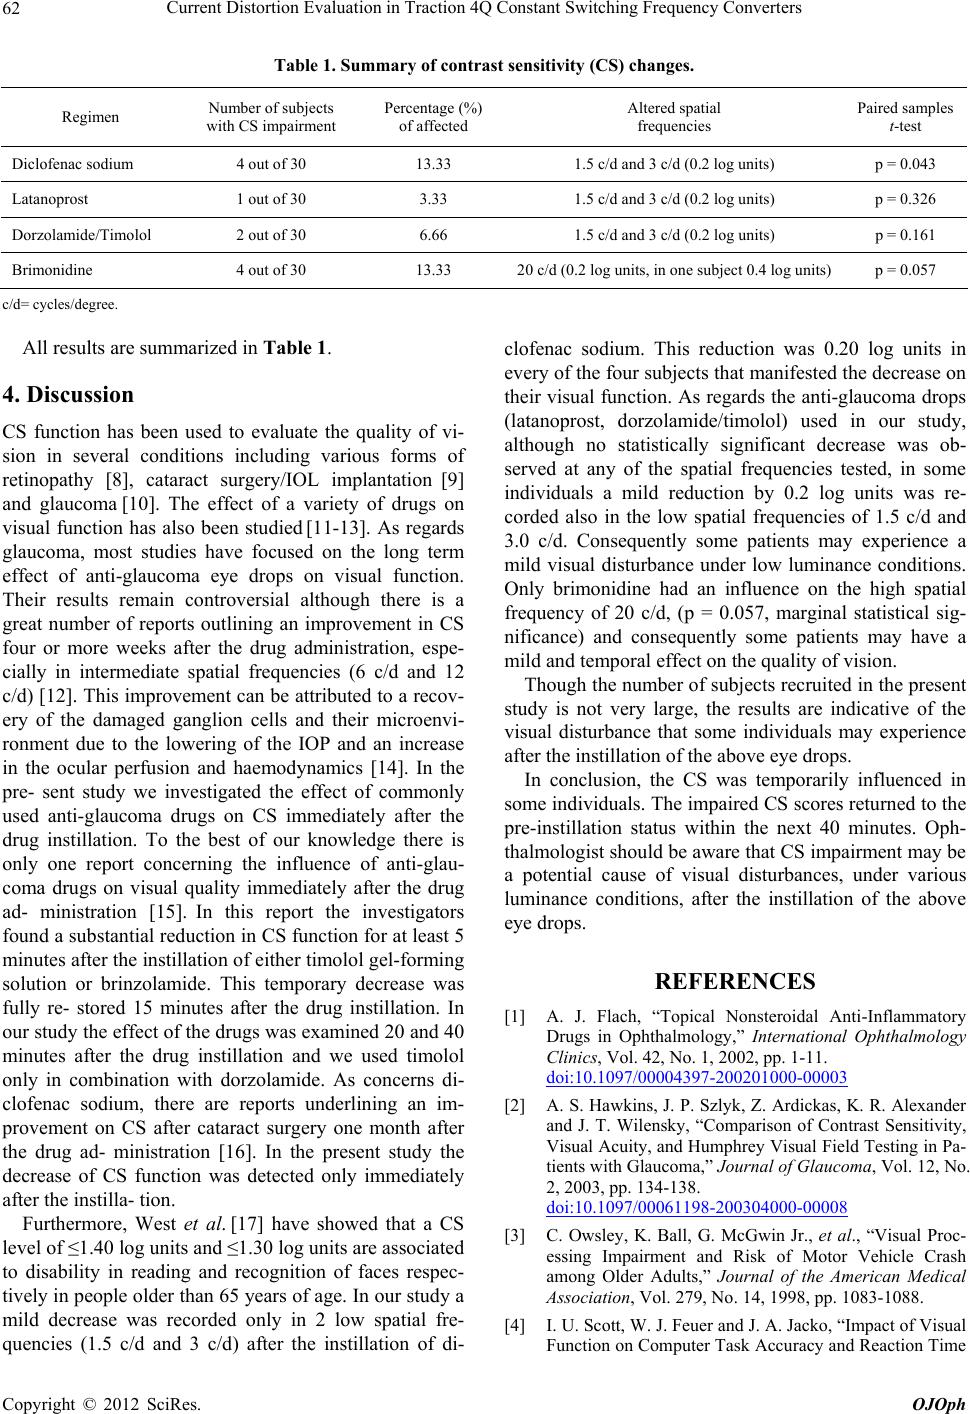
As regards the first group (diclofenac sodium), a mild
CS decrease by 0.2 log units was observed in 4 out of 30
subjects (13.33%) 20 minutes after the instillation at spa-
tial frequencies of 1.5 c/d and 3 c/d (p < 0.05, p = 0.043,
paired samples t-test).
Concerning the second group (latanoprost), log CS
was decreased by 0.2 log units in only 1 out of 30 sub-
jects (3.33%) 20 minutes after the instillation at spatial
frequencies of 1.5 c/d and 3 c/d. This change was not
statistically significant (p = 0.326, paired samples t-test).
In the third group (dorzolamide/timolol) 2 out of 30
subjects (6.66%) showed also a decrease in CS by 0.2 log
units at spatial frequencies of 1.5 c/d and 3 c/d 20 min-
utes after the instillation. Though this change was not
found to be statistically significant (p = 0.161, paired
samples t-test) in the group of the examined subjects.
In the fourth group (brimonidine) 4 out of 30 subjects
(13.33%) showed a decrease in CS by 0.2 log units (in
one subject 0.4 log units) 20 minutes after the eye drop
instillation at the spatial frequency of 20 c/d. The re-
corded scores were approaching a statistically significant
difference at this time point (p = 0.057, paired samples
t-test).
No change was observed at the other spatial frequencies
examined for any of the eye drops instilled. Concerning
the spatial frequencies in which a change was recorded,
all scores returned to baseline examination levels 40 mi-
utes after the instillation for all of the drugs used. n
Copyright © 2012 SciRes. OJOph