K. OGATA
small sample size. A larger sample size is indispensable for
generalization of the previous findings. The purpose of study I
was to confirm the robustness of the findings relating to the
intellectual profile of maltreated children. In study I, the prior
finding that the PC scores of the maltreated children were
higher than those of non-maltreated children was replicated
using a larger sample size.
Method
The participants included 490 Japanese children (207 girls
and 283 boys). The samples were retrospectively selected from
the records of child guidance centers (CGC) in Osaka prefec-
ture, in a region where the child maltreatment were reported
most frequently, in Japan. The CGC, like Child Protective Ser-
vices, are required to investigate child maltreatment reports, to
protect children (under 18 years old) from further maltreatment,
and to provide rehabilitative services to children, parents, and
other family members involved. The children that participated
were classified into two groups (170 maltreated and 320 com-
parisons) according to the CGC records, in which maltreatment
was determined through review of the records. Mean age (in
months) at maltreatment was 135.5 (SD = 32.0) and that of
comparisons was 146.9 (SD = 30.5). The maltreated group con-
sisted of 76 physically abused, 15 sexually abused, 26 psycho-
logically abused, and 53 neglected children. The comparison
group had been neither abused nor neglected according to the
CGC records. Physical abuse consisted of bruises, burns, cuts,
scratches, or bone fractures. Sexual abuse was defined in this
study as attempted or actual sexual contact or interaction of any
form between the participant and a caregiver or other responsi-
ble adult for purposes of the adult’s sexual gratification. Sexual
contact experiences ranged from fondling, genital touching, and
masturbation of or by another person to attempted or completed
vaginal intercourse. In this study, all psychologically abused
children were eyewitnesses to domestic violence. Following
Kotch, Lewis, Hussey, English, Thompson, Litrownik et al.
(2008), neglect was composed of two subtypes: the first sub-
type, failure to provide, involves the failure of the caregiver or
responsible adult to meet the minimum physical needs of the
child; the second subtype, lack of supervision, occurs when the
caregiver or responsible adult does not take sufficient, devel-
opmentally appropriate action to ensure the child’s safety inside
and outside the home setting. The comparison group consisted
of children needing foster care, who needed to be admitted to
child welfare institutions, with school maladaptation, and with
personality problems alleged by their parents; however, they
had not experienced any child maltreatment according to the
information on the records obtained from their parents and
themselves. All the CGC reports, whether substantiated or not,
were considered reliable indicators of maltreatment in Japan.
The intellectual functioning of children was assessed by 10
core subtests of the Wechsler Intelligence Scale for Children
third edition (WISC-III). A child’s cognitive development was
measured by the WISC-III Japanese version; the author con-
firmed from the case files that a trained child psychologist had
administered the WISC-III to the child in a CGC. The intelli-
gence test was administered after informed consent by their
parents or caregivers, and/or themselves. The scale has been
standardized on a national sample of 1125 children ranging in
age from 5 through 16 years and 11 months. Psychometric traits
of the WISC-III Japanese version were adequate on reliability
and validity (Wechsler, 1991/1998). Reliability coefficients,
based on split-half correlations, range from .64 to .85 for the 10
core subtests, and .95 for the full-scale intelligence quotient
(FIQ); reliability coefficients, based on test-retest correlations,
range from .54 to .89 for the 10 core subtests, and .93 for the
FIQ. Construct validity was also confirmed using factor analy-
sis; the four factor model was adopted, which is the same as the
original Wechsler model.
The data were analyzed as follows. First, t-tests were used
repeatedly to confirm that there were no differences between
the maltreated and comparison groups on the 10 subtests. Next,
multivariate analysis of covariance (MANCOVA) was used to
examine the difference between the maltreated and comparison
groups as controlled for the FIQ. Overall significance on
MANCOVA was followed by Bonferroni-corrected ANCOVA.
Statistical significance was set at p < .05, except for Bon-
ferroni-corrected ANCOVA (p < .005). Statistical analyses
were performed using IBM SPSS 20 Japanese version.
Results and Discussion
All results of subtest profiles are summarized in Table 1.
There was no difference in the FIQ between the groups (Mal-
treated M = 82.3, SD = 14.3; Comparison M = 83.5, SD = 13.8;
t [488] = .94, p = .35). To examine subtest scatters, it was nec-
essary to compare the subtest profiles to control for the overall
level of the FIQ. Thus, the FIQ was used as a covariate.
MANCOVA revealed a significant difference in the WISC-III
subtest results between the two groups (Wilks λ = .92, F [10,
478] = 3.91, p < .001). The obtained results demonstrated that
the intraindividual variability in the subtest profile of the mal-
treated children differed from that of the comparison group;
therefore, further examinations are needed to identify the origin
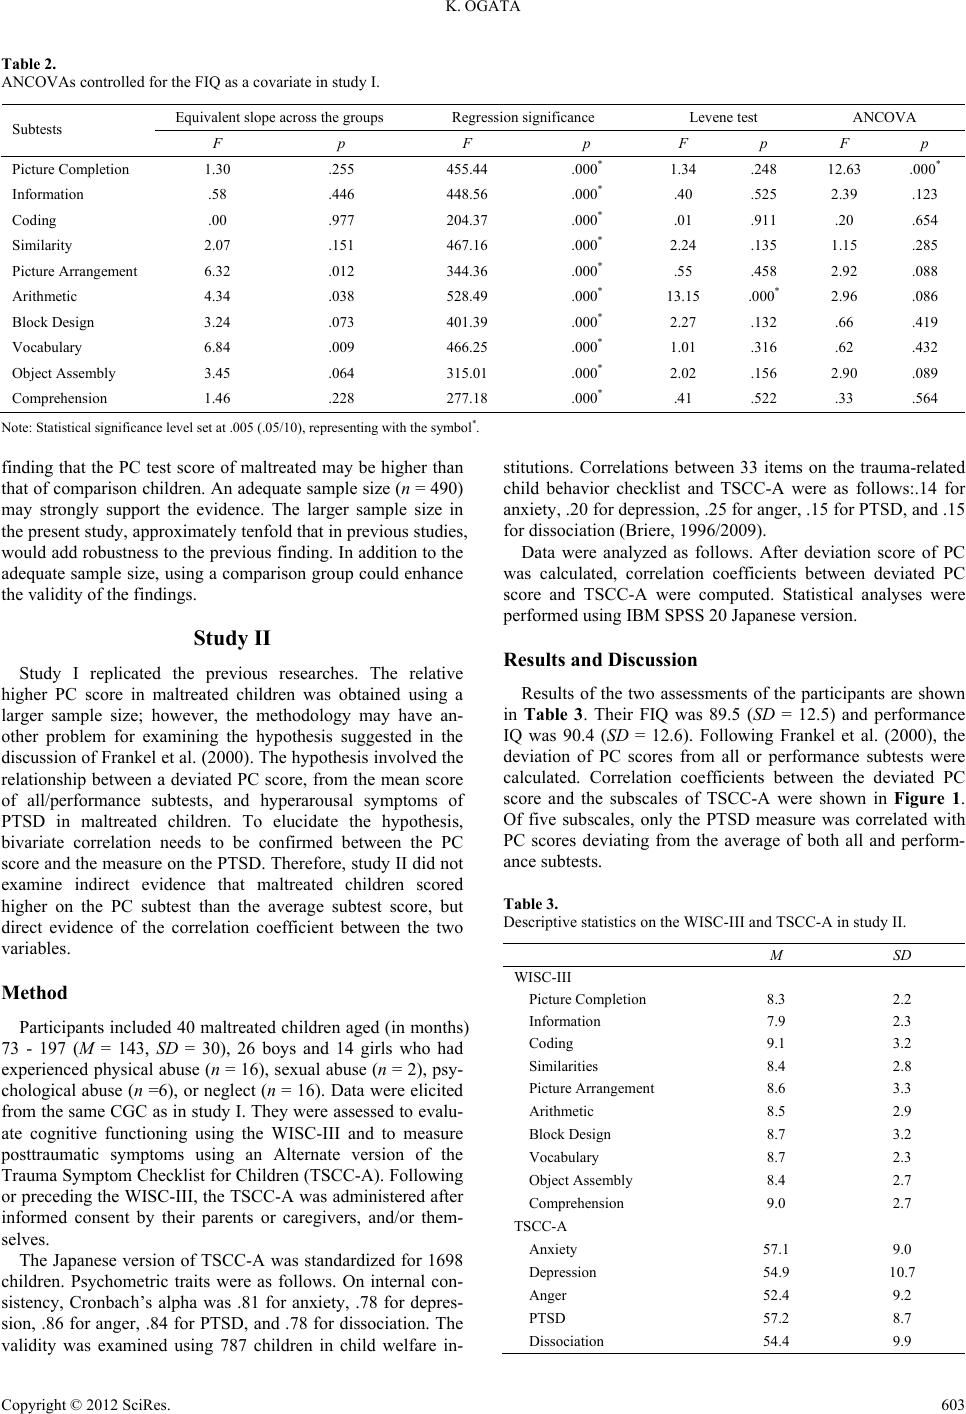
of the significant difference (Table 2).
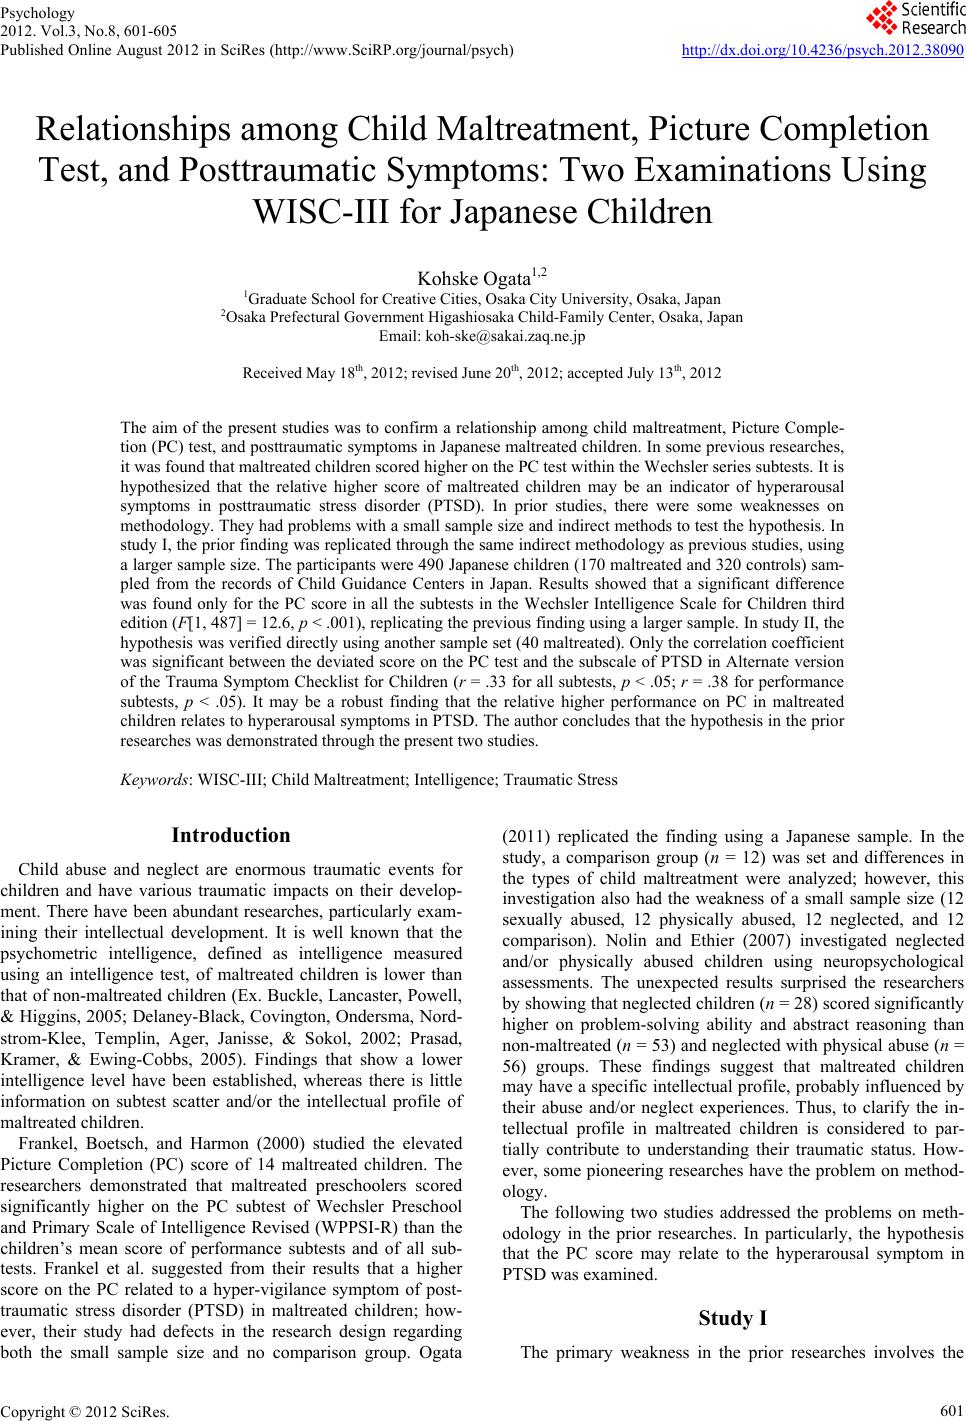
A significant difference by Bonferroni-corrected ANCOVA
(p < .005) was found only for the PC subtest score (F [1, 487] =
12.6, p < .001). The adjusted score, controlled for the FIQ, of
the maltreated (M = 7.9) was significantly higher than that of
the comparison (M = 7.4) children. Differences in the other
subtests failed to reach statistical significance.
The results were consistent with the findings of both Frankel
et al. (2000) and Ogata (2011), showing a robustness of the
Table 1.
Subtest profiles and differences between maltreated and comparison
children in study I.
Maltreated
(n = 170)
Comparison
(n = 320)
Difference
between groups
Subtests M SD M SD t p
Picture completion 7.8 2.4 7.4 2.4 1.91.057
Information 7.0 2.8 7.5 2.8 1.77.077
Coding 7.9 2.9 8.2 2.8 .89 .374
Similarities 7.2 3.0 7.6 2.9 1.42.155
Picture arrangement7.1 3.1 7.6 2.7 1.85a.066
Arithmetic 7.2 2.8 7.7 2.7 1.87.062
Block design 8.0 3.0 8.3 3.4 1.23.218
Vocabulary 7.4 2.6 7.4 2.9 .09 .924
Object assembly 7.4 3.2 7.9 2.7 1.82a.070
Comprehension 8.0 2.7 8.0 2.9 .11 .916
Note: Student’s t-test, df = 488, aWelch’s t-test.
Copyright © 2012 SciRes.
602