Paper Menu >>
Journal Menu >>
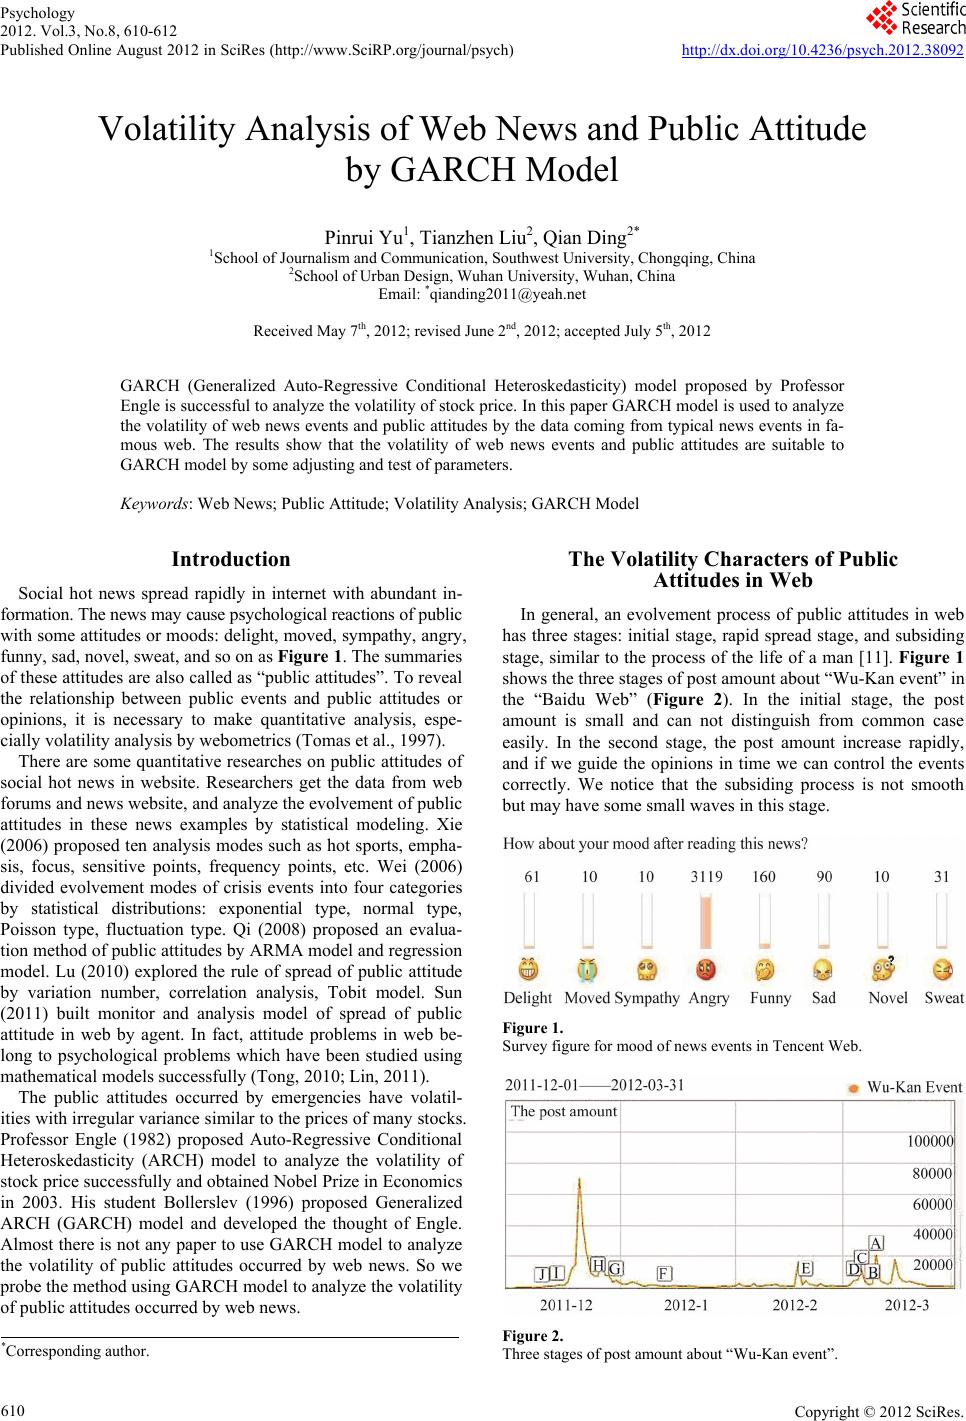 Psychology 2012. Vol.3, No.8, 610-612 Published Online August 2012 in SciRes (http://www.SciRP.org/journal/psych) http://dx.doi.org/10.4236/psych.2012.38092 Copyright © 2012 SciRes. 610 Volatility Analysis of Web News and Public Attitude by GARCH Model Pinrui Yu1, Tianzhen Liu2, Qian Ding2* 1School of Journalism and Communication, Southwest University, Chongqing, China 2School of Urban Design, Wuhan University, Wuhan, China Email: *qianding2011@yeah.net Received May 7th, 2012; revised June 2nd, 2012; accepted July 5th, 2012 GARCH (Generalized Auto-Regressive Conditional Heteroskedasticity) model proposed by Professor Engle is successful to analyze the volatility of stock price. In this paper GARCH model is used to analyze the volatility of web news events and public attitudes by the data coming from typical news events in fa- mous web. The results show that the volatility of web news events and public attitudes are suitable to GARCH model by some adjusting and test of parameters. Keywords: Web News; Public Attitude; Volatility Analysis; GARCH Model Introduction Social hot news spread rapidly in internet with abundant in- formation. The news may cause psychological reactions of public with some attitudes or moods: delight, moved, sympathy, angry, funny, sad, novel, sweat, and so on as Figure 1. The summaries of these attitudes are also called as “public attitudes”. To reveal the relationship between public events and public attitudes or opinions, it is necessary to make quantitative analysis, espe- cially volatility analysis by webometrics (Tomas et al., 1997). There are some quantitative researches on public attitudes of social hot news in website. Researchers get the data from web forums and news website, and analyze the evolvement of public attitudes in these news examples by statistical modeling. Xie (2006) proposed ten analysis modes such as hot sports, empha- sis, focus, sensitive points, frequency points, etc. Wei (2006) divided evolvement modes of crisis events into four categories by statistical distributions: exponential type, normal type, Poisson type, fluctuation type. Qi (2008) proposed an evalua- tion method of public attitudes by ARMA model and regression model. Lu (2010) explored the rule of spread of public attitude by variation number, correlation analysis, Tobit model. Sun (2011) built monitor and analysis model of spread of public attitude in web by agent. In fact, attitude problems in web be- long to psychological problems which have been studied using mathematical models successfully (Tong, 2010; Lin, 2011). The public attitudes occurred by emergencies have volatil- ities with irregular variance similar to the prices of many stocks. Professor Engle (1982) proposed Auto-Regressive Conditional Heteroskedasticity (ARCH) model to analyze the volatility of stock price successfully and obtained Nobel Prize in Economics in 2003. His student Bollerslev (1996) proposed Generalized ARCH (GARCH) model and developed the thought of Engle. Almost there is not any paper to use GARCH model to analyze the volatility of public attitudes occurred by web news. So we probe the method using GARCH model to analyze the volatility of public attitudes occurred by web news. The Volatility Characters of Public Attitudes in Web In general, an evolvement process of public attitudes in web has three stages: initial stage, rapid spread stage, and subsiding stage, similar to the process of the life of a man [11]. Figure 1 shows the three stages of post amount about “Wu-Kan event” in the “Baidu Web” (Figure 2). In the initial stage, the post amount is small and can not distinguish from common case easily. In the second stage, the post amount increase rapidly, and if we guide the opinions in time we can control the events correctly. We notice that the subsiding process is not smooth but may have some small waves in this stage. Figure 1. Survey figure for mood of news events in Tencent Web. Figure 2. *Corresponding author. Three stages of post amount about “Wu-Kan event”. 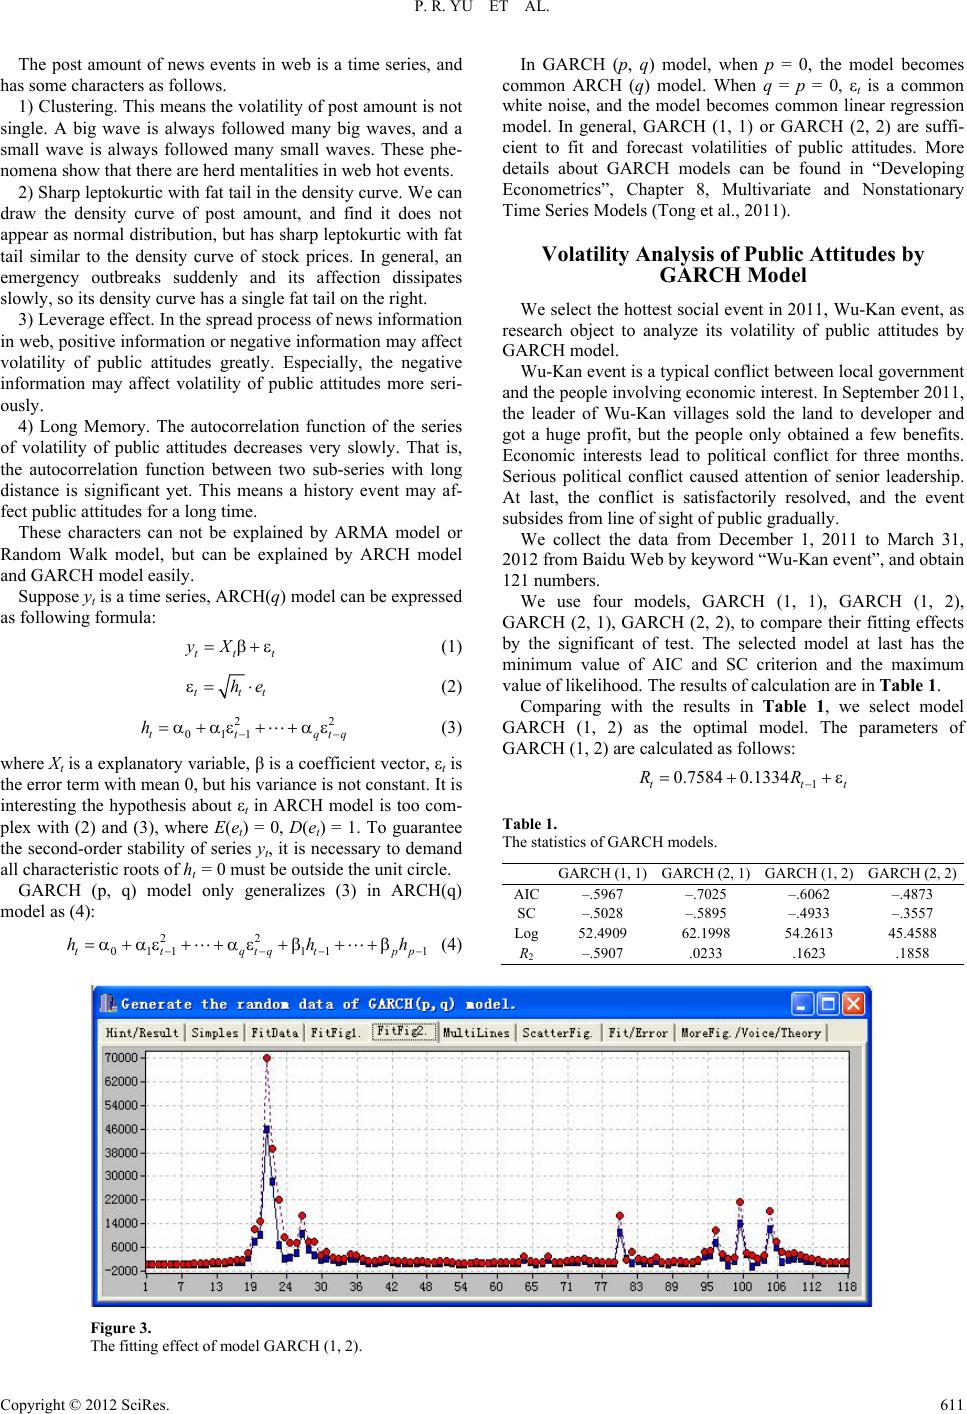 P. R. YU ET AL. The post amount of news events in web is a time series, and has some characters as follows. 1) Clustering. This means the volatility of post amount is not single. A big wave is always followed many big waves, and a small wave is always followed many small waves. These phe- nomena show that there are herd mentalities in web hot events. 2) Sharp leptokurtic with fat tail in the density curve. We can draw the density curve of post amount, and find it does not appear as normal distribution, but has sharp leptokurtic with fat tail similar to the density curve of stock prices. In general, an emergency outbreaks suddenly and its affection dissipates slowly, so its density curve has a single fat tail on the right. 3) Leverage effect. In the spread process of news information in web, positive information or negative information may affect volatility of public attitudes greatly. Especially, the negative information may affect volatility of public attitudes more seri- ously. 4) Long Memory. The autocorrelation function of the series of volatility of public attitudes decreases very slowly. That is, the autocorrelation function between two sub-series with long distance is significant yet. This means a history event may af- fect public attitudes for a long time. These characters can not be explained by ARMA model or Random Walk model, but can be explained by ARCH model and GARCH model easily. Suppose yt is a time series, ARCH(q) model can be expressed as following formula: tt yX t (1) tt he t 2 qtq (2) 2 011tt h (3) where Xt is a explanatory variable, β is a coefficient vector, εt is the error term with mean 0, but his variance is not constant. It is interesting the hypothesis about εt in ARCH model is too com- plex with (2) and (3), where E(et) = 0, D(et) = 1. To guarantee the second-order stability of series yt, it is necessary to demand all characteristic roots of ht = 0 must be outside the unit circle. GARCH (p, q) model only generalizes (3) in ARCH(q) model as (4): 22 011 11ttqtqtp hh In GARCH (p, q) model, when p = 0, the model becomes common ARCH (q) model. When q = p = 0, εt is a common white noise, and the model becomes common linear regression model. In general, GARCH (1, 1) or GARCH (2, 2) are suffi- cient to fit and forecast volatilities of public attitudes. More details about GARCH models can be found in “Developing Econometrics”, Chapter 8, Multivariate and Nonstationary Time Series Models (Tong et al., 2011). Volatility Analysis of Public Attitudes by GARCH Model We select the hottest social event in 2011, Wu-Kan event, as research object to analyze its volatility of public attitudes by GARCH model. Wu-Kan event is a typical conflict between local government and the people involving economic interest. In September 2011, the leader of Wu-Kan villages sold the land to developer and got a huge profit, but the people only obtained a few benefits. Economic interests lead to political conflict for three months. Serious political conflict caused attention of senior leadership. At last, the conflict is satisfactorily resolved, and the event subsides from line of sight of public gradually. We collect the data from December 1, 2011 to March 31, 2012 from Baidu Web by keyword “Wu-Kan event”, and obtain 121 numbers. We use four models, GARCH (1, 1), GARCH (1, 2), GARCH (2, 1), GARCH (2, 2), to compare their fitting effects by the significant of test. The selected model at last has the minimum value of AIC and SC criterion and the maximum value of likelihood. The results of calculation are in Table 1. Comparing with the results in Table 1, we select model GARCH (1, 2) as the optimal model. The parameters of GARCH (1, 2) are calculated as follows: 1p h t (4) 1 0.7584 0.1334 tt RR Table 1. The statistics of GARCH models. GARCH (1, 1)GARCH (2, 1) GARCH (1, 2) GARCH (2, 2) AIC–.5967 –.7025 –.6062 –.4873 SC –.5028 –.5895 –.4933 –.3557 Log52.4909 62.1998 54.2613 45.4588 R2 –.5907 .0233 .1623 .1858 Figure 3. The fitting effect of model GARCH (1, 2). Copyright © 2012 SciRes. 611 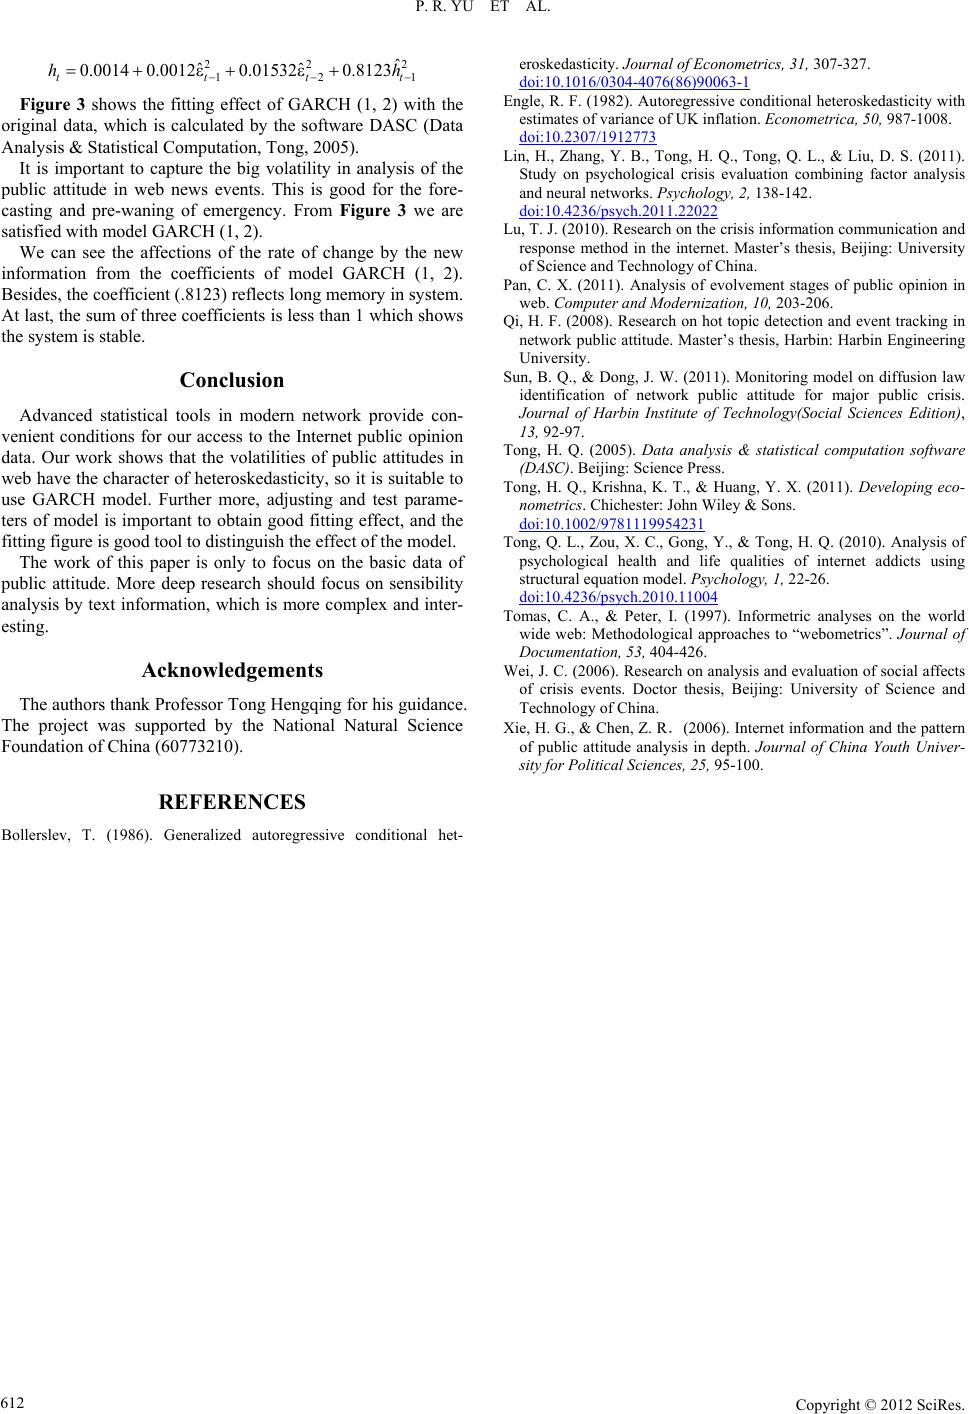 P. R. YU ET AL. 22 12 ˆ ˆˆ 0.0014 0.00120.015320.8123 ttt h 2 1t h Figure 3 shows the fitting effect of GARCH (1, 2) with the original data, which is calculated by the software DASC (Data Analysis & Statistical Computation, Tong, 2005). It is important to capture the big volatility in analysis of the public attitude in web news events. This is good for the fore- casting and pre-waning of emergency. From Figure 3 we are satisfied with model GARCH (1, 2). We can see the affections of the rate of change by the new information from the coefficients of model GARCH (1, 2). Besides, the coefficient (.8123) reflects long memory in system. At last, the sum of three coefficients is less than 1 which shows the system is stable. Conclusion Advanced statistical tools in modern network provide con- venient conditions for our access to the Internet public opinion data. Our work shows that the volatilities of public attitudes in web have the character of heteroskedasticity, so it is suitable to use GARCH model. Further more, adjusting and test parame- ters of model is important to obtain good fitting effect, and the fitting figure is good tool to distinguish the effect of the model. The work of this paper is only to focus on the basic data of public attitude. More deep research should focus on sensibility analysis by text information, which is more complex and inter- esting. Acknowledgements The authors thank Professor Tong Hengqing for his guidance. The project was supported by the National Natural Science Foundation of China (60773210). REFERENCES Bollerslev, T. (1986). Generalized autoregressive conditional het- eroskedasticity. Journal of Econometri c s , 31, 307-327. doi:10.1016/0304-4076(86)90063-1 Engle, R. F. (1982). Autoregressive conditional heteroskedasticity with estimates of variance of UK inflation. Econometrica, 50, 987-1008. doi:10.2307/1912773 Lin, H., Zhang, Y. B., Tong, H. Q., Tong, Q. L., & Liu, D. S. (2011). Study on psychological crisis evaluation combining factor analysis and neural networks. Psychology, 2, 138-142. doi:10.4236/psych.2011.22022 Lu, T. J. (2010). Research on the crisis information communication and response method in the internet. Master’s thesis, Beijing: University of Science and Technology of China. Pan, C. X. (2011). Analysis of evolvement stages of public opinion in web. Computer and Modernization, 10, 203-206. Qi, H. F. (2008). Research on hot topic detection and event tracking in network public attitude. Master’s thesis, Harbin: Harbin Engineering University. Sun, B. Q., & Dong, J. W. (2011). Monitoring model on diffusion law identification of network public attitude for major public crisis. Journal of Harbin Institute of Technology(Social Sciences Edition), 13, 92-97. Tong, H. Q. (2005). Data analysis & statistical computation software (DASC). Beijing: Science Press. Tong, H. Q., Krishna, K. T., & Huang, Y. X. (2011). Developing eco- nometrics. Chichester: John Wiley & Sons. doi:10.1002/9781119954231 Tong, Q. L., Zou, X. C., Gong, Y., & Tong, H. Q. (2010). Analysis of psychological health and life qualities of internet addicts using structural equation model. Psychology, 1, 22-26. doi:10.4236/psych.2010.11004 Tomas, C. A., & Peter, I. (1997). Informetric analyses on the world wide web: Methodological approaches to “webometrics”. Journal of Documentation, 53, 404-426. Wei, J. C. (2006). Research on analysis and evaluation of social affects of crisis events. Doctor thesis, Beijing: University of Science and Technology of China. Xie, H. G., & Chen, Z. R.(2006). Internet information and the pattern of public attitude analysis in depth. Journal of China Youth Univer- sity for Political Sciences, 25, 95-100. Copyright © 2012 SciRes. 612 |