Paper Menu >>
Journal Menu >>
 Journal of Minerals and Materials Characterization and Engineering, 2012, 11, 757-768 Published Online August 2012 (http://www.SciRP.org/journal/jmmce) Optimization of Friction and Wear Behaviour in Hyb rid Metal Matrix Composites Using Taguchi Technique V. C. Uvaraja1*, N. Natarajan2 1Department of Mechanical Engineering, Bannari Amman Institute of Technology, Sathyamangalam, India 2Suguna College of Engineering, Coimbatore, India Email: *c_uva@rediffmail.com Received February 5, 2012; revised March 12, 2012; accepted March 31, 2012 ABSTRACT Al-7075 alloy-base matrix, reinforced with mixtures of silicon carbide (SiC) and boron carbide (B4C) particles, know as hybrid composites have been fabricated by stir casting technique (liquid metallurgy route) and optimized at different parameters like sliding speed, applied load, sliding time, and percentage of reinforcement by Taguchi method. The specimens were examined by Rockwell hardness test machine, Pin on Disc, Scanning Electron Microscope (SEM) and Optical Microscope. A plan of experiment generated through Taguchi’s technique is used to conduct experiments based on L27 orthogonal array. The developed ANOVA and the regression equations were used to find the optimum wear as well as coefficient of friction under the influence of sliding speed, applied load, sliding time and percentage of rein- forcement. The dry sliding wear resistance was analyzed on the basis of “smaller the best”. Finally, confirmation tests were carried out to verify the experimental results. Keywords: Hybrid Metal Matrix Composites; Stir-Cast; Dry Sliding Wear, Orthogonal Array; Taguchi Technique; Analysis of Variance 1. Introduction Two phases namely a matrix phase and a reinforcement phase constitute composite materials. Matrix and rein- forcement phase work together to produce combination of material properties that cannot be met by the conven- tional materials [1]. In this study the composite is pro- duced by using stir casting method, which is one of the economic and commonly used methods in Liquid Metal- lurgy. Most of studies made in automotive and aerospace field shows that the material used for components should posses good toughness with better tribological properties. Hence to meet the automotive application requirements an attempt has been made to develop the Al-7075 based hybrid composite, having combination of both toughness and tribological properties like wear resistance. The greatest improvement in tribological properties of com- posite is generally obtained using particle reinforcement of silicon carbide and boron carbide. Yoshiro Iwai et al. [2] found that the initial sliding distance require to achieve mild wear decreased with increasing volume fraction and also wear rate decrease linearly with volume fraction. Daoud et al. [3] reported that the addition of magnesium alloy to composite during production ensures good bonding between the matrix and the reinforcement. Aluminum alloys possess a number of mechanical and physical properties that make them attractive for automo- tive applications, but they exhibit extremely poor resis- tance to seizure and galling [4]. N. Natarajan et al. [5] recommended SiC particulate reinforcement of metal matrix is more appropriate aspirant material for automo- bile purpose, but a new friction material is to be devel- oped. S. Basavarajappa et al. [6] inspected in detail slid- ing speed, load, sliding distance, percentage of rein- forcement and mutual effect of these factors, which ma- nipulate the dry sliding wear performance of matrix alloy (Al-2219) reinforced with SiC. N. Radhika et al. [7] found taguchi technique as a valuable technique to deal with responses influenced by multi-variables. It is for- mulated for process optimization and detection of opti- mal combination of the parameters for a given response. This method significantly reduces the number of trials that are required to model the response function com- pared with the full factorial design of experiments. The most important benefit of this technique is to find out the possible interaction between the factors. In view of the above article, an assessment is made to investigate the outcome of sliding speed, load, sliding time and volume fraction of reinforcement on the dry sliding wear behav- ior of the particulate reinforced Al-7075 alloy with a constant weight percentage (3%) of B4C particulate and *Corresponding author. Copyright © 2012 SciRes. JMMCE  V. C. UVARAJA, N. NATARAJAN 758 varying range (5%, 10%, 15%) of SiC particulate com- posites using taguchi method. The Analysis of variance was used to find the percentage contribution (Pr) of various process parameters and their correlations on dry sliding wear of the hybrid composite materials. 2. Material Selection In the present investigation, Dry sliding wear tests were performed on SiC and B4C particulates reinforced Al- 7075 alloy matrix composite. The Al-Mg-Si base alloys were purchased from Metal Mart Pvt. Ltd., Coimbatore (Tamil Nadu) India. Table 1 shows the nominal compo- sition weight percentage of matrix materials. The hard- ness measurements were made by applying a load of 100 kg and the average is calculated from 10 different values of the experiments. The density measurements were all set according to the ASTM standard C1270-88. The value of hardness and density for matrix material were 67.17 HRC and 2.81 g/m3 respectively in tempered condition. The particulate morphology study results such as shape of both reinforcements were angu- lar-irregular and size of SiC (30 μm - 70 μm) and B4C (5 μm - 20 μm). 2.1. Manufacturing of the Hybrid Composites Material Stir casting technique is one of the popular Liquid Met- allurgy Route (LMR) and also known as a very promis- ing route for manufacturing near net shape hybrid metal matrix composite components at a normal cost [8]. In this present work, stir casting technique was used to fab- ricate Al-7075 alloy with varying weight percentages of SiC (5%, 10%, and 15%) and a constant weight percent- age of B4C (3%) reinforcements. In order to achieve good binding between the matrix and particulates, one weight percent of magnesium alloy is added. The ex- perimental set up was shown in Plate 1. The stir casting furnace is mounted on the floor and the temperature of the furnace is precisely measured and controlled in order to achieve sound quality composite. Two thermocouples and one PID controller were used for this purpose. As mild steel materials are having high temperature stability, they are selected as stirrer rod and impeller. This stirrer was connected to 1HP DC Motor through flexible link and was used to stir the molten metal in semi solid state. The screw operator lift is used to bring the stirrer in contact with the composite material. The melt was maintained at a temperature between 800˚C to 875˚C for one hour. Vortex was created by using a me- chanical stirrer. Weighed quantity of SiC (5, 10 and 15 wt%) along with 3 weight percentage of B4C particulate, preheated to 600˚C were added to the melt with constant stirring for about 10 min at 500 to 650 rpm. After com- plete addition of the particles to the melt, the composite alloy was tilt poured into the preheated (300˚C) perma- nent steel mould and allowed to cool in atmospheric air. The billet was then removed from the mould and ma- chined for required dimensions. The uniform distribution of particulates reinforced in the matrix was examined with the help of Optical-Microscope. The optical micro- graphs of unreinforced alloy and the composite with 5, 10, 15 wt% of reinforcement are shown in Plates 2-5 respectively. Table 1. Chemical composition of the matrix alloy. Si Fe Cu Mn Mg Cr Ni Zn Ti Ag >0.130 >0.203 1.62 0.0742.42 0.1830.03 >3.6 0.0490.024 B Be Bi Ca Cd Co Li Na P Pb 0.0025 0.001 0.0013 0.00050.00030.0003<0.0010<0.00020.0005<0.0010 Sn Sr V Zr Al 0.004 <0.0001 0.0066 0.0056 90.52 Plate 1. Stir casting setup. Copyright © 2012 SciRes. JMMCE  V. C. UVARAJA, N. NATARAJAN 759 Plate 2. Optical Microscopic image of unreinforced Al (7075) alloy at 100× magnification. Plate 3. Optical Microscope image of 5% SiC + 3% B4C particulate reinforced Al (7075) composite at 100× magni- fication. Plate 4. Optical Microscope image of 10% SiC + 3% B4C particulate reinforced Al (7075) composite at 100× magni- fication. Plate 5. Optical Microscope image of 15% SiC + 3% B4C particulate reinforced Al (7075) composite at 100× magni- fication. 051015 60 80 100 2.2. Microstructure and Hardness The resistance indentation or scratch is termed as hard- ness. Hardness test was carried out at room temperature using Rockwell hardness tester with at least six indenta- tions of each sample and then the average values were utilized to calculate hardness number. The hardness of MMC increases with the volume fraction of particulate in the alloy matrix. The added amount of SiC and B4C par- ticles enhances hardness, as these particles are harder than Al alloy rendering their inherent property of hard- ness to soft matrix as shown in Figure 1. Composites with higher hardness could be achieved by this technique which may be due to the fact that silicon carbide and boron carbide particles act as obstacles to the motion of dislocation. Hardness (HRC) Percentage of reinforcement The hardness graph shows that the sample with less than 5 wt% of SiC and 3 wt% B4C particulate behaves almost the same as unreinforced. But the sample with 15 wt% SiC and 3 wt% B4C showed slightly high hardness and low toughness as compare to 10 wt% SiC and 3 wt% B4C. Higher the percentage of particulates in the matrix, lesser is the toughness. Therefore, from this study it is evidently indicated that 10 wt% SiC and 3 wt% boron Figure 1. Hardness of unreinforced alloy and composites at different volume fraction. carbide composite sample have high hardness and good toughness. Hence this may be considered as the optimum weight percentage of the particulate to achieve better hybrid composite properties for heavy vehicle applica- tions. Copyright © 2012 SciRes. JMMCE  V. C. UVARAJA, N. NATARAJAN 760 2.3. Mechanism of Wear Test The composite specimens were rubbed against hardened steel. Dry sliding wear tests were carried out using pin- on-disc type wear tester at different parameters like slid- ing speed, applying load, Sliding time and percentage of reinforcement were varied in the range given in Table 2. Plate 6 shows the complete pin-on-disc wear test ex- perimental setup. The slider disc is made up of 0.95% to 1.20% carbon (EN31) hardened steel disc with hardness of 62 HRC having diameter 165 mm. The pin test sample dimensions were 12 mm diameter and 32 mm height. Care should be taken to note that the test sample’s end surfaces were flat and polished metallographically prior to testing. Conventional aluminium alloy polishing tech- niques were used to get ready the contact surfaces of the monolithic composite aluminium specimen for wear test. The procedure involves grinding of composite alumin- ium surfaces manually by 240, 320, 400 and 600 grit silicon carbide papers and then polishing them with 5, 1 & 0.5 µm alumina using low speed polishing machine. This preparation technique created considerable surface relief between hard and soft aluminium matrix. The pol- ished surfaces were cleaned ultrasonically with acetone and methanol solutions. The counter face materials were also polished and cleaned ultrasonically in acetone and methanol solutions before each wear test. The steel slider was polished using the above described procedure and all the tests were conducted at room temperature. The wear rates measured in weight units were obtained by weighing the specimen before and after the experiment and then converted to volumetric wear rates. The micro structural investigation and semi quantitative chemical analysis on the worn sur- faces were performed by SEM. Table 2. Process parameters and levels. Level Speed (m/s) Load (N) Time (min) Percentage of Reinforcement % 1 1.5 10 5 5 2 3 20 10 10 3 4.5 40 15 15 Plate 6. A pin-on-disc wear testing machine. 3. Design of Experiment An experiment is designed in such a way to evaluate si- multaneously two or more factors which possess their ability to affect the resultant average or variability of particular product or process characteristics. To accom- plish this in an effective and statistically proper fashion, levels of the factors are varied in a strategic manner. The results of the particular test combinations are observed and the complete set of results are analyzed to determine the preferred level of the various influencing factors whether increases or decreases of those levels will poten- tially lead to further improvement [9]. The design of ex- periment process is divided into three main phases or planning phases namely, the conducting phase and the analysis phase, which encompass all experimentation approaches. Investigation of the experimental outcomes uses signal to noise ratio to support the determination of the finest process design. This method is effectively used to study of dry sliding wear behavior of composites materials [10]. In this work, the “smaller the best” quality characteristics were taken to finding the minimum wear rate and coeffi- cient of friction. 4. Plan of Experiment The experiments were conduct as per the standard or- thogonal array. The selection of the orthogonal array is based on the condition that the degrees of freedom for the orthogonal array should be greater than or at least equals sum of those of wear parameters. In the present investigation an L27 (313) orthogonal array was chosen as shown in Figure 2, which has 27 rows corresponding to the number of tests (20 degrees of freedom) and 13 col- umns at three levels and four factors, as shown in Table 3. 1 5 2 (3, 4) (8, 11) (6, 7) 13 12 109 Figure 2. Linear graphs for L27 array. Copyright © 2012 SciRes. JMMCE  V. C. UVARAJA, N. NATARAJAN Copyright © 2012 SciRes. JMMCE 761 best, which is calculated as logarithmic transformation of loss function as shown below, The wear parameters chosen for the experiment are 1) sliding speed; 2) applied load; 3) sliding time; and 4) percentage of reinforcement of SiC and B4C materials. The experiment consists of 27 tests (each row in the L27 orthogonal array) and the columns were assigned with parameters. The first column was assigned to sliding speed (S), second column was assigned to applied load (L), fifth column was assigned to sliding time (T) and ninth column was assigned to percentage of reinforce- ment (R) and the remaining columns were assigned to their interactions. The experiments were conducted as per the orthogonal array with level of parameters given in each array row. The output to be studied is wear rate and coefficients of friction of the test samples are repeated three times corresponding to 81 tests. The experimental observations are further transformed into Signal to noise ratio. The response to be studied was the wear rate and coefficient of friction with the objective as smaller the 2 1 10 logi SY Nn (1) where “n” is the numbers of observations, “Yi” is the measured value of wear rate and coefficient of friction. It is suggested that quality characteistics are optimised when the SN response is as smaller as possible. 5. Results and Dissussion Experimental values of wear rate and coefficient of fric- tion and the calculated values of signal to noise ratio for a given response using Equation (1), and are listed in Table 4. The Taguchi’s technique suggested that the ana- lyzing of signal to noise ratio using conceptual approach that involves graphing the special effects and visually making out the significant aspects. Table 3. Orthogonal array L27 (313) of taguchi method. L27 (313) 1 2 3 4 5 6 7 8 9 10 11 12 13 1 1 1 1 1 1 1 1 1 1 1 1 1 1 2 1 1 1 1 2 2 2 2 2 2 2 2 2 3 1 1 1 1 3 3 3 3 3 3 3 3 3 4 1 2 2 2 1 1 1 2 2 2 3 3 3 5 1 2 2 2 2 2 2 3 3 3 1 1 1 6 1 2 2 2 3 3 3 1 1 1 2 2 2 7 1 3 3 3 1 1 1 3 3 3 2 2 2 8 1 3 3 3 2 2 2 1 1 1 3 3 3 9 1 3 3 3 3 3 3 2 2 2 1 1 1 10 2 1 2 3 1 2 3 1 2 3 1 2 3 11 2 1 2 3 2 3 1 2 3 1 2 3 1 12 2 1 2 3 3 1 2 3 1 2 3 1 2 13 2 2 3 1 1 2 3 2 3 1 3 1 2 14 2 2 3 1 2 3 1 3 1 2 1 2 3 15 2 2 3 1 3 1 2 1 2 3 2 3 1 16 2 3 1 2 1 2 3 3 1 2 2 3 1 17 2 3 1 2 2 3 1 1 2 3 3 1 2 18 2 3 1 2 3 1 2 2 3 1 1 2 3 19 3 1 3 2 1 3 2 1 3 2 1 3 2 20 3 1 3 2 2 1 3 2 1 3 2 1 3 21 3 1 3 2 3 2 1 3 2 1 3 2 1 22 3 2 1 3 1 3 2 2 1 3 3 2 1 23 3 2 1 3 2 1 3 3 2 1 1 3 2 24 3 2 1 3 3 2 1 1 3 2 2 1 3 25 3 3 2 1 1 3 2 3 2 1 2 1 3 26 3 3 2 1 2 1 3 1 3 2 3 2 1 27 3 3 2 1 3 2 1 2 1 3 1 3 2 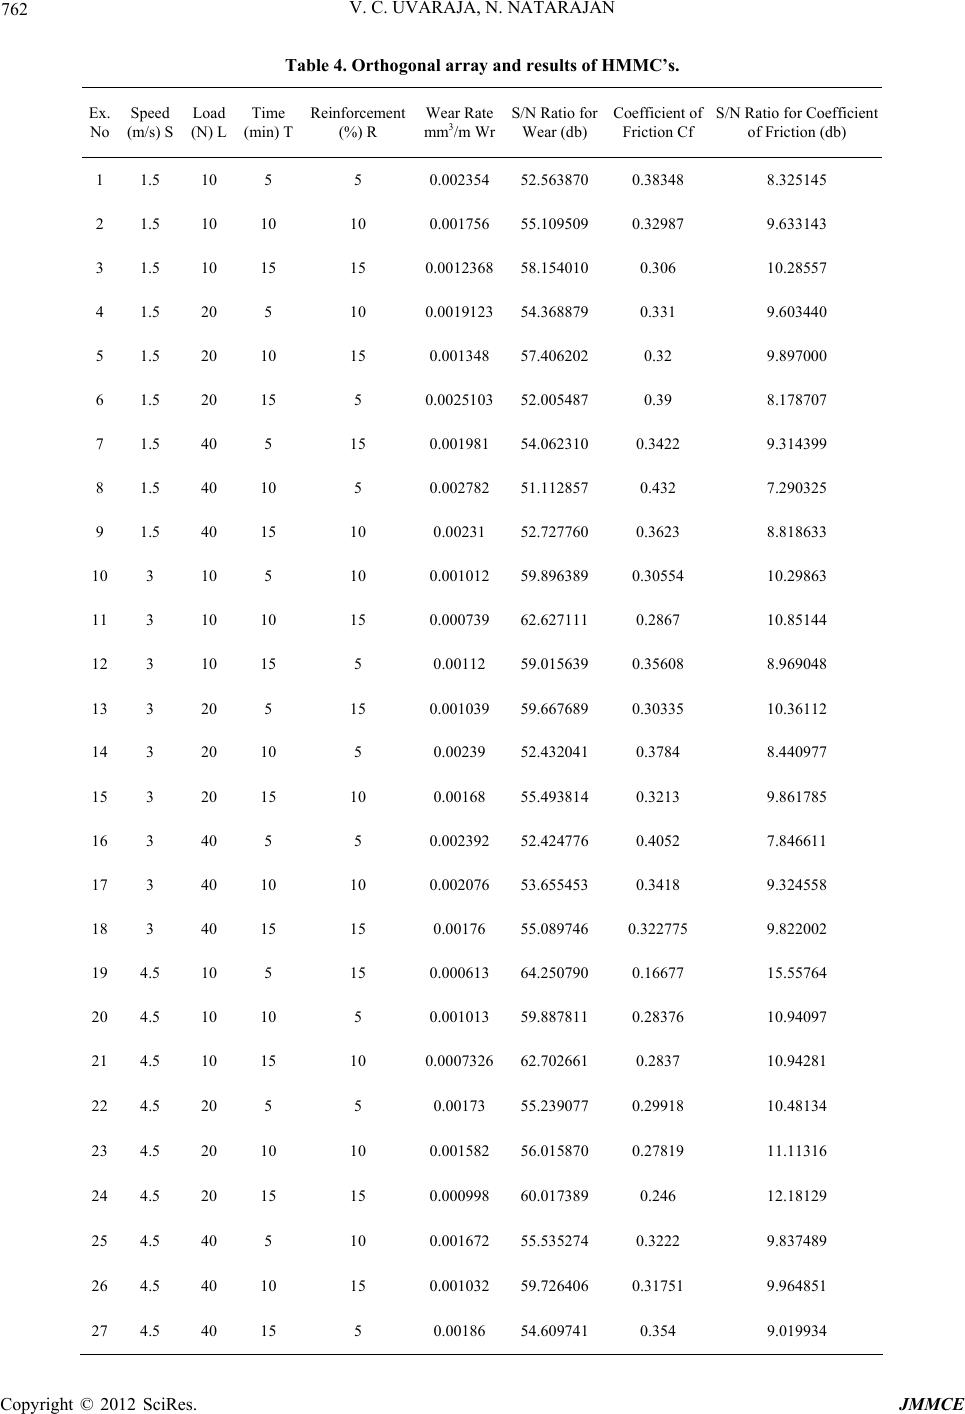 V. C. UVARAJA, N. NATARAJAN 762 Table 4. Orthogonal array and results of HMMC’s. Ex. No Speed (m/s) S Load (N) L Time (min) T Reinforcement (%) R Wear Rate mm3/m Wr S/N Ratio for Wear (db) Coefficient of Friction Cf S/N Ratio for Coefficient of Friction (db) 1 1.5 10 5 5 0.00235452.563870 0.38348 8.325145 2 1.5 10 10 10 0.00175655.109509 0.32987 9.633143 3 1.5 10 15 15 0.001236858.154010 0.306 10.28557 4 1.5 20 5 10 0.001912354.368879 0.331 9.603440 5 1.5 20 10 15 0.00134857.406202 0.32 9.897000 6 1.5 20 15 5 0.002510352.005487 0.39 8.178707 7 1.5 40 5 15 0.00198154.062310 0.3422 9.314399 8 1.5 40 10 5 0.00278251.112857 0.432 7.290325 9 1.5 40 15 10 0.00231 52.727760 0.3623 8.818633 10 3 10 5 10 0.00101259.896389 0.30554 10.29863 11 3 10 10 15 0.00073962.627111 0.2867 10.85144 12 3 10 15 5 0.00112 59.015639 0.35608 8.969048 13 3 20 5 15 0.00103959.667689 0.30335 10.36112 14 3 20 10 5 0.00239 52.432041 0.3784 8.440977 15 3 20 15 10 0.00168 55.493814 0.3213 9.861785 16 3 40 5 5 0.00239252.424776 0.4052 7.846611 17 3 40 10 10 0.00207653.655453 0.3418 9.324558 18 3 40 15 15 0.00176 55.089746 0.322775 9.822002 19 4.5 10 5 15 0.00061364.250790 0.16677 15.55764 20 4.5 10 10 5 0.00101359.887811 0.28376 10.94097 21 4.5 10 15 10 0.000732662.702661 0.2837 10.94281 22 4.5 20 5 5 0.00173 55.239077 0.29918 10.48134 23 4.5 20 10 10 0.00158256.015870 0.27819 11.11316 24 4.5 20 15 15 0.00099860.017389 0.246 12.18129 25 4.5 40 5 10 0.00167255.535274 0.3222 9.837489 26 4.5 40 10 15 0.00103259.726406 0.31751 9.964851 27 4.5 40 15 5 0.00186 54.609741 0.354 9.019934 Copyright © 2012 SciRes. JMMCE 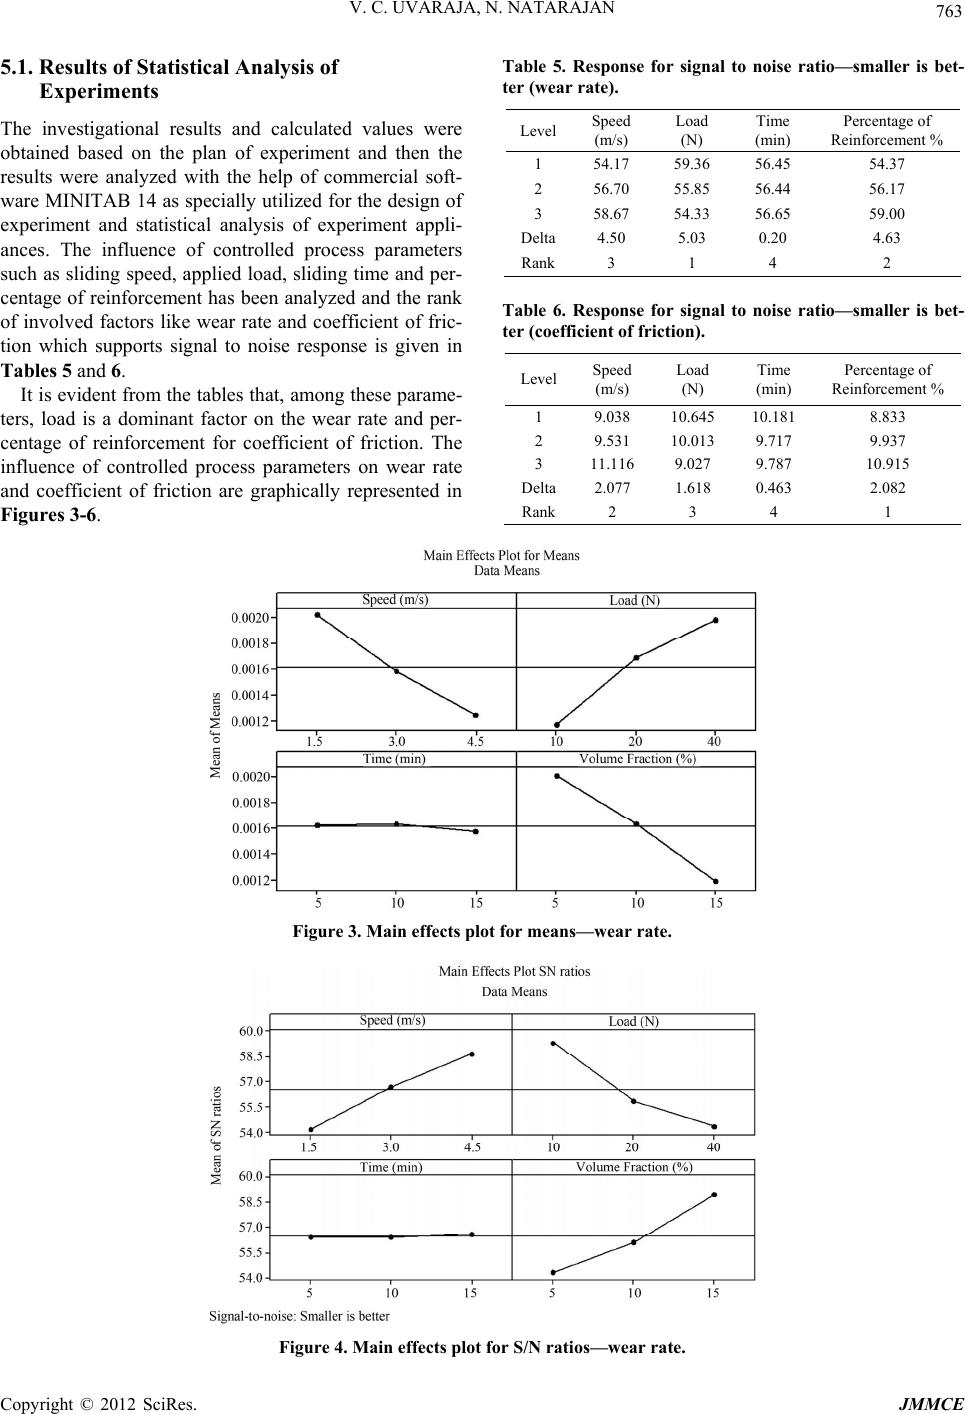 V. C. UVARAJA, N. NATARAJAN Copyright JMMCE 763 5.1. Results of Statistical Analysis of Experiments Table 5. Response for signal to noise ratio—smaller is bet- ter (wear rate). Level Speed (m/s) Load (N) Time (min) Percentage of Reinforcement % 1 54.17 59.36 56.45 54.37 2 56.70 55.85 56.44 56.17 3 58.67 54.33 56.65 59.00 Delta4.50 5.03 0.20 4.63 Rank 3 1 4 2 The investigational results and calculated values were obtained based on the plan of experiment and then the results were analyzed with the help of commercial soft- ware MINITAB 14 as specially utilized for the design of experiment and statistical analysis of experiment appli- ances. The influence of controlled process parameters such as sliding speed, applied load, sliding time and per- centage of reinforcement has been analyzed and the rank of involved factors like wear rate and coefficient of fric- tion which supports signal to noise response is given in Tables 5 and 6. Table 6. Response for signal to noise ratio—smaller is bet- ter (coefficient of friction). Level Speed (m/s) Load (N) Time (min) Percentage of Reinforcement % 1 9.038 10.645 10.181 8.833 2 9.531 10.013 9.717 9.937 3 11.116 9.027 9.787 10.915 Delta 2.077 1.618 0.463 2.082 Rank 2 3 4 1 It is evident from the tables that, among these parame- ters, load is a dominant factor on the wear rate and per- centage of reinforcement for coefficient of friction. The influence of controlled process parameters on wear rate and coefficient of friction are graphically represented in Figures 3-6. Figure 3. Main effects plot for means—wear rate. Figure 4. Main effects plot for S/N ratios—wear rate. © 2012 SciRes. 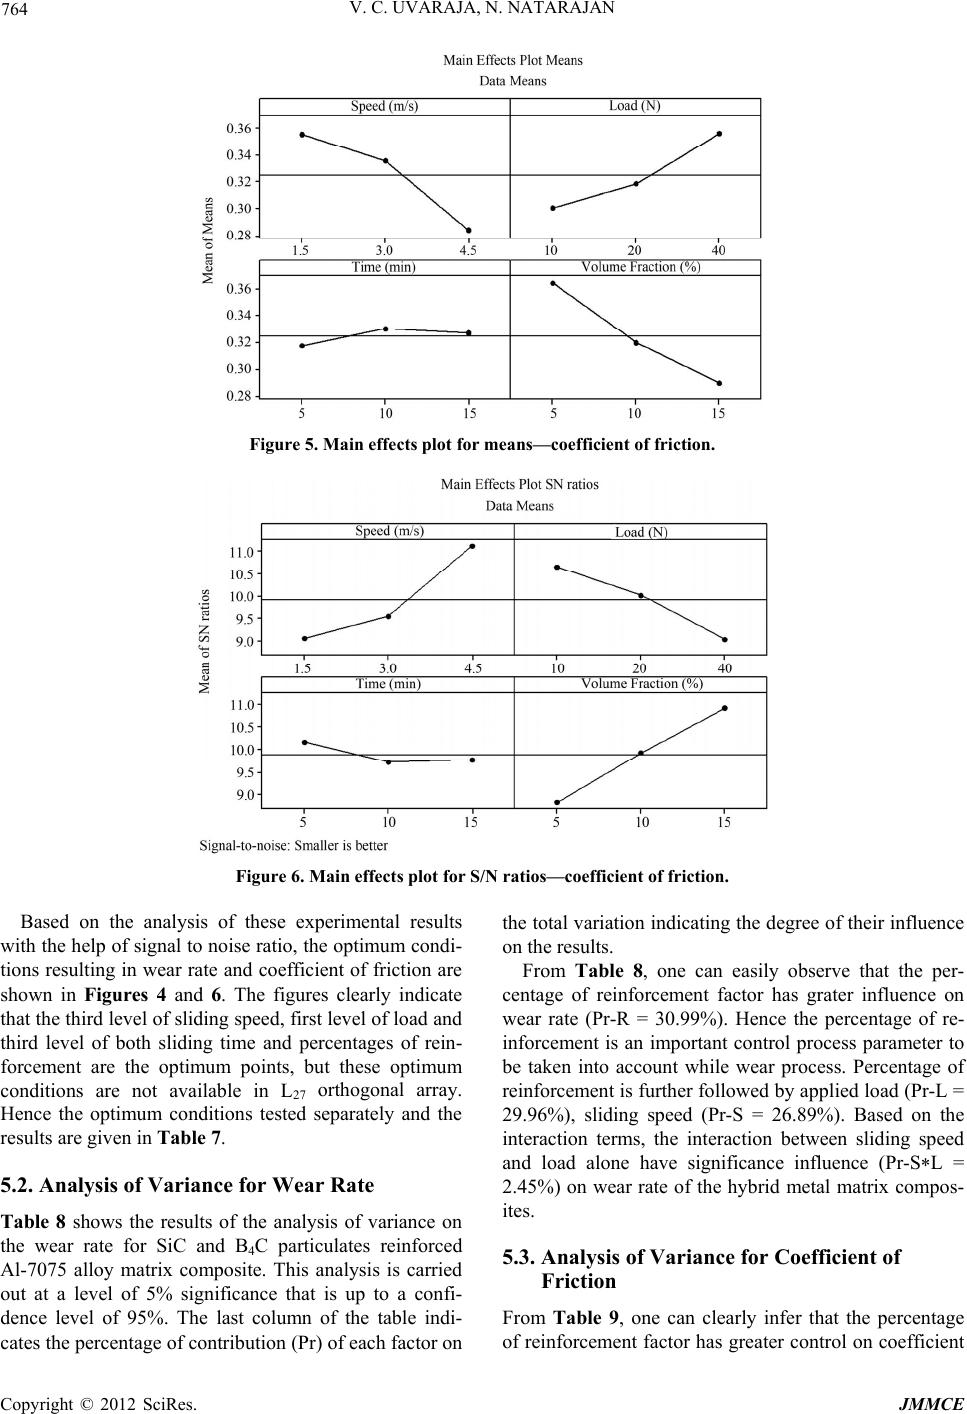 V. C. UVARAJA, N. NATARAJAN 764 Figure 5. Main effects plot for means—coefficient of friction. Figure 6. Main effects plot for S/N ratios—coefficient of friction. Based on the analysis of these experimental results with the help of signal to noise ratio, the optimum condi- tions resulting in wear rate and coefficient of friction are shown in Figures 4 and 6. The figures clearly indicate that the third level of sliding speed, first level of load and third level of both sliding time and percentages of rein- forcement are the optimum points, but these optimum conditions are not available in L27 orthogonal array. Hence the optimum conditions tested separately and the results are given in Table 7. 5.2. Analysis of Variance for Wear Rate Table 8 shows the results of the analysis of variance on the wear rate for SiC and B4C particulates reinforced Al-7075 alloy matrix composite. This analysis is carried out at a level of 5% significance that is up to a confi- dence level of 95%. The last column of the table indi- cates the percentage of contribution (Pr) of each factor on the total variation indicating the degree of their influence on the results. From Table 8, one can easily observe that the per- centage of reinforcement factor has grater influence on wear rate (Pr-R = 30.99%). Hence the percentage of re- inforcement is an important control process parameter to be taken into account while wear process. Percentage of reinforcement is further followed by applied load (Pr-L = 29.96%), sliding speed (Pr-S = 26.89%). Based on the interaction terms, the interaction between sliding speed and load alone have significance influence (Pr-S*L = 2.45%) on wear rate of the hybrid metal matrix compos- ites. 5.3. Analysis of Variance for Coefficient of Friction From Table 9, one can clearly infer that the percentage of reinforcement factor has greater control on coefficient Copyright © 2012 SciRes. JMMCE 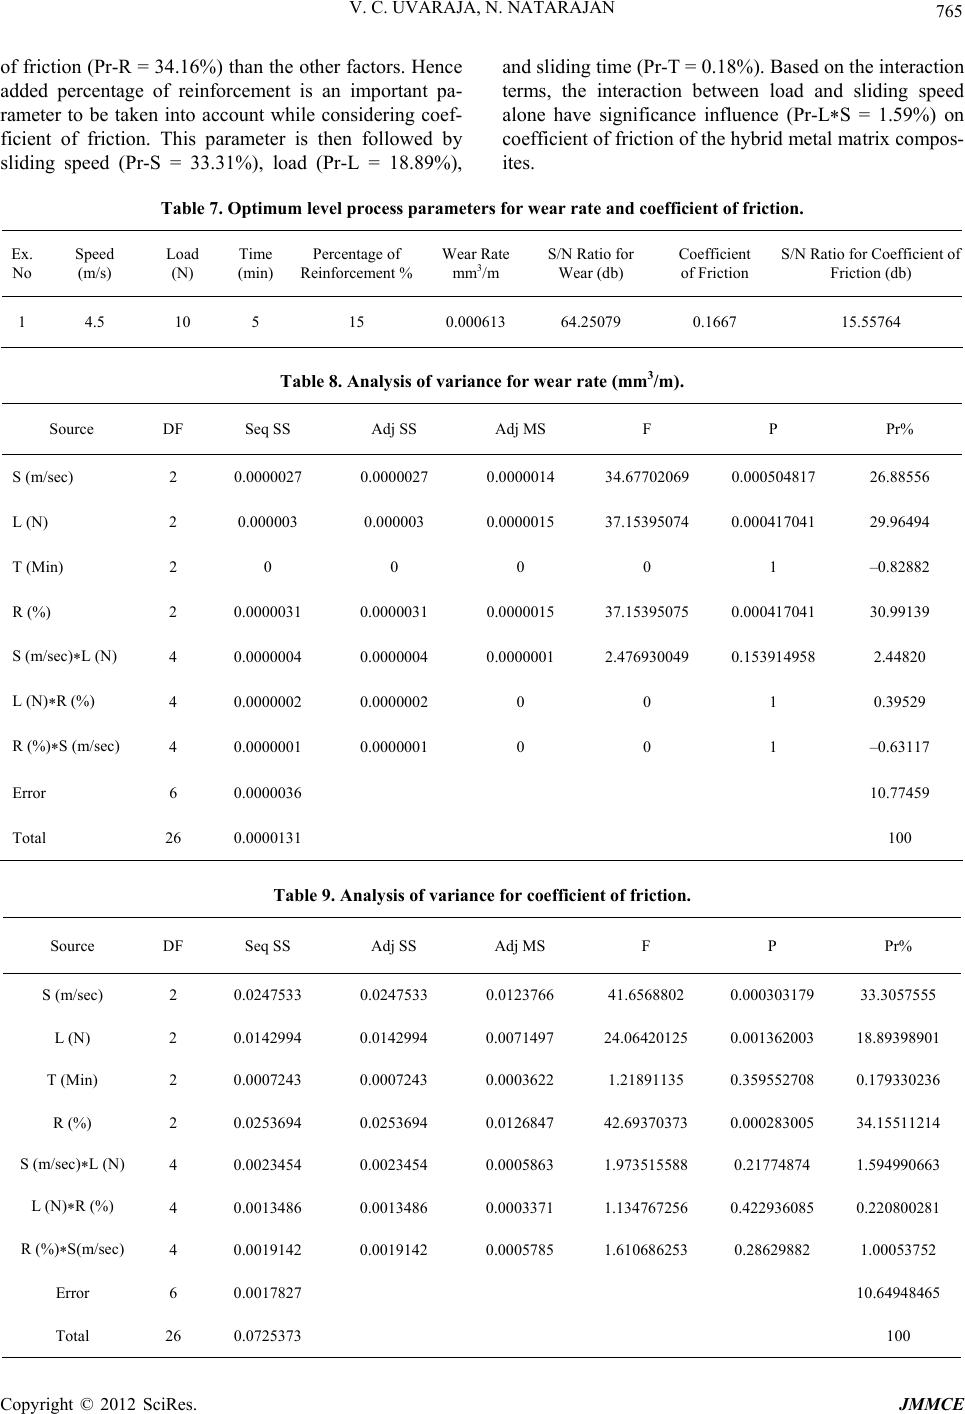 V. C. UVARAJA, N. NATARAJAN 765 of friction (Pr-R = 34.16%) than the other factors. Hence added percentage of reinforcement is an important pa- rameter to be taken into account while considering coef- ficient of friction. This parameter is then followed by sliding speed (Pr-S = 33.31%), load (Pr-L = 18.89%), and sliding time (Pr-T = 0.18%). Based on the interaction terms, the interaction between load and sliding speed alone have significance influence (Pr-L*S = 1.59%) on coefficient of friction of the hybrid metal matrix compos- ites. Table 7. Optimum level process parameters for wear rate and coefficient of friction. Ex. No Speed (m/s) Load (N) Time (min) Percentage of Reinforcement % Wear Rate mm3/m S/N Ratio for Wear (db) Coefficient of Friction S/N Ratio for Coefficient of Friction (db) 1 4.5 10 5 15 0.000613 64.25079 0.1667 15.55764 Table 8. Analysis of variance for wear rate (mm3/m). Source DF Seq SS Adj SS Adj MS F P Pr% S (m/sec) 2 0.0000027 0.0000027 0.0000014 34.67702069 0.000504817 26.88556 L (N) 2 0.000003 0.000003 0.0000015 37.15395074 0.000417041 29.96494 T (Min) 2 0 0 0 0 1 –0.82882 R (%) 2 0.0000031 0.0000031 0.0000015 37.15395075 0.000417041 30.99139 S (m/sec)*L (N) 4 0.0000004 0.0000004 0.0000001 2.476930049 0.153914958 2.44820 L (N)*R (%) 4 0.0000002 0.0000002 0 0 1 0.39529 R (%)*S (m/sec) 4 0.0000001 0.0000001 0 0 1 –0.63117 Error 6 0.0000036 10.77459 Total 26 0.0000131 100 Table 9. Analysis of variance for coefficient of friction. Source DF Seq SS Adj SS Adj MS F P Pr% S (m/sec) 2 0.0247533 0.0247533 0.0123766 41.6568802 0.000303179 33.3057555 L (N) 2 0.0142994 0.0142994 0.0071497 24.06420125 0.001362003 18.89398901 T (Min) 2 0.0007243 0.0007243 0.0003622 1.21891135 0.359552708 0.179330236 R (%) 2 0.0253694 0.0253694 0.0126847 42.69370373 0.000283005 34.15511214 S (m/sec)*L (N) 4 0.0023454 0.0023454 0.0005863 1.973515588 0.21774874 1.594990663 L (N)*R (%) 4 0.0013486 0.0013486 0.0003371 1.134767256 0.422936085 0.220800281 R (%)*S(m/sec) 4 0.0019142 0.0019142 0.0005785 1.610686253 0.28629882 1.00053752 Error 6 0.0017827 10.64948465 Total 26 0.0725373 100 Copyright © 2012 SciRes. JMMCE  V. C. UVARAJA, N. NATARAJAN 766 5.4. Multiple Linear Regression Models Statistical software MINITAB R14 is used for develop- ing a multiple linear regression equation. This developed model gives the relationship between independent/pre- dictor variable and a response variable by fitting a linear equation to the measured data. The regression equation developed for wear rate is, Wr = 0.00268 – 0.000258 S (m/s) + 0.000025 L (N) – 0.000006 T (min) – 0.000082 R (%) (2) R-Sq = 86.5% The regression equation developed for coefficient of friction is, Cf = 0.419 – 0.0239 S (m/s) + 0.00185 L (N) + 0.000925 T (min) – 0.00745 R (%) (3) R-Sq = 86.6% 5.5. Scanning Electron Microscope Examination Wear rate depends on the presence of carbide phase in matrix. Plates 7-9 show the SEM worn surface micro- graphs of reinforced samples. The pure Al-7075 has a smooth surface nature and more tribolayers are formed hence the wear rate is more in the unreinforced sample. The examination of hybrid composite sample worn sur- faces as shown in Plates 7-9 showed that rough surface nature and less tribolayers due to silicon carbides and boron carbide embedded in matrix as compared to the unreinforced alloy. 6. Confirmation Experiment Confirmation test is the last step in the plan process. Table 10 indicates the values used for conducting the dry sliding wear test and Table 11 shows the results of confirmation experiment and their comparison with regression model which helps to identify the optical parameter values from the experimental analysis. The mathematical model was developed with the help of regression Equations (2) and Plate 7. SEM texture of 5% SiC + 3% B4C particulate rein- forced Al (7075) composite after wear. Plate 8. SEM texture of 10% SiC + 3% B4C particulate reinforced Al (7075) composite after wear. Plate 9. SEM texture of 15% SiC + 3% B4C particulate reinforced Al (7075) composite after wear. Table 10. Confirmation experiment for wear rate and coef- ficient of friction. Level Speed (m/s) Load (N) Time (min) Percentage of Reinforcement % 1 1.8 15 6 5 2 3.3 25 9 10 3 4.2 35 12 15 (3) and also the comparison result values obtained ex- perimentally were analyzed. From the analysis, the actual wear rate and coefficient of friction are found to be varying from the calculated one using regression equa- tion and the error percentage ranges between 6.90% to 11.76% for wear rate and 4.66% to 9.23% for coefficient of friction. As these values are closely resembling the actual data with minimum error, design of experiments by Taguchi method was successful for calculating wear rate and coefficient of friction from the regression equa- tion. Figure 7 shows a comparison between wear rate and coefficient of the obtained contribution percentage (Pr%) of each factor with the source of variance. Copyright © 2012 SciRes. JMMCE  V. C. UVARAJA, N. NATARAJAN 767 Table 11. Result of confirmation experiment an their comparison with regression model. Exp. Exp. wear rate Reg. model Equation (1), % Error Exp. coefficient Reg. model Equation (2), % Error d No (mm3/m) Wear Rate (mm3/m) of friction coefficient of friction 1 0 9.37 9.23 .0023455490.0021446 0.4064 0.37203 2 0.001688592 0.0015796 6.90 0.3473 0.32021 8.47 3 0.001306921 0.0011694 11.76 0.2959 0.28272 4.66 SpeedLoadTime % 0 10 20 30 Reinfo rcement 40 Percentage of contribution Wear rate Fr ic tio n C o-e ffic ie nt contribution 7. Conclusions s used to find the optimum conditions ar rate and coefficient of friction were ob different parameters in inated by different pa- ra , 5 min slid- in r fa sliding speed and the ap led error obtained with the help of A w The multiple regression values obtained for wear rate and to xpress their deep sense of Kumar, Assistant Professor, ERENCES [1] S. J. Harris, “posites,” Materials Science and T 3, 1988, pp. 231- Figure 7. Wear and friction coefficient ofper- centage (Pr%). Taguchi’s method i for dry sliding wear of the hybrid metal matrix composite materials. The following are the conclusions drawn from the present study. 1) Optimum we tained from the experiment. 2) The wear rate is dominated by the order of percentage of reinforcement, applied load, sliding speed, and sliding time. ANOVA test concluded that as percentage of reinforcement increases the wear rate also decreases significantly. 3) Coefficient of friction is dom meters in the order of percentage of reinforcement, sliding speed, applied load, and sliding time. 4) 4.5 m/s sliding speed, 10 N applied load g time and 15% of reinforcement are the optimum con- ditions for both wear rate and the coefficient of friction. 5) Percentage of reinforcement (30.99%) is the wea ctor that has the highest physical properties as well as statistical influence on the dry sliding wear rate of the composites among the other factors such as applied load (29.96%), sliding speed (29.89%). 6) The interactions between the plied load will contribute more (2.45%) than other interactions. 7) The poonova ith respect to the parameters for wear rate and coeffi- cient of friction are 10.78% and 10.65% respectively. coefficient of friction are 0.865 and 0.866 respectively. 8) From confirmation tests, the errors associated with wear rate ranges between 6.90% to 11.76 % and 4.66 % 9.23 % for coefficient of friction resulting in the conclu- sion that the design of experiments by Taguchi method was successful for calculating wear rate and coefficient of friction from the regression equation. 8. Acknowledgements The authors would like to e gratitude to Prof. P. Suresh Department of Mechanical Engineering at Bannari Am- man Institute of Technology, Sathyamagalam, for his valuable support and guidance. They also extend their gratefulness to Mr. S. Sudhakar, Assistant Manager, BEML Ltd., Mysore, for his constant guidance and dis- cussion throughout the research work. The authors also would like to thank their M.E., Students for all their sup- ports. The authors would like to extend their gratitude to Bannari Amman Institute of Technology for providing infrastructural support. REF Cast Metal Matrix Com echnology, Vol. 4, No. 239. doi:10.1179/026708388790330024 [2] Y. Iwai, H. Yonede and T. Honda, “Sliding Wear Behav- iour of SiC Whisker-Reinforced Aluminum Composite,” Wear, Vol. 181-183, No. 2, 1995, pp. 594-602. doi:10.1016/0043-1648(95)90175-2 [3] A. Daoud, M. T. Abou El-Khair and A. N. Ab “Microstructure and Wear Behavio del-Azim, r of Squeeze Cast Tribology Let- 7075 Al-Al2O3 Particle Composites,” Proceedings of the 14th International Offshore and Polar Engineering Con- ference, Toulon, 23-28 May 2004, p. 252. [4] S. V. Prasad and R. Asthana, “Aluminum Metal-Matrix Composites for Automotive Applications,” ters, Vol. 17, No. 3, 2004, pp. 445-453. doi:10.1023/B:TRIL.0000044492.91991.f3 [5] N. Natarajan, S. Vijayarangan and I. R Behaviour of A356/25SiCp Aluminium Ma ajendran, “Wear trix Compos- ites Sliding Against Automobile Friction Material,” Wear, Vol. 261, No. 7-8, 2006, pp. 812-822. doi:10.1016/j.wear.2006.01.011 [6] S. Basavarajappa and G. Chandramohan, “Wear Studies Copyright © 2012 SciRes. JMMCE  V. C. UVARAJA, N. NATARAJAN 768 on Metal Matrix Composites: A Taguchi Approach,” Jour- aviour of Aluminium/Alumina/Graphite Hy- nal of Material Science Technology, Vol. 21, No. 6, 2005, pp. 845-850. [7] N. Radhika, R. Subramanian and S. Venkat Prasat, “Tri- bological Beh [9] brid Metal Matrix Composite Using Taguchi’s Techni- ques,” Journal of Minerals & Materials Characterization & Engineering, Vol. 10, No. 5, 2011, pp. 427-443. [8] K. Umanath, S. T. Selvamani and K. Palanikumar, “Fric- tion and Wear Behaviour of Al-6061 Alloy (SiCp + Al2O3p) Hybrid Composites,” International Journal of Engineering Science and Technology, Vol. 3, No. 7, 2011, pp. 5441-5451. P. J. Ross, “Taguchi Techniques for Quality Engineer- ing,” 2nd Edition, McGraw-Hill Book Co., New York, 1996, pp. 23-42. [10] Siddhartha, A. Patnaik and A. D. Bhatt, “Mechanical and Dry Sliding Wear Characterization of Epoxy-TiO2 Par- ticulate Filled Functionally Graded Composite Materials Using Taguchi Design of Experiment,” Material & De- sign, Vol. 32, No. 2, 2011, pp. 615-627. doi:10.1016/j.matdes.2010.08.011 Copyright © 2012 SciRes. JMMCE |