Vol.2, No.6, 626-630 (2010) Natural Science
http://dx.doi.org/10.4236/ns.2010.26077
Copyright © 2010 SciRes. OPEN ACCESS
Thermophysical properties of dunite rocks as a function
of temperature along with the prediction of effective
thermal conductivity
Aurang Zeb1*, Tayyaba Firdous2, Asghari Maqsood3
1Department of Applied Physics, Federal Urdu University of Arts Science and Technology, Islamabad, Pakistan; *Corresponding
Author: aurangzebbabar@yahoo.com
2Department of Physics, Air University, Islamabad, Pakistan;
3Thermal Transport Laboratory, School of Chemical and Materials Engineering, NUST, Islamabad, Pakistan; asgharimaq-
sood@yahoo.com
Received 29 December 2009; revised 4 March 2010; accepted 7 April 2010.
ABSTRACT
The thermal conductivity, thermal diffusivity and
heat capacity per unit volume of dunite rocks
taken from Chillas near Gilgit, Pakistan have
been measured simultaneously using transient
plane source technique. The temperature depe-
ndence of thermal transport properties is stud-
ied in the temperature range 83-303 K. Different
relations for the estimation of thermal conduc-
tivity are also tested. Thermal conductivity data
obey the modified Eucken’s law in the temper-
ature range of measurements.
Keywords: Dunite; Density; Porosity; Thermal
Conductivity; Transient Plane Source (TPS)
Technique
1. INTRODUCTION
The most relevant thermal parameters of rocks are ther-
mal conductivity, heat capacity per unit volume and the-
rmal diffusivity. The first two parameters give the capa-
bility of a material to conduct and accumulate heat, re-
spectively; and the last one represents how fast heat dif-
fuses through a material [1].
1.1. Introduction to Samples
Igneous rocks are classified on the basis of texture and
chemical composition.
On the basis of texture igneous rocks are classified in
to two groups.
1.1.1. Extrusive or Volcanic
When magma comes out of the surface of earth (called
lava) then rapid cooling and crystallization of that ma-
gma above the earth surface form volcanic igneous rocks.
Most types of lavas cool rapidly, resulting in the forma-
tion of rocks composed mainly of microscopic crystals.
Some lavas cool so quickly that they form a smooth
volcanic glass called obsidian. These are too fine-
grained or glassy that their mineral composition cannot
be observed without the use of petrographic microscope.
1.1.2. Intrusive or Plutonic
The cooling and crystallization of molten magma below
the surface of earth form these rocks. Magma that forms
the intrusive rocks solidifies relatively slow; and so,
most of the intrusive rocks have larger crystals than of
extrusive rocks. The mineral grain size of these rocks is
visible to naked eye even.
On the basis of chemistry igneous rocks are classified
in to four groups [2].
1.1.3. Felsic
Igneous rocks derived from felsic magma contain rela-
tively high quantities of sodium, aluminium and potas-
sium and are composed of more than 65% silica (SiO2).
Some common felsic igneous rocks include fine-grained
Rhyolite and coarse-grained Granite. All of felsic rocks
are light in colour because of the dominance of quartz,
potassium and sodium feldspars, and plagioclase feld-
spars minerals.
1.1.4. Intermediate
Some igneous rocks having chemistry between felsic
and mafic rocks are known as intermediate. Silica amo-
unts from 52% to 65%. Andesite (intrusive) and Diorite
(extrusive) are intermediate igneous rocks. These rocks
are composed predominantly Plagioclase feldspar, Am-
phibole and Pyroxene minerals.
1.1.5. Mafic
Igneous rocks derived from mafic magma rich in cal-
A. Zeb et al. / Natural Science 2 (2010) 626-630
Copyright © 2010 SciRes. OPEN ACCESS
627
627
cium, iron and magnesium and relatively poor in silica,
amounts from 45% to 52%. Some common mafic igne-
ous rocks include-fine grained Basalt and coarse-grained
Gabbro. Mafic igneous rocks tend to be dark in colour
because they contain a large proportion of minerals rich
in iron and magnesium (Pyroxene, Amphiboles and Oli-
vine).
1.1.6. Ultramafic
These rocks contain relatively low amount of silica <
45% and are dominated by the minerals olivine, calcium
rich plagioclase feldspars and pyroxene. Peridotite and
Dunite are the most common ultramafic rocks having
coarse-grained texture. There is no known modern fine-
grained ultramafic rock. The samples studied here be-
long to the dunite group of igneous rocks.
The density related properties of the selected samples
at room temperature along with their thermal properties
in temperature range (303-483 K) are already published
[3]. In this paper only the thermal transport properties
are measured in temperature range 83 to 303 K at normal
pressure, with air as saturant in pore spaces, using Tran-
sient Plane Source Technique [4].
In continuation of our previous work [5,6], the aim in
this work is to study thermal transport properties of du-
nite rocks as a function of temperature and to test vari-
ous relations for the prediction of effective thermal con-
ductivity of porous media.
2. EXPERIMENTAL TECHNIQUES AND
SAMPLE CHARACTERIZATION
The thermal transport properties of the samples were
measured as a function of temperature, using transient
plane source (TPS) technique. The beauty of TPS tech-
nique is that it allows measurements without any distur-
bance from the interfaces between the sensor and the
bulk samples. Also, simultaneous measurement of ther-
mal conductivity and thermal diffusivity is possible [4].
In this technique, a TPS-element (Figure 1) sandwiched
between two halves of the sample is used both as a con-
stant heat source and a sensor of temperature.
Connecting Leads
TPS-Element
N
ikel Foil
Insulating Layers
Sam
p
le Pieces
Figure 1. A TPS-sensor sandwiched between sample
pieces [7].
For data collection the TPS-element (20 mm diameter)
was used in a bridge circuit, shown in Figure 2.
When sufficiently large (constant) amount of direct
current is passed through the TPS-element, its tempera-
ture changes consequently and there is a voltage drop
across the TPS-element. By recording this voltage drop
for a particular time interval, detailed information about
the thermal conductivity (
) and thermal diffusivity (
)
of the test specimen is obtained. The heat capacity per
unit volume (P
C
) can then be calculated from the re-
lation:
P
C, (1)
The results of the thermophysical measurements on
the samples at different temperatures and normal pres-
sure are shown in Figure 3.
It is to be noted that the results of thermal properties
in high temperature range 303 to 483 K [3] are also in-
cluded in Figure 3, so that one can observe the overall
behavior of thermal properties of these samples over a
wide range of temperature (83-483 K).
Taking into consideration the errors of the technique
[7,8], standard deviations of the measurements and the
sampling errors, the thermal conductivity and thermal
diffusivity data contain errors of 5% and 7% respectively.
The errors in volumetric heat capacity are around 10%.
3. THERMAL CONDUCTIVITY
PREDICTION
A typical equation used for temperature dependence of
lattice (phonon) thermal conductivity is:
BTA
T
)(
1
, (2)
c
a
b
d
R
1
R
2
R
0
R
s
R
TPS element
Power Supply
DVM
HP-IB
+
Figure 2. Bridge circuit diagram for TPS tech-
nique: Rs = Standard resistance, R0 = Resistance
of TPS sensor [9].
A. Zeb et al. / Natural Science 2 (2010) 626-630
Copyright © 2010 SciRes. OPEN ACCESS
628
Figure 3. Temperature dependence of thermal conductivity, thermal diffusivity and heat capacity per unit volume,
BTA
T
)(
1
and STR
T
)(
1
. Estimated uncertainties in
and
are about 5% and 7% respectively.
where A(W-1·m·K) and B(W-1·m) are constants related to
the scattering properties of phonons. A is related to scat-
tering of phonons by impurities and imperfections [10];
and B is related to phonon-phonon scattering and is ap-
proximately proportional to an inverse power of sound
velocity [11].
The physical justification of the term A is the exis-
tence of numerous additional scattering centers for pho-
nons in materials, caused by structural and chemical
imperfections and the influence of the grain boundaries.
Eq.2 is analogous to Matthiessen’s rule of electrical re-
sistivity in metals, which is:
()
eeoe
T

, (3)
where eo
is the extrapolated electrical resistivity at 0 K
and is called the residual resistivity. This is the tempera-
ture independent part of the resistivity. That is, the value
of eo
depends upon the concentration of impurities
and other imperfections in the sample. It can be taken as
the measure of impurity of the specimen. The tempera-
A. Zeb et al. / Natural Science 2 (2010) 626-630
Copyright © 2010 SciRes. OPEN ACCESS
629
629
ture dependent part of resistivity )(T
e
is decided by
the phonons. It is called the lattice resistivity [12].
For diffusivity (having the same trend as thermal
conductivity), the analogous equation was assumed to
be:

STR
T
1 (4)
The results obtained using Eqs.2 and 4 along with the
experimental results / values of
and
are shown
in Figure 3. The correlation coefficients for thermal
conductivity

r and thermal diffusivity

r are also
listed in Table 1.
The data appear to fit very well (above 97%). The
values of p
C
can be calculated using Eq.1.
Eq.2 may also be written as [13,14]:
)1/()1()( bT
r
bT
r
T
, (5)
where r
(W·m-1·K-1) is the thermal conductivity at a
reference temperature and b(K-1) is a single temperature
coefficient of thermal conductivity parameter, control-
ling the temperature dependence of thermal conductivity.
b is related to parameters A and B of Eq.2, as:
b = B/A (6)
The reference value of thermal conductivity (r
) is
simply derived from Eq.2, using r
TT (reference/
room temperature). It is to be noted that each of the Eq.2
or 5 is the modified Eucken’s rule.
A recently proposed empirical model [6] for the pre-
diction of thermal conductivity as a function of tem-
perature is:
11
es fr
mΦT
T


 

, (7)
where m is the empirical coefficient whose value can
be determined at suitable temperatures, using the cor-
responding experimental values of thermal conductivity
and the room temperature values of Φ, f
and s
; by

exp
1/1/ s
fr
mT T





(8)
The empirical coefficients, exponents or adjustable
parameters may vary according to the suite of rocks. Th-
erefore, the extrapolations of empirical models to suites
of rocks other than those used in developing these mod-
els may not be satisfactory [15].
4. RESULTS AND DISCUSSION
It is well known that thermal transport properties of po-
rous rocks depend upon their structure, mineral compo-
sition, porosity, density, the ability of their constituent
minerals to conduct heat, temperature, pressure; etc.
The temperature dependence of thermal conductivity
and thermal diffusivity in the temperature range 83 to
483 K at suitable intervals is shown in Figure 3. It is
observed that thermal conductivity decreases in the
measured temperature range. This is in agreement with
the theory of thermal conductivity. The thermal diffusiv-
ity shows decreasing trend; again in agreement with the
theory.
For dunite samples, in Eq.5, the empirical coefficient
b is taken to be 0.0172 which is equal to the mean of all
the values of b listed in Table 1. Similarly the mean
value of r
is found to be 3.858 W·m-1·K-1 at 303 K.
Using these values of adjustable parametersr
and b,
thermal conductivity values are predicted along with the
experimental measurements and are plotted in Figure 4.
It is to be noted that in Eq.5, all the parameters ef-
fecting thermal conductivity (such as porosity, density,
thermal conductivity values of constituent minerals and
the fluid inside the pores, etc.) are dumped into adjust-
able parameters and the errors in predicting thermal
conductivity are only up to 10% in the temperature range
243 K to 333 K, which is the most interesting range for
construction purposes.
Table 1. Parameters A, B, R and S for the thermal resistivity 1()
T and the inverse of thermal diffusivity 1()
T of dunites as
represented by Eqs.2 and 4.
r and
r are the respective correlation coefficients.
Specimen A B
r R S
r b = B/A r
W
-1·m·K 10-4W-1·m m
-2·sec 10
-3 m-2·sec ·K -1 K
-1 W·m
-1·K-1
Dn01 0.053 5.24 0.98 –0.116 2.23 0.98 0.010 4.728
Dn03 0.029 6.29 1.00 –0.165 2.58 0.99 0.021 4.545
Dn05 0.025 7.36 1.00 –0.362 3.88 0.99 0.029 4.027
Dn07 0.040 7.75 1.00 –0.271 3.74 0.99 0.019 3.639
Dn09 0.016 8.80 0.99 –0.365 4.06 1.00 0.056 3.545
Dn11 –0.036 1.17 0.98 –0.550 5.06 0.99 –0.032 3.140
A. Zeb et al. / Natural Science 2 (2010) 626-630
Copyright © 2010 SciRes. OPEN ACCESS
630
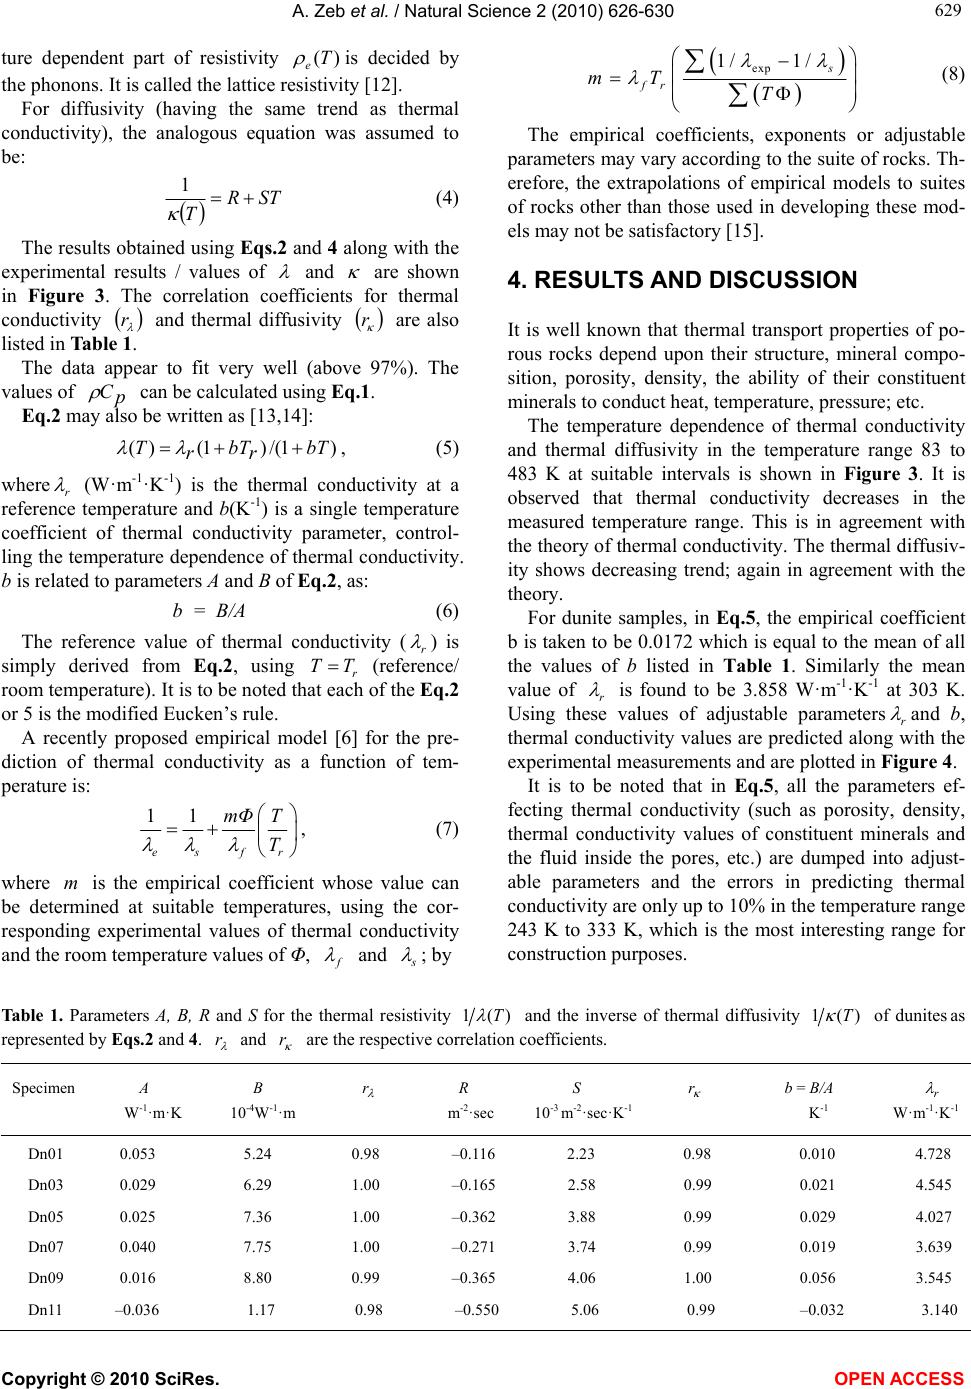
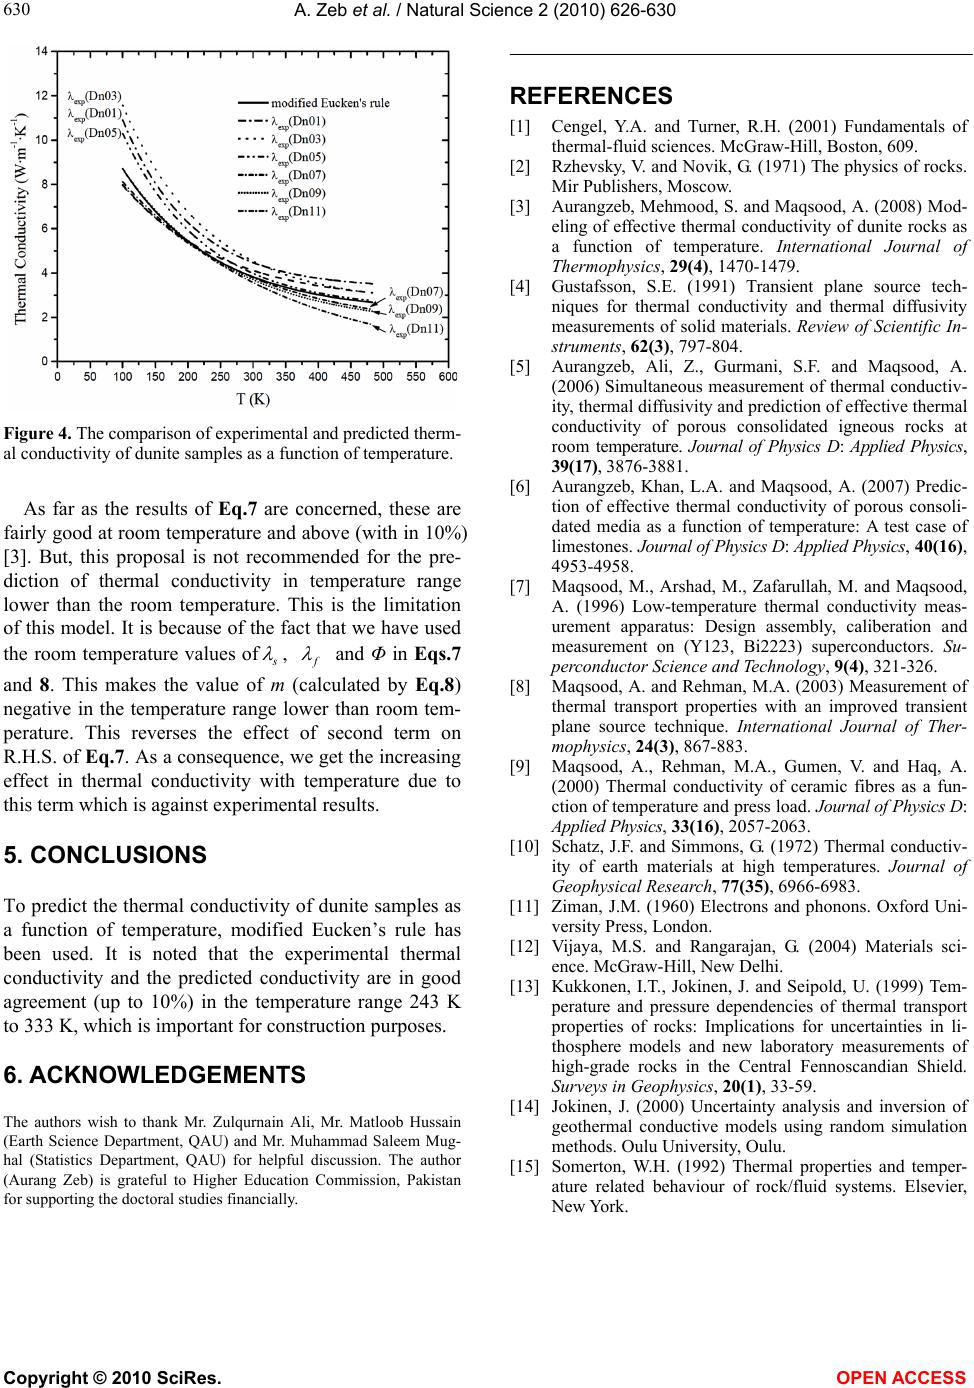
Figure 4. The comparison of experimental and predicted therm-
al conductivity of dunite samples as a function of temperature.
As far as the results of Eq.7 are concerned, these are
fairly good at room temperature and above (with in 10%)
[3]. But, this proposal is not recommended for the pre-
diction of thermal conductivity in temperature range
lower than the room temperature. This is the limitation
of this model. It is because of the fact that we have used
the room temperature values ofs
, f
and Φ in Eqs.7
and 8. This makes the value of m (calculated by Eq.8)
negative in the temperature range lower than room tem-
perature. This reverses the effect of second term on
R.H.S. of Eq.7. As a consequence, we get the increasing
effect in thermal conductivity with temperature due to
this term which is against experimental results.
5. CONCLUSIONS
To predict the thermal conductivity of dunite samples as
a function of temperature, modified Eucken’s rule has
been used. It is noted that the experimental thermal
conductivity and the predicted conductivity are in good
agreement (up to 10%) in the temperature range 243 K
to 333 K, which is important for construction purposes.
6. ACKNOWLEDGEMENTS
The authors wish to thank Mr. Zulqurnain Ali, Mr. Matloob Hussain
(Earth Science Department, QAU) and Mr. Muhammad Saleem Mug-
hal (Statistics Department, QAU) for helpful discussion. The author
(Aurang Zeb) is grateful to Higher Education Commission, Pakistan
for supporting the doctoral studies financially.
REFERENCES
[1] Cengel, Y.A. and Turner, R.H. (2001) Fundamentals of
thermal-fluid sciences. McGraw-Hill, Boston, 609.
[2] Rzhevsky, V. and Novik, G. (1971) The physics of rocks.
Mir Publishers, Moscow.
[3] Aurangzeb, Mehmood, S. and Maqsood, A. (2008) Mod-
eling of effective thermal conductivity of dunite rocks as
a function of temperature. International Journal of
Thermophysics, 29(4), 1470-1479.
[4] Gustafsson, S.E. (1991) Transient plane source tech-
niques for thermal conductivity and thermal diffusivity
measurements of solid materials. Review of Scientific In-
struments, 62(3), 797-804.
[5] Aurangzeb, Ali, Z., Gurmani, S.F. and Maqsood, A.
(2006) Simultaneous measurement of thermal conductiv-
ity, thermal diffusivity and prediction of effective thermal
conductivity of porous consolidated igneous rocks at
room temperature. Journal of Physics D: Applied Physics,
39(17), 3876-3881.
[6] Aurangzeb, Khan, L.A. and Maqsood, A. (2007) Predic-
tion of effective thermal conductivity of porous consoli-
dated media as a function of temperature: A test case of
limestones. Journal of Physics D: Applied Physics, 40(16),
4953-4958.
[7] Maqsood, M., Arshad, M., Zafarullah, M. and Maqsood,
A. (1996) Low-temperature thermal conductivity meas-
urement apparatus: Design assembly, caliberation and
measurement on (Y123, Bi2223) superconductors. Su-
perconductor Science and Technology, 9(4), 321-326.
[8] Maqsood, A. and Rehman, M.A. (2003) Measurement of
thermal transport properties with an improved transient
plane source technique. International Journal of Ther-
mophysics, 24(3), 867-883.
[9] Maqsood, A., Rehman, M.A., Gumen, V. and Haq, A.
(2000) Thermal conductivity of ceramic fibres as a fun-
ction of temperature and press load. Journal of Physics D:
Applied Physics, 33(16), 2057-2063.
[10] Schatz, J.F. and Simmons, G. (1972) Thermal conductiv-
ity of earth materials at high temperatures. Journal of
Geophysical Research, 77(35), 6966-6983.
[11] Ziman, J.M. (1960) Electrons and phonons. Oxford Uni-
versity Press, London.
[12] Vijaya, M.S. and Rangarajan, G. (2004) Materials sci-
ence. McGraw-Hill, New Delhi.
[13] Kukkonen, I.T., Jokinen, J. and Seipold, U. (1999) Tem-
perature and pressure dependencies of thermal transport
properties of rocks: Implications for uncertainties in li-
thosphere models and new laboratory measurements of
high-grade rocks in the Central Fennoscandian Shield.
Surveys in Geophysics, 20(1), 33-59.
[14] Jokinen, J. (2000) Uncertainty analysis and inversion of
geothermal conductive models using random simulation
methods. Oulu University, Oulu.
[15] Somerton, W.H. (1992) Thermal properties and temper-
ature related behaviour of rock/fluid systems. Elsevier,
New York.