Paper Menu >>
Journal Menu >>
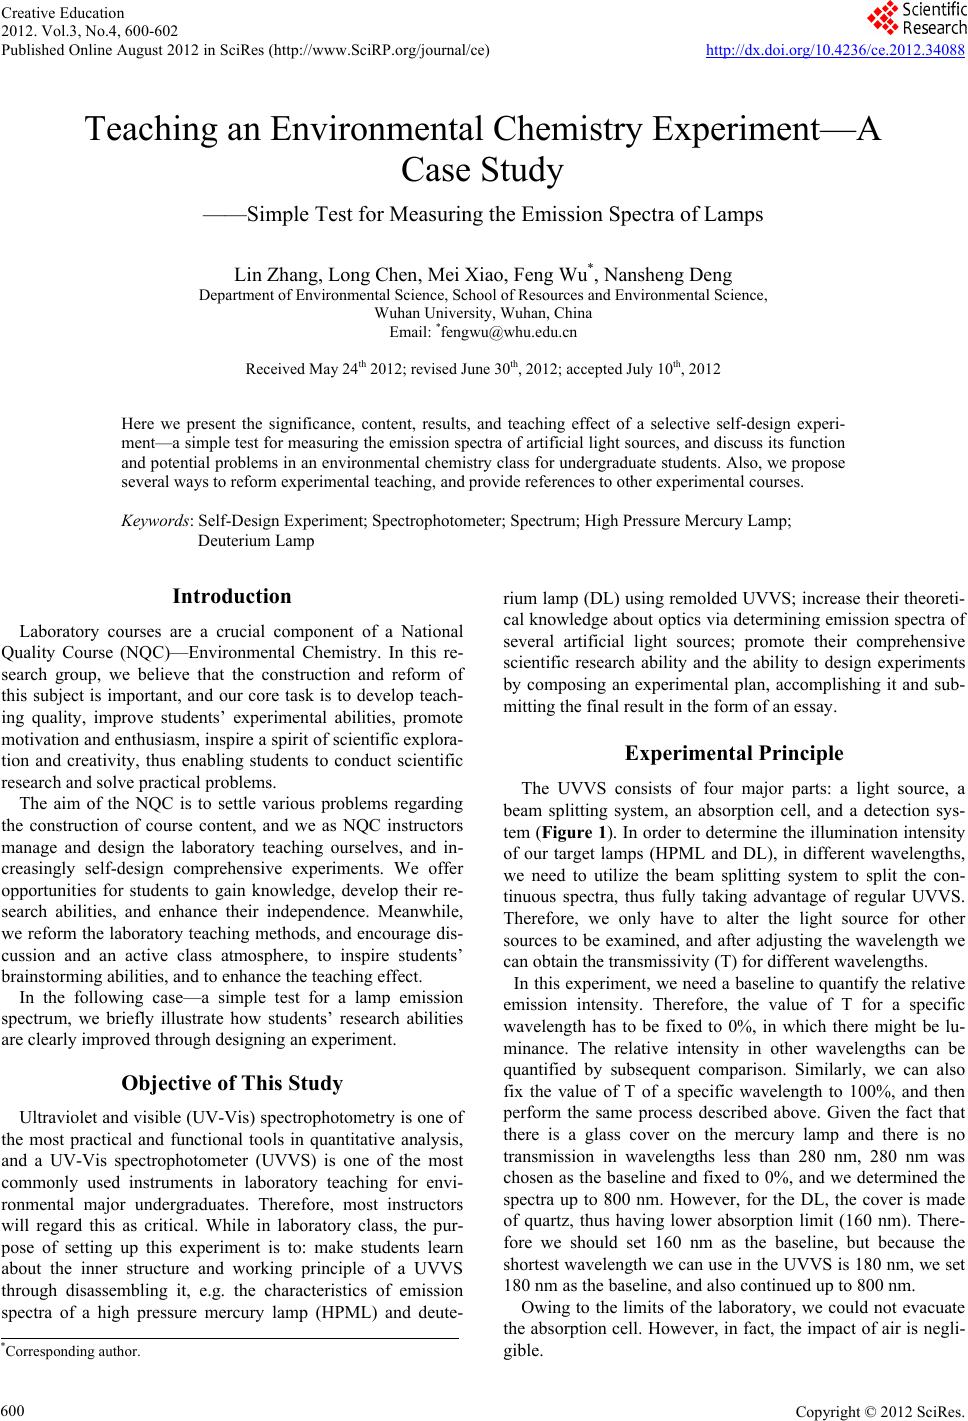 Creative Education 2012. Vol.3, No.4, 600-602 Published Online August 2012 in SciRes (http://www.SciRP.org/journal/ce) http://dx.doi.org/10.4236/ce.2012.34088 Copyright © 2012 SciRe s . 600 Teaching an Environmental Chemistry Experiment—A Case Study ——Simple Test for Measuring the Emission Spectra of Lamps Lin Zhang, Long Chen, Mei Xiao, Feng Wu*, Nansheng Deng Department of Environmental Science, School of Resources and Environmental Science, Wuhan University, W u h an , China Email: *fengwu@whu.edu.cn Received May 24th 2012; revised June 30th, 2012; accepted July 10th, 2012 Here we present the significance, content, results, and teaching effect of a selective self-design experi- ment—a simple test for measuring the emission spectra of artificial light sources, and discuss its function and potential problems in an environmental chemistry class for undergraduate students. Also, we propose several ways to reform experimental teaching, and provide references to other experimental courses. Keywords: Self-Design Experiment; Spectrophotometer; Spectrum; High Pressure Mercury Lamp; Deuterium Lamp Introduction Laboratory courses are a crucial component of a National Quality Course (NQC)—Environmental Chemistry. In this re- search group, we believe that the construction and reform of this subject is important, and our core task is to develop teach- ing quality, improve students’ experimental abilities, promote motivation and enthusiasm, inspire a spirit of scientific explora- tion and creativity, thus enabling students to conduct scientific research and solve practical problems. The aim of the NQC is to settle various problems regarding the construction of course content, and we as NQC instructors manage and design the laboratory teaching ourselves, and in- creasingly self-design comprehensive experiments. We offer opportunities for students to gain knowledge, develop their re- search abilities, and enhance their independence. Meanwhile, we reform the laboratory teaching methods, and encourage dis- cussion and an active class atmosphere, to inspire students’ brainstorming abilities, and to enhance the teaching effect. In the following case—a simple test for a lamp emission spectrum, we briefly illustrate how students’ research abilities are clearly improved through designing an experiment. Objective of This Study Ultraviolet and visible (UV-Vis) spectrophotometry is one of the most practical and functional tools in quantitative analysis, and a UV-Vis spectrophotometer (UVVS) is one of the most commonly used instruments in laboratory teaching for envi- ronmental major undergraduates. Therefore, most instructors will regard this as critical. While in laboratory class, the pur- pose of setting up this experiment is to: make students learn about the inner structure and working principle of a UVVS through disassembling it, e.g. the characteristics of emission spectra of a high pressure mercury lamp (HPML) and deute- rium lamp (DL) using remolded UVVS; increase their theoreti- cal knowledge about optics via determining emission spectra of several artificial light sources; promote their comprehensive scientific research ability and the ability to design experiments by composing an experimental plan, accomplishing it and sub- mitting the final result in the form of an essay. Experimental Principle The UVVS consists of four major parts: a light source, a beam splitting system, an absorption cell, and a detection sys- tem (Figure 1). In order to determine the illumination intensity of our target lamps (HPML and DL), in different wavelengths, we need to utilize the beam splitting system to split the con- tinuous spectra, thus fully taking advantage of regular UVVS. Therefore, we only have to alter the light source for other sources to be examined, and after adjusting the wavelength we can obtain the transmissivity (T) for different wavelengths. In this experiment, we need a baseline to quantify the relative emission intensity. Therefore, the value of T for a specific wavelength has to be fixed to 0%, in which there might be lu- minance. The relative intensity in other wavelengths can be quantified by subsequent comparison. Similarly, we can also fix the value of T of a specific wavelength to 100%, and then perform the same process described above. Given the fact that there is a glass cover on the mercury lamp and there is no transmission in wavelengths less than 280 nm, 280 nm was chosen as the baseline and fixed to 0%, and we determined the spectra up to 800 nm. However, for the DL, the cover is made of quartz, thus having lower absorption limit (160 nm). There- fore we should set 160 nm as the baseline, but because the shortest wavelength we can use in the UVVS is 180 nm, we set 180 nm as the baseline, and also continued up to 800 nm. Owing to the limits of the laboratory, we could not evacuate the absorption cell. However, in fact, the impact of air is negli- gible. *Corresponding author. 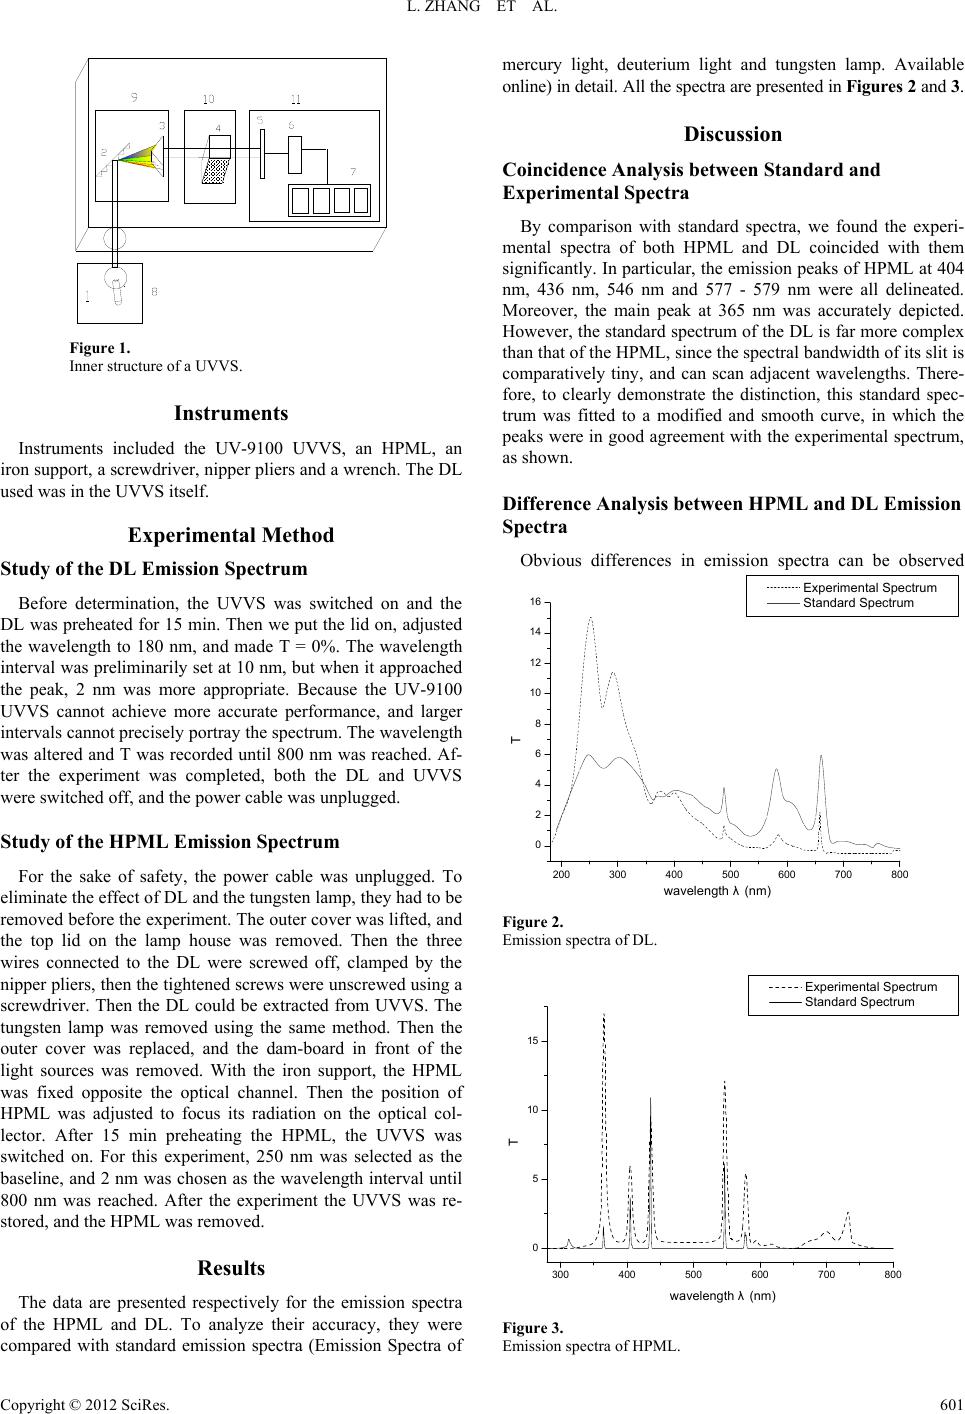 L. ZHANG ET AL. Figure 1. Inner structure of a UVVS. Instruments Instruments included the UV-9100 UVVS, an HPML, an iron support, a screwdriver, nipper pliers and a wrench. The DL used was in the UVVS itself. Experimental Method Study of the DL Emission Spectrum Before determination, the UVVS was switched on and the DL was preheated for 15 min. Then we put the lid on, adjusted the wavelength to 180 nm, and made T = 0%. The wavelength interval was preliminarily set at 10 nm, but when it approached the peak, 2 nm was more appropriate. Because the UV-9100 UVVS cannot achieve more accurate performance, and larger intervals cannot precisely portray the spectrum. The wavelength was altered and T was recorded until 800 nm was reached. Af- ter the experiment was completed, both the DL and UVVS were switched off, and the power cable was unplugged. Study of the HPML Emission Spectrum For the sake of safety, the power cable was unplugged. To eliminate the effect of DL and the tungsten lamp, they had to be removed before the experiment. The outer cover was lifted, and the top lid on the lamp house was removed. Then the three wires connected to the DL were screwed off, clamped by the nipper pliers, then the tightened screws were unscrewed using a screwdriver. Then the DL could be extracted from UVVS. The tungsten lamp was removed using the same method. Then the outer cover was replaced, and the dam-board in front of the light sources was removed. With the iron support, the HPML was fixed opposite the optical channel. Then the position of HPML was adjusted to focus its radiation on the optical col- lector. After 15 min preheating the HPML, the UVVS was switched on. For this experiment, 250 nm was selected as the baseline, and 2 nm was chosen as the wavelength interval until 800 nm was reached. After the experiment the UVVS was re- stored, and the HPML was removed. Results The data are presented respectively for the emission spectra of the HPML and DL. To analyze their accuracy, they were compared with standard emission spectra (Emission Spectra of mercury light, deuterium light and tungsten lamp. Available online) in detail. All the spectra are presented in Fi gures 2 and 3. Discussion Coincidence Analysis between Standard and Experimental Spectra By comparison with standard spectra, we found the experi- mental spectra of both HPML and DL coincided with them significantly. In particular, the emission peaks of HPML at 404 nm, 436 nm, 546 nm and 577 - 579 nm were all delineated. Moreover, the main peak at 365 nm was accurately depicted. However, the standard spectrum of the DL is far more complex than that of the HPML, since the spectral bandwidth of its slit is comparatively tiny, and can scan adjacent wavelengths. There- fore, to clearly demonstrate the distinction, this standard spec- trum was fitted to a modified and smooth curve, in which the peaks were in good agreement with the experimental spectrum, as shown. Difference Analysis between HPML and DL Emission Spectra Obvious differences in emission spectra can be observed 200 300 400 500 600 700 800 0 2 4 6 8 10 12 14 16 T wavelength λ(nm) Experimental Spectrum Standard Spectrum Figure 2. Emission spectra of DL. 300 400 500600 700 800 0 5 10 15 T wavelength λ(nm) Experimental Spectrum Standard Spectrum Figure 3. Emission spectra of HPML. Copyright © 2012 SciRe s . 601  L. ZHANG ET AL. Copyright © 2012 SciRe s . 602 between the HPML and DL—the spectrum of the former is scattered, while the spectrum of the latter is more continuous. This is because the irradiation of the mercury lamp depends on atoms. After they absorb energy from the high voltage, the electrons can move to higher energy levels, and this process is called transition. Because higher energy levels result in unsta- ble states, some electrons will return to lower energy levels, releasing electromagnetic radiation. Moreover, with increasing mercury vapor pressure, the atomic collision becomes more frequent and intense, so the emission spectra will be more and more continuous. In fact, the emission spectrum of an ultra high pressure mercury lamp is almost band spectrum. However, a DL can radiate a continuous spectrum in the ultraviolet band. That is why the DL can be the ultraviolet light source for a UVVS. Effect Analysis of This Experimental Method With the widespread use of various lamps and developments in lamp technology, nowadays the life span, energy saving performance, light color etc. are greatly improved. Sometimes, the absolute calibration of the spectral irradiance, especially in modern research, is necessary. Tang et al. (Tang & Li, 1996) has studied the absolute calibration in short wave areas of the DL. Huang et al. (Huang, Wang, Zhang, Lin, & Li, 2007) once used a DL to standardize the irradiance in wavelengths between 200 and 300 nm, while Wang et al. (Wang & Zhu, 1992) dis- cussed methods to automatically collect mercury lamp spectra. Although very precise, these methods are very costly, and un- necessary for undergraduate students. However, in this experi- ment, we determined the spectra by comparison with the base- line, and obtained relatively accurate and practical emission spectra for the HPML and DL. Therefore, using this original and cheap method, undergraduate students obtained a good command of the characteristics of emission spectra of several artificial light sources, and how to explore scientifically and practically. Conclusion This self-design experiment system fully takes advantage of a UVVS in the laboratory setting, utilizing its basic principle to determine t he emission spe ctra of a HPML and DL. The results fit very well with standard spectra. The reason for lack of de- tailed spectral characteristics of DL is because the spectral bandwidth is too large to achieve a more detailed determination. Compared with absolution calibration, which is prevalent now- adays, this method is quite simple and inexpensive. In addition, it can enhance students’ understanding of UVVS, as well as the emission spectra of lamps discussed above. Implications of the Study This entire process is a self-design experiment. Initially, stu- dents were requested to consult the literatures through the li- brary or Internet resources, and put forward a plan after group discussions which included 10 - 12 members. Then the instruc- tor organized all the students to participate in the discussion, and each group was required to state their plan, and to reply to various questions raised by the other students. Before the ex- periment, the plan was recomposed accordingly. In addition, an essay was require d for submi ssion after the experiment. This is the 5th year of this self-design experiment series. We aimed to perfect these self-design experiments so that students can display their creativity, actively participate and boost mo- rale, enjoy the sense of success, and share their skills with oth- ers. However, some problems were inevitable. First, laboratory instruments, reagents and funds are limited, and sometimes cannot fulfill the students’ ideas. Second, due to the lack of laboratory class hours, we could not conduct some time-con- suming and complicated experiments, which may have facili- tated their subsequent studies. According to this experience, we will re-schedule class time distribution for basic, comprehend- sive and self-design experiments, leaving more time for the self-design series. Beyond that, more channels for funds, in- struments and reagents will be definitely explored. In conclusion, time has shown the benefits of self-design ex- periments. Not only can the students attain increased creativity and comprehensive knowledge, but also attain a solid founda- tion for their future success. REFERENCES Emission spectra of mercury light, deuterium light and tungsten lamp. http://www.instrument.com.cn/result/shtml/17427.shtml Huang, Y., Wang, S. R., Zhang, Z. D., Lin, G. Y., & Li, F. T. (2007). Calibration of 200 - 300 nm spectral irradiance using 150 W deute- rium lamp. Optics and Precision Engineering, 15, 1215-1219. Tang, Y. G., & Li, F. T. (1996). Absolute calibration of the spectral irradiance of quartz window deuterium lamp in 200 - 350 nm. Spec- troscopy and Spectral An a l ys i s , 16, 7-10. Wang, Q., & Zhu, Z. Q. (1992). Automatic collecting method of mer- cury lamp spectrum. Opto-Electronic Engineerin g, 19, 52-56. |