Paper Menu >>
Journal Menu >>
 Engineering, 2010, 2, 408-419 doi:10.4236/eng.2010.26054 Published Online June 2010 (http://www.SciRP.org/journal/eng). Copyright © 2010 SciRes. ENG Experimental Investigation and Development of Artificial Neural Network Model for the Properties of Locally Produced Light Weight Aggregate Concrete Mostafa A. M. Abdeen1, Hossam Hodhod2 1Department of Engineering, Mathematics & Physics, Faculty of Engineering, Cairo University, Giza, Egypt 2Department of Structural Engineering, Faculty of Engineering, Cairo University, Giza, Egypt E-mail: {mostafa_a_m_abdeen, hossamhodhod}@hotmail.com Received December 27, 2009; revised February 21, 2010; accepted February 26, 2010 Abstract The developments in the field of construction raise the need for concrete with less weight. This is beneficial for different applications starting from the less load applied to foundations and soil till the reduction of car- nage capacity required for lifting precast units. In this paper, the production of light weight concrete from light local weight aggregate is investigated. Three candidate materials are used: crushed fired brick, vermicu- lite and light exfoliated clay aggregate (LECA). The first is available as the by-product of brick industry and the later two types are produced locally for different applications. Nine concrete mixes were made with same proportions and different aggregate materials. Physical and mechanical properties were measured for con- crete in fresh and hardened states. Among these measured ones are unit weight, slump, compressive and ten- sile strength, and impact resistance. Also, the performance under elevated temperature was measured. Re- sults show that reduction of unit weight up to 45%, of traditional concrete, can be achieved with 50% reduc- tion in compressive strength. This makes it possible to get structural light weight concrete with compressive strength of 130 kg/cm2. Light weight concrete proved also to be more impact and fire resistant. However, as expected, it needs separate calibration curves for non-destructive evaluation. Following this experimental effort, the Artificial Neural Network (ANN) technique was applied for simulating and predicting the physical and mechanical properties of light weight aggregate concrete in fresh and hardened states. The current paper introduced the (ANN) technique to investigate the effect of light local weight aggregate on the performance of the produced light weight concrete. The results of this study showed that the ANN method with less effort was very efficiently capable of simulating the effect of different aggregate materials on the performance of light weight concrete. Keywords: Light Weight Concrete, Locally Produced Aggregate, Ultrasonic Pulse Velocity, Modeling, Artificial Neural Network 1. Introduction One of the main disadvantages of using concrete for construction is its high weight. Recent applications of high rise buildings, long span buildings, and precast elements require reduction in weight to keep concrete a competent construction material. Several approaches for reducing concrete weight were introduced as in Rama- chandran et al. [1], ACI [2], ACI [3], ACI [4] and Neville [5]. These include production of aerated concrete, light weight aggregate concrete, and cellular concrete. The first type has quite a low strength which makes it unsuitable for structural applications. Cellular concrete is produced from traditional concrete materials with apply- ing advanced technology to produce concrete with align- ed voids that do not reduce its structural capacity for a specific application (usually for slabs; where reduction in weight is most appreciated). The application of light wei- ght aggregate is the approach that reduces weight (since aggregate occupies about 70% of concrete volume) and maintains the merit of using traditional techniques of production. The feasibility of applying some material to construction results from its local availability. Therefore, investigation of feasibility of local aggregate for produc-  M. A. M. ABDEEN ET AL.409 tion of light weight concrete is of great importance. Since light weight aggregate has the merit of heat insula- tion, search in locally applied aggregate for insulation purposes would shorten the search for suitable light weight aggregate. In Egypt, LECA and crushed fired clay brick (a by-product of brick industry) are used for heat insulation. Therefore, they appear as good candi- dates for the required investigation. Vermiculite is lo- cally produced fro insulation purpose too. However, its small size suggests its application as a replacement of fine aggregate. It remains to investigate the structural properties of concrete made from these aggregates since they are not usually applied for structural purposes. It is quite clear from the literature mentioned previ- ously the amount of experimental effort required to ac- curately investigate and understand the properties of light weight concrete. This fact urged the need for utilizing new technology and techniques to facilitate this compre- hensive effort and at the same time preserving high ac- curacy. Artificial intelligence has proven its capability in simulating and predicting the behavior of the different physical phenomena in most of the engineering fields. Artificial Neural Network (ANN) is one of the artificial intelligence techniques that have been incorporated in various scientific disciplines. Ramanitharan and Li [6] utilized ANN with back-propagation algorithm for mod- eling ocean curves that were presented by wave height and period. Tawfik, Ibrahim and Fahmy [7] showed the applicability of using the ANN technique for modeling rating curves with hysteresis sensitive criterion. Abdeen [8] developed neural network model for predicting flow depths and average flow velocities along the channel reach when the geometrical properties of the channel cross sections were measured or vice versa. Allam [9] used the artificial intelligence technique to predict the effect of tunnel construction on nearby buildings which is the main factor in choosing the tunnel route. Allam, in her thesis, predicted the maximum and minimum differ- ential settlement necessary precautionary measures. Az- mathullah et al. [10] presented a study for estimating the scour characteristics downstream of a ski-jump bucket using Neural Networks (NN). Abdeen [11] presented a study for the development of ANN models to simulate flow behavior in open channel infested by submerged aquatic weeds. Mohamed [12] proposed an artificial neu- ral network for the selection of optimal lateral load-re- sisting system for multi-story steel frames. Mohamed, in her master thesis, proposed the neural network to reduce the computing time consumed in the design iterations. Abdeen [13] utilized ANN technique for the develop- ment of various models to simulate the impacts of dif- ferent submerged weeds’ densities, different flow dis- charges, and different distributaries operation scheduling on the water surface profile in an experimental main open channel that supplies water to different distributar- ies. 2. Problem Description To study the effect of light local weight aggregate as well as elevated temperature on the performance of the produced light weight concrete (compressive, tensile, im- pact, stiffness, and rebound number, ultrasonic pulse velocity), experimental and numerical techniques will be presented in this study. The experimental program and its results will be described in detail in the following sec- tions. The numerical models presented in this study util- ized Artificial Neural Network technique (ANN) using the data of the experiments and then can predict the per- formance of concrete for different mix proportions. 3. Experimental Program Ten mixes were planned to be cast. In the first one, Tra- ditional constituents were used (cement, sand, gravel and water). In the rest, coarse aggregate was replaced by one or more light weight aggregates. In these nine mixes, fine aggregate was partially or totally replaced by vermiculite (as a light weight fine aggregate). The slump was meas- ured for all mixes in the fresh state. Hardened concrete was tested to measure 7 & 28 day compressive strength, splitting tensile strength, Modulus of elasticity, Impact resistance, Rebound number, and ultrasonic pulse veloc- ity. Some specimens were subjected to elevated tempera- ture of 40℃ for one hour and tested to get residual com- pressive strength, Rebound number, and ultrasonic pulse velocity. 4. Materials and Specimens Constituents for concrete mixes were: water, cement, sand, gravel, vermiculite, crushed fired clay brick, and LECA. Their main properties are shown as follows. 4.1. Water Tap water was used for mixing and curing of all speci- mens. 4.2. Cement The used cement is Ordinary Portland cement CEM I - 42.5N complying with ES4756 and EN-197. It is pro- duced locally in EGYPT by Helwan Cement Company. 4.3. Sand Siliceous sand with fineness modulus of 3.04 was used. It Copyright © 2010 SciRes. ENG  M. A. M. ABDEEN ET AL. Copyright © 2010 SciRes. ENG 410 4.8. Fibers has a specific gravity of 2.6 and bulk density of 1.7 kg/L. 4.4. Gravel Natural Linen fibers were used in three mixes to evaluate the possible enhancement of properties when fibers are applied. These fibers are widely used in Egypt for deco- rative elements made from white cement and gypsum pastes. They have average diameter of 0.8 mm and comes in spools. They were cut to a length of 40 mm to be suitable for mixing with concrete constituents. Desert gravel from Dahshour quarry was used as in Figure 1. It has maximum nominal aggregate size of 25 mm. It has a specific gravity of 2.5 and bulk density of 1.56 kg/L. Mix proportions for all ten mixes are shown in Table 1. The replacement of fine and coarse aggregates (sand and gravel) was made by bulk volume. Mechanical tilt- ing type mixer (140 L capacity) was used where dry ma- terials were mixed first for one minute. Then water was added and mixing continued, for almost two minutes, till a homogeneous mixture was obtained. Some hand mix- ing was made at the end to resolve the problem of float- ing LECA. 4.5. LECA Light Exfoliated Clay Aggregate (LECA) which is pro- duced locally in Egypt by National Cement Company was used as a replacement of gravel. LECA particles are almost round with rough texture (Figure 1). They have maximum nominal size of 25 mm and contain a ratio ranging from 0.4-0.5 (by weight) with particle size in the range 4.76-2.4 mm. LECA has a bulk density of From each mix Specimens in forms of cubes (150 mm), beams (100 × 100 × 500 mm) and cylinders (150 × 0.58 kg/L. 300 mm) were cast in a steel forms. Specimens were covered with plastic sheets in lab for 24 hours and were, then, demolded. Specimens were cured by immersion in tap water at 22C till day of testing or 28 days whichever is less. 4.6. Crushed Fire Clay Brick Crushed fired clay brick is a by-product from brick in- dustry. It has irregular shape but can be crushed to have maximum nominal size of 25 mm as in Figure 1. The measured bulk density of the crushed brick used in this study is 1.2 kg/L. 5. Test Results The test results are explained in details in the following sections. The results of the numerical models and the test ones are drawn together in a same figure for each test to show the power of the models. 4.7. Vermiculite Vermiculite produced by Egyptian Vermiculite Company was used to replace sand. It is usually applied as heat insulator and have a light weight (SG = 0.55). Particles of vermiculite are almost round as shown in Figure 1 and have size in the range of 1-5 mm. 5.1. Slump The Slump was measured for all mixes after unloading of mixer. Test results are shown in Table 2. One can see that crushed bricks have the worst effect on slump. This can be attributed to its high absorption (10.5%). Also, combination of LECA and vermiculite seems to have an adverse effect on slump. 5.2. Bulk Density LECA Gravel Bulk density of different concrete mixes was measured on cube specimens in the hardened state after 28 days. Results are shown in Table 2. One can see that the maximum reduction in weight could be achieved using mix No. 5. This implies that LECA is most efficient in reducing weight of concrete. 5.3. Compressive Strength Crushed Bricks Vermiculite Compressive strength was measured at two ages: 7 and 28 days. Results are shown in Table 2 for all mixes. Figure 1. Different types of aggregate.  M. A. M. ABDEEN ET AL. 411 Table 1. Mix proportions for all studied concrete mixes. Concrete Constituent- kg/m3 (*) Mix No Water Cement Sand Vermiculite Gravel LECA Crushed Bricks Linen Fibers Remarks 1 200 400 560 ---- 1120 ---- ---- ---- 2 200 400 50 50 ---- 100 ---- ---- 3 200 400 30 70 ---- 100 ---- ---- 4 200 400 --- 100 ---- 100 ---- ---- 5 200 400 30 ---- ---- 100+70 ---- ---- LECA replaced both fine and coarse aggregates. (**) 6 200 400 --- 100 ---- 50 50 ---- 7 200 400 100 ---- ---- ---- 100 ---- 8 200 400 --- 100 ---- 100 ---- 0.4 9 200 400 30 70 ---- 100 ---- 0.4 10 200 400 30 ---- ---- 100+70 ---- 0.4 LECA replaced both fine and coarse aggregates. (**) (*) Only for Mix (1) and water, fibers, and cement content for all mixes. Replacement of aggregate is made by bulk volume and shown values (in the shaded cells are percentage of replacement from bulk volume used in Mix No. 1. (**) This replacement was made since LECA has 0.4-0.5 of its weight with particle size in the range 2.4-4.76 mm. Table 2. Physical and mechanical properties of different concrete mixes. Compressive Strength - kg/cm2 Impact Resistance (Blows) Mix No Slump mm Bulk Density (kg/L) 7-d 28-d Tensile Strength kg/cm2 E t/cm2 N1 N2(*) Remarks 1 200 2.41 200 268 25.5 191.6 216 ------ 2 30 1.74 61 71 14.9 33.7 986 ------ 3 68 1.46 100 122 17.0 54.1 350 ------ 4 100 1.34 116 130 18.1 32.4 506 ------ 5 50 1.34 102 118 14.9 54.6 640 ------ 6 15 1.90 108 122 22.9 56.2 259 ------ 7 40 2.25 211 238 19.1 98.3 549 ------ 8 35 1.55 63 95 12.7 52.7 543 903 9 45 1.51 66 102 16.0 150.5 653 854 10 25 1.44 93 104 22.3 126.4 857 1020 (*) Applicable only when fibers exist. One can see that the most light concrete mixes (4, 5) gives almost 50% of compressive strength of traditional concrete (Mix No. 1). The relationship between strength and density is known to be an inverse proportion. The plot of this relationship for the current study is shown in Figure 2. 5.4. Tensile Strength Splitting tensile strength tests were made on standard cylinders as shown in Figure 3. Results are shown in Table 2 for all mixes. One can see, from Table 2, the positive Effect of fibers on tensile strength. One can also see from Figure 4 that correlation between tensile and compressive strength differ for normal weight (Mixes 1 & 7) and light weight concretes (rest of mixes). Tensile strength represents higher percentage of compressive strength for light weight concrete. 0 50 100 150 200 250 300 0.00.51.01.52.02.53. Densitykg/l 28‐dCompressiveStrength‐ kg/cm2 0 E xperimental ANN Figure 2. Compressive strength vs. specific gravity for stud- ied concrete mixes. C opyright © 2010 SciRes. ENG  M. A. M. ABDEEN ET AL. Copyright © 2010 SciRes. ENG 412 Figure 3. Specimens loaded in splitting tension test. 0 50 100 150 200 250 300 0.010.0 20.0 30.0 40.0 50.0 S plittingTensileStrength‐kg/cm2 28‐dCompStrength‐kg/cm2 E xperiment ANN Figure 4. Compressive strength vs. splitting tensile strength. 5.5. Impact Strength Impact tests were made on concrete discs (150 × 100 mm) according to ACI [14]. Results of number of blows till first crack (N1) and number of blows till separation (N2) are shown in Table 2. It shall be mentioned that N2 can be measured only for fibrous concrete. It can be seen that light weight concrete (LWC) absorbs more energy than normal weight concrete. Part of this is attributed to the high deformability of LWC where the falling hammer caused a significant deformation in surface (Figure 5) which resulted in distribution of energy on larger area. This was not the case for normal weight concrete. Also, one can see the positive effect of adding fibers on impact resistance. 5.6. Stiffness (Modulus of Elasticity) The stiffness of concrete was measured via measuring se- cant modulus of elasticity (E) on standard cylinders ac- cording to ASTM [15]. Results are shown in Table 2 for all mixes. It can be seen that adding of fibers increases Figure 5. Impact tests on concrete from different mixes (top: mix-1, bot.: Mix-4). stiffness of LWC significantly. Also, the low value of E for LWC confirms the high deformability observed in impact test. Values of modulus of elasticity are plotted vs. Compressive strength in Figure 6. The dashed line re- presents the equation given in Egyptian code of practice (ECP 203/2007)). The ECP equation represents an upper bound to all data. However, deviation is quite large for LWC values. This implies that another relationship shall be used for concluding E from compressive strength in case of LWC. 5.7. Non Destructive Evaluation of Concrete A common evaluation of concrete structure is made via two methods: rebound hammer measurements and ultra- sonic pulse velocity measurements as in Malhotra [16], ACI [17] and ACI [18]. Usually, calibration curves are constructed to correlate the previous measurements with concrete compressive strength. The studied mixes were tested at 7 and 28 days to get the non-destructive meas- urements on standard specimens. Then specimens were loaded in compression to get their actual compressive 0 50 100 150 200 250 300 0.0E +005.0E +041.0E +051.5E +052.0E +052.5E +05 SecantModulusofEl a s ti c i ty ‐kg/cm2 28‐dCompStrength‐kg/cm2 Experimental ANN ECP Figure 6. Compressive strength vs. modulus of elasticity. 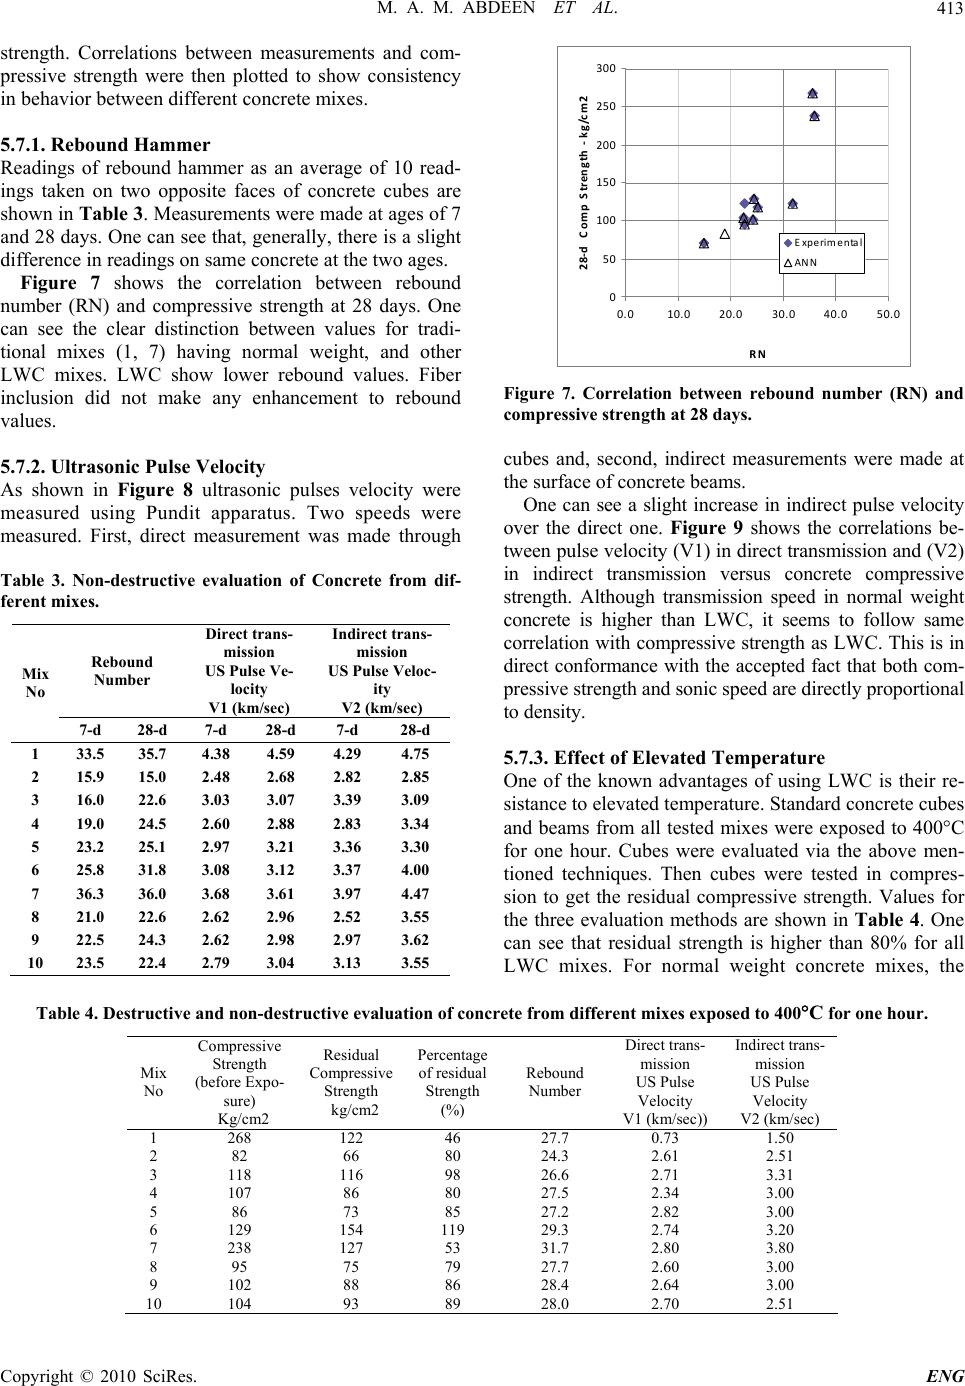 M. A. M. ABDEEN ET AL. Copyright © 2010 SciRes. ENG 413 strength. Correlations between measurements and com- pressive strength were then plotted to show consistency in behavior between different concrete mixes. 0 50 100 150 200 250 300 0.010.020.0 30.040.0 50.0 RN 28‐dCompStrength‐kg/cm2 E xperimental ANN 5.7.1. Rebound Hammer Readings of rebound hammer as an average of 10 read- ings taken on two opposite faces of concrete cubes are shown in Table 3. Measurements were made at ages of 7 and 28 days. One can see that, generally, there is a slight difference in readings on same concrete at the two ages. Figure 7 shows the correlation between rebound number (RN) and compressive strength at 28 days. One can see the clear distinction between values for tradi- tional mixes (1, 7) having normal weight, and other LWC mixes. LWC show lower rebound values. Fiber inclusion did not make any enhancement to rebound values. Figure 7. Correlation between rebound number (RN) and compressive strength at 28 days. cubes and, second, indirect measurements were made at the surface of concrete beams. 5.7.2. Ultrasonic Pulse Velocity As shown in Figure 8 ultrasonic pulses velocity were measured using Pundit apparatus. Two speeds were measured. First, direct measurement was made through One can see a slight increase in indirect pulse velocity over the direct one. Figure 9 shows the correlations be- tween pulse velocity (V1) in direct transmission and (V2) in indirect transmission versus concrete compressive strength. Although transmission speed in normal weight concrete is higher than LWC, it seems to follow same correlation with compressive strength as LWC. This is in direct conformance with the accepted fact that both com- pressive strength and sonic speed are directly proportional to density. Table 3. Non-destructive evaluation of Concrete from dif- ferent mixes. Rebound Number Direct trans- mission US Pulse Ve- locity V1 (km/sec) Indirect trans- mission US Pulse Veloc- ity V2 (km/sec) Mix No 7-d 28-d 7-d 28-d 7-d 28-d 1 33.5 35.7 4.38 4.59 4.29 4.75 2 15.9 15.0 2.48 2.68 2.82 2.85 3 16.0 22.6 3.03 3.07 3.39 3.09 4 19.0 24.5 2.60 2.88 2.83 3.34 5 23.2 25.1 2.97 3.21 3.36 3.30 6 25.8 31.8 3.08 3.12 3.37 4.00 7 36.3 36.0 3.68 3.61 3.97 4.47 8 21.0 22.6 2.62 2.96 2.52 3.55 9 22.5 24.3 2.62 2.98 2.97 3.62 10 23.5 22.4 2.79 3.04 3.13 3.55 5.7.3. Effect of Elevated Temperature One of the known advantages of using LWC is their re- sistance to elevated temperature. Standard concrete cubes and beams from all tested mixes were exposed to 400C for one hour. Cubes were evaluated via the above men- tioned techniques. Then cubes were tested in compres- sion to get the residual compressive strength. Values for the three evaluation methods are shown in Table 4. One can see that residual strength is higher than 80% for all LWC mixes. For normal weight concrete mixes, the Table 4. Destructive and non-destructive evaluation of concrete from different mixes exposed to 400C for one hour. Mix No Compressive Strength (before Expo- sure) Kg/cm2 Residual Compressive Strength kg/cm2 Percentage of residual Strength (%) Rebound Number Direct trans- mission US Pulse Velocity V1 (km/sec)) Indirect trans- mission US Pulse Velocity V2 (km/sec) 1 268 122 46 27.7 0.73 1.50 2 82 66 80 24.3 2.61 2.51 3 118 116 98 26.6 2.71 3.31 4 107 86 80 27.5 2.34 3.00 5 86 73 85 27.2 2.82 3.00 6 129 154 119 29.3 2.74 3.20 7 238 127 53 31.7 2.80 3.80 8 95 75 79 27.7 2.60 3.00 9 102 88 86 28.4 2.64 3.00 10 104 93 89 28.0 2.70 2.51 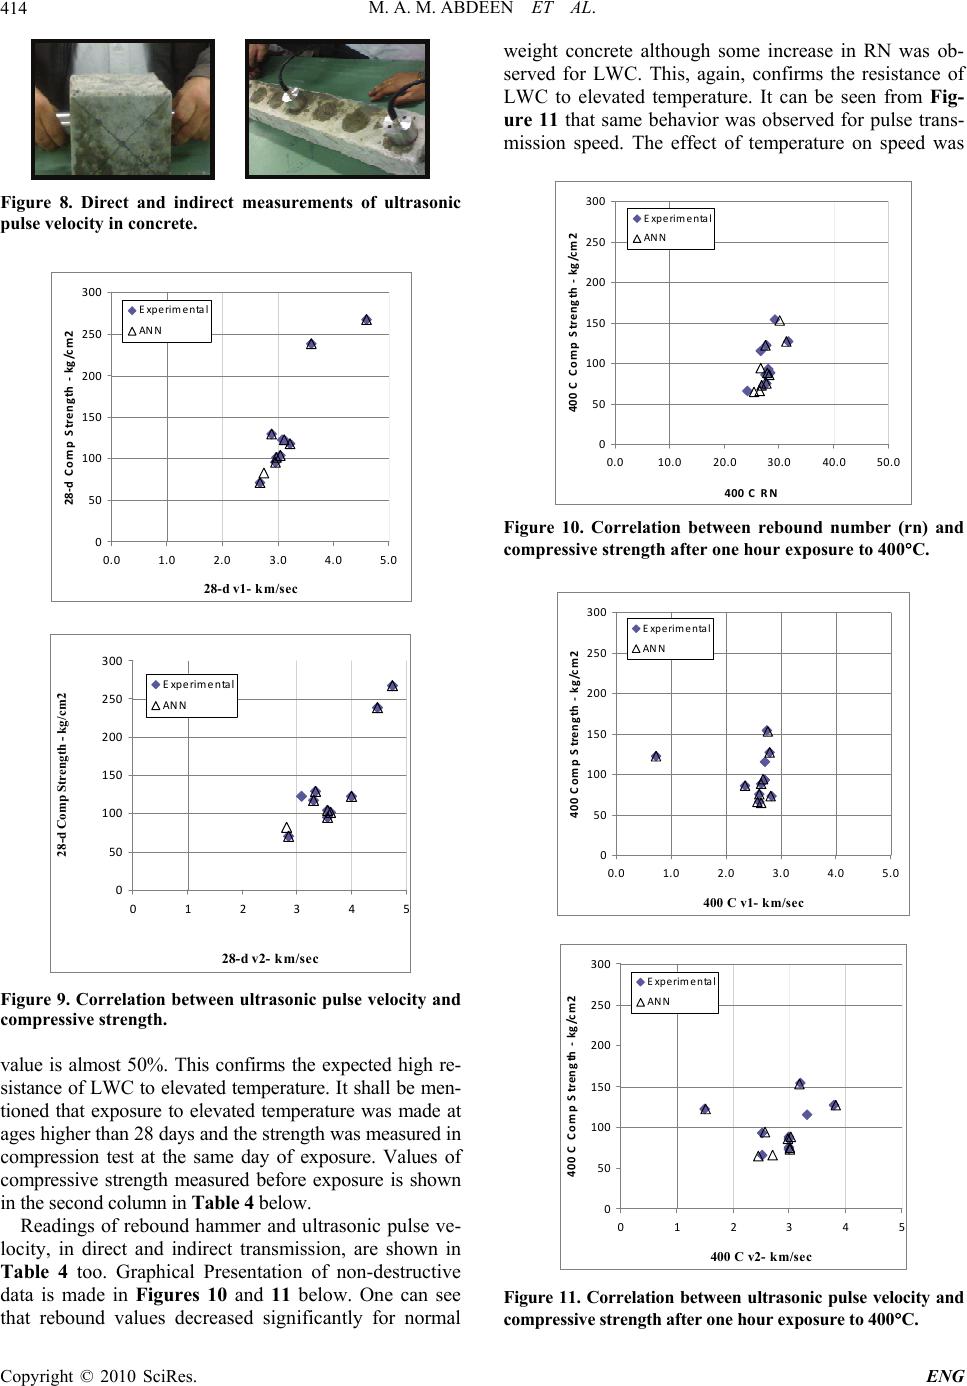 M. A. M. ABDEEN ET AL. 414 Figure 8. Direct and indirect measurements of ultrasonic pulse velocity in concrete. 0 50 100 150 200 250 300 0.0 1.0 2.03.0 4.05.0 28-d v1- km/sec 28‐dCompStrength‐kg/cm2 E xperimental AN N 0 50 100 150 200 250 300 01234 28-d v2- km/sec 28-d Comp Strength - kg/cm2 5 E xperimental ANN Figure 9. Correlation between ultrasonic pulse velocity and compressive strength. value is almost 50%. This confirms the expected high re- sistance of LWC to elevated temperature. It shall be men- tioned that exposure to elevated temperature was made at ages higher than 28 days and the strength was measured in compression test at the same day of exposure. Values of compressive strength measured before exposure is shown in the second column in Table 4 below. Readings of rebound hammer and ultrasonic pulse ve- locity, in direct and indirect transmission, are shown in Table 4 too. Graphical Presentation of non-destructive data is made in Figures 10 and 11 below. One can see that rebound values decreased significantly for normal weight concrete although some increase in RN was ob- served for LWC. This, again, confirms the resistance of LWC to elevated temperature. It can be seen from Fig- ure 11 that same behavior was observed for pulse trans- mission speed. The effect of temperature on speed was 0 50 100 150 200 250 300 0.010.020.0 30.040.0 50.0 400CRN 400CCompStrength‐kg/cm2 E xperimental ANN Figure 10. Correlation between rebound number (rn) and compressive strength after one hour exposure to 400C. 0 50 100 150 200 250 300 0.01.02.03.04.05.0 400 C v1- km/sec 400CompStrength‐ kg/cm2 Experimental ANN 0 50 100 150 200 250 300 012345 400 C v2- km/sec 400CCompStrength‐kg/cm 2 E xperimental AN N Figure 11. Correlation between ultrasonic pulse velocity and compressive strength after one hour exposure to 400C. C opyright © 2010 SciRes. ENG  M. A. M. ABDEEN ET AL.415 higher for indirect transmission since it reflects the in- tegrity of concrete surface that is most affected by expo- sure. 6. Numerical Model Structure Neural networks are models of biological neural struc- tures. Abdeen [8] described in a very detailed fashion the structure of any neural network. Briefly, the starting point for most networks is a model neuron as shown in Figure 12. This neuron is connected to multiple inputs and produces a single output. Each input is modified by a weighting value (w). The neuron will combine these weighted inputs with reference to a threshold value and an activation function, will determine its output. This behavior follows closely the real neurons work of the human’s brain. In the network structure, the input layer is considered a distributor of the signals from the external world while hidden layers are considered to be feature detectors of such signals. On the other hand, the output layer is considered as a collector of the features detected and the producer of the response. 6.1. Neural Network Operation It is quite important for the reader to understand how the neural network operates to simulate different physical problems. The output of each neuron is a function of its inputs (Xi). In more details, the output (Yj) of the jth neu- ron in any layer is described by two sets of equations as follows: j iij UXw (1) and jthjj YFUt (2) For every neuron, j, in a layer, each of the i inputs, Xi, to that layer is multiplied by a previously established weight, wij. These are all summed together, resulting in the internal value of this operation, Uj. This value is then Figure 12. Typical picture of a model neuron that exists in every neural network. biased by a previously established threshold value, tj, and sent through an activation function, Fth. This activation function can take several forms such as Step, Linear, Sigmoid, Hyperbolic, and Gaussian functions. The Hy- perbolic function, used in this study, is shaped exactly as the Sigmoid one with the same mathematical representa- tion, as in Equation (3), but it ranges from –1 to +1 rather than from 0 to 1 as in the Sigmoid one (Figure 13) 1 1 x fx e (3) The resulting output, Yj, is an input to the next layer or it is a response of the neural network if it is the last layer. In applying the Neural Network technique, in this study, Neuralyst Software, Shin [19], was used. 6.2. Neural Network Training The next step in neural network procedure is the training operation. The main purpose of this operation is to tune up the network to what it should produce as a response. From the difference between the desired response and the actual response, the error is determined and a portion of it is back propagated through the network. At each neuron in the network, the error is used to adjust the weights and the threshold value of this neuron. Conse- quently, the error in the network will be less for the same inputs at the next iteration. This corrective procedure is applied continuously and repetitively for each set of in- puts and corresponding set of outputs. This procedure will decrease the individual or total error in the responses to reach a desired tolerance. Once the network reduces the total error to the satis- factory limit, the training process may stop. The error propagation in the network starts at the output layer with the following equations: ' ijijj i wwLReX (4) and, 1 jj jjj eY YdY (5) where, wij is the corrected weight, w’ ij is the previous Figure 13. The sigmoid activation function. Copyright © 2010 SciRes. ENG  M. A. M. ABDEEN ET AL. Copyright © 2010 SciRes. ENG 416 weight value, LR is the learning rate, ej is the error term, Xi is the ith input value, Yj is the ouput, and dj is the de- sired output. 7. Simulation Cases To fully investigate numerically the physical and me- chanical properties of concrete with different aggregate materials (crushed fired brick, vermiculite and LECA), several simulation cases are considered in this study. These simulation cases can be divided into two groups. The first group simulates the effect of aggregate type on the performance of concrete: density, compressive, ten- sile, modulus of elasticity, rebound hammer reading and ultrasonic pulse velocities. The second group simulates the effect of elevated temperature on the performance of concrete with different aggregate materials: compressive strength, rebound hammer reading and ultra sonic pulse velocities. 7.1. Neural Network Design To develop a neural network model to simulate the effect of aggregate type on the performance of concrete, first input and output variables have to be determined. Input variables are chosen according to the nature of the prob- lem and the type of data that would be collected in the field. To clearly specify the key input variables for each neural network simulation groups and their associated outputs, Table 5 is designed to summarize all neural network key input variables and output for the first simu- lation group, while Tables 6(a) and 6(b) are designed to summarize the key input and output variables for the se- cond simulation group respectively. It can be noticed from Table 5 that the first simulation group consists of seven simulation cases (seven neural network models) to study the effect of aggregate type on the density, compressive strength, tensile strength, mo- dulus of elasticity, rebound hammer reading and ultra- sonic pulse velocities. Tables 6(a) and 6(b), for the sec- ond simulation group, consists of one neural network model, multi-input and multi-output model, for the case of elevated temperature to 400℃ to study the effect of aggregate type on the compressive strength, rebound ha- mmer reading and ultrasonic pulse velocities. Several neural network architectures are designed and tested for all simulation cases investigated in this study to finally determine the best network models to simulate, very accurately, the effect of aggregate type as well as elevated temperature on the performance of concrete based on minimizing the Root Mean Square Error (RMS- Error). Figure 14 shows a schematic diagram for a ge- neric neural network. The training procedure for the de- veloped ANN models, in the current study, uses the data of 9 mixes (1, 2, 4, 5, 6, 7, 8, 9, 10) out of 10 available mixes, and the mix data number 3 is used to test the power of prediction of the neural network models. Here, it is very important to mention that the available data are very limited (one group of results for every mix) and the experimental results are changing significantly with the change of aggregate type. Table 7 shows the final neural network models for the two simulation groups and their associate number of neurons. The input and output layers represent the key input and output variables described previously for each simulation case. The parameters of the various network models devel- oped in the current study for the different simulation cases are presented in Table 8, where: (Comp. St.) de- notes for compressive strength, (Ten. St.) for tensile using secant modulus of elasticity and (Rn) for rebound number. These parameters can be described with their Table 5. Key input variables and output for the first neural network simulation group. Simulation Case Input Variables Output Density Density Compressive Strength 28-days Comp. Strength Tensile Strength Tensile Strength Stiffness Modulus of Elasticity Rebound Hammer reading Rebound Number 28-days Direct Trans- mission US Velocity Velocity V1- 28-days Indirect Transmission US Velocity Water Cement SandGravelVermiculiteLECA Bricks Fibers Velocity V2- 28-days  M. A. M. ABDEEN ET AL.417 Table 6. (a) Key input variables for the second neural network simulation group; (b) Key output variables for the second neural network simulation group. Simulation Case Input Variables Effect of Elevated Tem- perature to 400oC Water Cement Sand Gravel Vermiculite LECA Bricks Fibers Simulation Case Output Variables Effect of Elevated Tem- perature to 400oC Compressive Strength Kg/cm2 Rebound Number (Rn) Ultrasonic Velocity - V1 (Km/sec) Ultrasonic Velocity – V2 (Km/sec) Input # 1 Input # 2 Hidden layer 3 neurons Hidden layer 3 neurons Output # 1 Output # 2 Figure 14. General schematic diagram of a simple generic neural network. Table 7. The developed neural network models for all the simulation cases. No. of Neurons in each Layer Simulation Group No. of Layers Input Layer First Hidden Second Hidden Third Hidden Fourth Hidden Output Layer First Group 6 8 6 5 4 3 1 Second Group (Elevated Tem- perature) 6 8 6 5 4 3 4 tasks as follows: Learning Rate (LR): determines the magnitude of the correction term applied to adjust each neuron’s weights during training process = 1 in the current study. Momentum (M): determines the “life time” of a cor- rection term as the training process takes place = 0.9 in the current study. Training Tolerance (TRT): defines the percentage error allowed in comparing the neural network output to the target value to be scored as “Right” during the training process. Testing Tolerance (TST): it is similar to Training Tolerance, but it is applied to the neural network out- puts and the target values only for the test data. Input Noise (IN): provides a slight random variation to each input value for every training epoch = 0 in the current study. Function Gain (FG): allows a change in the scaling or width of the selected function = 1 in the current study. Scaling Margin (SM): adds additional headroom, as a percentage of range, to the rescaling computations used by Neuralyst Software, Shin (1994), in preparing data for the neural network or interpreting data from the neural network = 0.1 in the current study. Raining Epochs: number of trails to achieve the pre- sent accuracy. Percentage Relative Error (PRR): percentage rela- tive error between the numerical results and actual measured value for and is computed according to Equa- tion (6) as follows: PRE = (Absolute Value (ANN_PR – AMV)/AMV) × 100 (6) where: Copyright © 2010 SciRes. ENG  M. A. M. ABDEEN ET AL. 418 Table 8. Parameters used in the developed neural network models. Simulation Case Density Comp. St. Ten. St. Stiff. (E) Rn V1 V2 Elevated Temp. TRT 0.001 0.0001 0.0001 0.001 0.0001 0.0001 0.0001 0.01 TST 0.003 0.0003 0.0003 0.003 0.0003 0.0003 0.0003 0.03 Training Epochs 4667 9165 8094 29872 15688 13739 9512 579123 MPRE 0.15 0.03 0.02 0.6 0.02 0.02 0.01 5.0 RMS-Error 0.0006 0.0 0.0001 0.0004 0.0001 0.0001 0.0 0.012 ANN_PR: Predicted results using the developed ANN model. AMV: Actual measured value. MPRE: Maximum percentage relative error during the model results for the training step. 8. Results and Discussions Numerical results using ANN technique are plotted with the experimental results for the first neural network si- mulation group (density, tensile strength, modulus of ela- sticity, rebound hammer reading and ultrasonic pulse ve- locities) versus 28-days compressive strength as shown in Figures 2, 4, 6, 7 and 9, respectively. It can be noticed from these figures that ANN technique can accurately simulate the effect of aggregate type on the performance of concrete. To study the effect of elevated temperature as well as aggregate type on the performance of concrete (com- pressive strength, rebound hammer reading and ultra- sonic pulse velocities), numerically, the second neural network simulation group are prepared as shown in Ta- bles 6(a) and 6(b). The results of this group are plotted with the experimental results in Figures 10 and 11 for 400℃. One can see from these figures (which, also, are drawn between the property and 28-days compressive strength) that ANN technique can accurately simulate the effect of elevated temperature and aggregate type on the performance of concrete. To check the accuracy of neural network the term PRE is calculated as in Equation (6) for each data point in each model. Then the Max PRE is calculated through each model and reported in Table 8. It is very clear from the row of Max PRE that this value doesn’t exceed 0.6% for the simulation cases in the first group and for the second group (elevated temperature) this value reaches 5% because this group is multi input-multi output model and the available data is very limited. To check the power of the developed models in the prediction technique, the training step is made using the experimental results of 9 mixes out of the 10 available mixes and date of mix No. 3 is kept for the prediction comparison. It is very clear from the Figures 2, 4, 6, 7, 9, 10 and 11 and the value of MPRE that the models are very efficient in simulating the effect of aggregate type as well as elevated temperature on the performance of concrete for the 9 mixes of the training step and for the prediction one the numerical results are quite difference from the experimental results specially for compressive strength. That difference in the compressive strength can be understood for two reasons: first, because of the lim- ited number of data (one result group for each mix) as it is mentioned before in a previous section and second, the compressive strength is highly affected by changing the type of aggregate so it needs a lot of data to be simulated. On the other hand, the numerical results for density, ten- sile strength, rebound number and ultrasonic pulse ve- locities are very close to the experimental one which confirms the power of the current developed ANN model in the prediction technique. 9. Conclusions Through the course of this study, ten concrete mixes of normal and light weight concrete were evaluated. LWC was produced using local processed and recycled aggre- gates in Egypt. Results showed the potential of the local aggregate to achieve weight reduction of about 40%. However, a corresponding reduction in strength was in- evitable. Similar reduction in stiffness was observed too. However, it could be compensated for by applying fiber reinforcement. The application of LWC appeared to be promising in increasing impact and elevated temperature. The results of implementing the ANN technique in this study showed that this approach was capable of iden- tifying relationship between different uncertain parame- ters with multiple input/output criterions. The ANN pre- sented in this study was very successful in simulating and predicting the effect of aggregate type and elevated temperature on the performance of concrete. 10. Acknowledgements The Authors would like to express their gratitude to- wards Prof. Dr. Farouk El-Hakim of 15th May institute for Civil and Arch. Engineering, and undergraduate stu- dents (4th year– civil) for the help they provided during the experimental part of this research. 1 1. References [1] V. J. Ramachandran, et al., “Concrete Science,” Heyden & Sons Ltd., London, 1981. C opyright © 2010 SciRes. ENG  M. A. M. ABDEEN ET AL.419 [2] ACI 211-2-91, “Standard Practice for Selecting Propor- tions of Structural Light Weight Concrete,” American Concrete Institute, Michigan, 1991. [3] ACI 330-91, “Specifications for Lightweight Aggregate for Structural Concrete,” American Concrete Institute, Michigan, 1991. [4] ACI 213-03, “Guide for Structural Light Weight Con- crete,” American Concrete Institute, Michigan, 2003. [5] A. M. Neville, “Properties of Concrete,” John Wiley & Sons Ltd., London, 1997. [6] K. Ramanitharan and C. Li, “Forecasting Ocean Waves Using Neural Networks,” Proceeding of the Second International Conference on Hydroinformatics, Zurich, 1996. [7] M. Tawfik, A. Ibrahim and H. Fahmy, “Hysteresis Sensi- tive Neural Network for Modeling Rating Curves,” Jour- nal of Computing in Civil Engineering, ASCE, Vol. 11, No. 3, 1997, pp. 184-189. [8] M. A. M. Abdeen, “Neural Network Model for Predicting Flow Characteristics in Irregular Open Channel,” Scien- tific Journal, Faculty of Engineering-Alexandria Univer- sity, Alexandria, Vol. 40, No. 4, 2001, pp. 539-546. [9] B. S. M. Allam, “Artificial Intelligence Based Predictions of Precautionary Measures for Building Adjacent to Tun- nel Rout during Tunneling Process,” Ph. D. Dissertation, Faculty of Engineering, Cairo University, Giza, 2005. [10] H. M. Azmathullah, M. C. Deo and P. B. Deolalikar, “Neural Networks for Estimation of Scour Downstream of a Ski-Jump Bucket,” Journal of Hydrologic Engineer- ing, ASCE, Vol. 131, No. 10, 2005, pp. 898-908. [11] M. A. M. Abdeen, “Development of Artificial Neural Network Model for Simulating the Flow Behavior in Open Channel Infested by Submerged Aquatic Weeds,” Journal of Mechanical Science and Technology, KSME International Journal, Soul, Vol. 20, No. 10, 2006, pp. 1527-1782. [12] M. A. M. Mohamed, “Selection of Optimum Lateral Load-Resisting System Using Artificial Neural Net- works,” M. Sc. Thesis, Faculty of Engineering, Cairo University, Giza, 2006. [13] M. A. M. Abdeen, “Predicting the Impact of Vegetations in Open Channels with Different Distributaries’ Opera- tions on Water Surface Profile using Artificial Neural Networks,” Journal of Mechanical Science and Technol- ogy, KSME International Journal, Soul, Vol. 22, No. 9, 2008, pp. 1830-1842. [14] ACI 544.2R-99, “Measurement of Properties of Fiber Reinforced Concrete,” American Concrete Institute, Mi- chigan, 1999. [15] ASTM C0469-02E01, “Test Method for Static Modulus of Elasticity and Poisson’s Ratio of Concrete in Com- pression,” 2001. [16] V. M. Malhotra, “Testing Hardened Concrete: Nonde- structive Methods,” ACI Monograph No. 9, American Concrete Institute, Michigan, 1986. [17] ACI 228.1 R89, “In-Place Methods for Determination of Strength of Concrete,” American Concrete Institute, Mi- chigan, 1989. [18] ACI 437 R91, “Strength Evaluation of Existing Concrete Buildings,” American Concrete Institute, Michigan, 1991. [19] Y. Shin, “NeuralystTM User’s Guide, Neural Network Technology for Microsoft Excel,” Cheshire Engineering Corporation Publisher, California, 1994. Copyright © 2010 SciRes. ENG |