 Atmospheric and Climate Sciences, 2012, 2, 307-321 http://dx.doi.org/10.4236/acs.2012.23028 Published Online July 2012 (http://www.SciRP.org/journal/acs) Variability of Wintertime Su rface Air Temperature over the Kingdom of Saudi Arabia Hosny Mohamed Hasanean, Abdel Rahman Khalaf Al-Khalaf Department of Meteorology, Faculty of Meteorology, Environment, and Arid Land Agriculture, King Abdulaziz University, Jeddah, KSA Email: h_eg2001@yahoo.com, hasanean@operamail.com Received January 22, 2012; revised March 17, 2012; accepted April 17, 2012 ABSTRACT Variability of wintertime surface air temperature (SAT) in the Kingdom of Saudi Arabia (KSA) is studied. The study is based on time series over thirty one years in length (1978-2008). For the analysis, we use the coefficient of variability (COV) Mann-Kendal statistical test, running mean and cumulative annual mean (CAM). The coefficient of variability (COV) for wintertime SAT decreases gradually from the north to the south of KSA. The higher values for COV occur in northern and northeastern KSA; there are du e to the effec t of the trave ling Mediterranean depressions and their inter- action with the inverted-V shape trough of the Sudan low. The relationship between COV and latitude is highly signifi- cant, while with longitude it is not significant. The Mann-Kendal statistical test illustrates that positive trends (warming) in wintertime SAT series occurs over the all stations, and that the trends are significant at middle and southern regions of KSA. Recent warming has only occurred during the last two decades at most stations. While cooling in the winter- time SAT appears for the short period of about 5 years, 1978-1983 and 1988-1992. These trends are consistence with trends in the global mean SAT. The results obtained from CAW lead to the conclusion that the thermic regime is modi- fying in the KSA. This dramatic enhancement, occurred at the beginning of the year 1993, is reflected in net modifica- tion in the SAT time series. The analysis of the SAT also shows a significant warming trend after the year 1997 with a rate of 0.03˚C/year. Keywords: Winter Temperature; Saudi Arabia; Coefficient of Variability; Trends; Cumulative Annual Mean 1. Introduction Changes in climatic variability continue to be major global issues, not only for the present generation, but also for future generations. One aspect of climate change is change in variability of weather elements, such as SAT. The SAT database has been extensively reviewed on several earlier occasions, most notably by [1-3]. Recently many researchers [4-8] have investigated the trends of climate variables and the characteristics of the climate change. Adaptation to climate change and efforts to mitigate the impacts of climate change need to empha- size not only changes in long-term mean weather attrib- utes, but also trends in the variability of climatic pa- rameters [9]. Given that climatic conditions evidently vary from one period to another, variability is an integral part of climate change. Consequently, response strategies and adaptations to climatic change, both at the regional and global levels, must address climatic variability. [6] has recently concluded that global warming is unequivo- cal. Observed to occur concurrently are changes in the regional climate in different parts of the world. The trends of regional temperature variations are important aspects of the baseline against which the po tential effects of climate change should be assessed [6]. On a global scale, climatologically studies indicate an increase of 0.3˚C - 0.6˚C of the surface air temperature (0.5˚C - 0.7˚C for the Northern Hemisphere) since 1865 [10]. Climate scientists have concluded that: 1) The earth’s surface air temperature increased by about 0.6˚C dur- ing the 20th century; and 2) The temperature augmenta- tion was highest during the 1990s (Jones, et al., 1999). The study of [11] indicates that there a gradual warming until about 1940, cooling (1940-1970) and a second warming trend begins about 1970 in land surface air temperature. They pointed out that the recent 1976-2000 warming was larg ely globally synchronous but was more pronounced in the Northern Hemisphere continents dur- ing winter and spring. Wintertime surface air temperature is an issue of great concern, as its variability and spe- cially extreme events have important economical and social implications. The successive periods of global warming, cooling and warming in the 20th century show distinctive patterns of temperature change suggestive of C opyright © 2012 SciRes. ACS  H. M. HASANEAN, A. R. K. AL-KHALAF 308 roles for both climate forcing and dynamical variability [12]. In the Arabian Peninsula, investigations of long- term variations and trends in temperature data are not receiving enough attention even though, these countries suffer serious environmental, agricultural and water re- sources problems. In this work, the behavior of wintertime SAT over KSA since 1978 is examined with regard to persistence, non-linear trends and inter-annual and inter-decadal variations. Observation dataset and its homogeneity are described in Sections 2 and 3 respectively. Section 4 de- scribes the methods that used, while Section 5 contains the results together with a discussion and studying the wintertime SAT changes and variability over KSA. Fi- nally conclusions are drawn in Section 6. 2. Homogeneity Lack of homogeneity in data series creates a big problem for studying time series. The time series of a clima- tological variable can only be said to be homogenous where the variability is caused by variations in weather and climate [13]. However, long time series without arti- ficial changes in their statistical characteristics are rare [14]. Non-homogeneities may be caused by relocations of instruments or changes of instruments, observers and observation practices, etc. Slow changes of the sur- roundings of the observation site may gradually cause non-homogeneities, e.g. the case of urbanization. The timing and size of significant non-homogeneities can be estimated with statistical tests. The au thors here used the short-cut Bartlett test [15] to examine the homogeneity of the surface air temperature series at designated stations. The short-cut Bartlett test of homogeneity of variance for winter air temperature is applied by dividing the series into equal sub-periods, where . In each of these sub-periods the sample variance is calculated thus; k2k 2 11 kii Sxx nn nk 2 S2 mi S2 k S . Where the summations range over the values of the series in the sub-period . Let max and n denote the maximum and the minimum values of , respectively. The 95% significance points ratio 22 SS maxmin can be obtained by comparing this ratio with the values given in Biometrika Table 31 [16]. All time series used are fo und to be homog enous as show n in Table 1. Table 1. Bartlet test (short-cut) result for the KSA stations (n is the number of terms in each sub-period k, and k is the num- ber of the sub-period). Station Period n k 95% Significance point Homogeneity Turaif 31 15 3 5.34 1.53 Guriat 24 12 2 3.50 1.06 Arar 31 15 3 5.34 1.50 Al-Jouf 31 15 3 5.34 1.46 Rafha 31 15 3 5.34 1.48 Tabouk 31 15 3 5.34 1.55 Al-Qaysumah 31 15 3 5.34 1.45 Hail 31 15 3 5.34 1.54 Gassim 31 15 3 5.34 1.52 Dhahran 31 15 3 5.34 1.56 Wejh 31 15 3 5.34 1.60 Al-Ahsa 24 12 2 3.50 1.26 Riyadh 31 15 3 5.34 1.56 Madina 31 15 3 5.34 1.68 Yanbo 31 15 3 5.34 1.66 Jeddah 31 15 3 5.34 1.61 Taif 24 12 2 3.50 1.08 Makkah 24 12 2 3.50 1.21 AL-Baha 24 12 2 3.50 1.27 Bisha 31 15 3 5.34 1.39 Khamis Mushait 31 15 3 5.34 1.57 Abha 31 15 3 5.34 1.58 Najran 31 15 3 5.34 1.38 Sharurah 24 12 2 3.50 1.32 Gizan 31 15 3 5.34 1.48 Copyright © 2012 SciRes. ACS  H. M. HASANEAN, A. R. K. AL-KHALAF 309 3. Data Monthly mean SAT data for the twenty five stations were obtained from the Presidency of Meteorology and Environment in KSA (Table 2 and Figure 1). Twenty five (25) stations cover all regions over the KSA. The selection of these stations is based on the quality and length of their recor ds. The beginning and en d of all ti me series are the years 1978 and 2008, respectively except Al-Ahsa, Al-Baha, Guriat, Makkah, and Shrurah station started in 1985 (Table 2). From the monthly SAT values, the wintertime series were calculated for each year by averaging the values SAT of the months December, January, and February. The stations under study are dis- tributed all over KSA, although their spatial density is low and uneven over some parts of the country. Tem- perature varies over space and time and this highlights the existence of large diversities of temperature over KSA. Besides spatial differences, inter-annual variations of temperature are also occurring. The complex structure of the temperature over KSA derives from the vast area of th e countr y (about, 2,250,000 km2), its wide latitudinal extent (15.5˚N - 32.5˚N) and its pronounced relief. 4. Methodology A coefficient of variation for each individual station has been determined as follows: (COV) Table 2. KSA stations location and record. No Name Latitude (˚N) Longitude (˚E) Elevation (m) Data period Years 1 Turaif 31.68 38.73 852 1978-2008 31 2 Gurait 31.40 37.28 504 1985-2008 24 3 Arar 30.90 41.14 550 1978-2008 31 4 Al-Jouf 29.78 40.98 670 1978-2008 31 5 Rafha 29.62 43.49 445 1978-2008 31 6 Tabouk 28.37 36.60 770 1978-2008 31 7 Al-Qaysumah 28.31 46.13 360 1978-2008 31 8 Hail 27.43 41.69 1000 1978-2008 31 9 Gassim 26.30 43.76 648 1978-2008 31 10 Dhahran 26.25 50.16 22 1978-2008 31 11 Wejh 26.20 38.47 20 1978-2008 31 12 Al-Ahsa 25.29 49.48 180 1985-2008 24 13 Riyadh 24.92 46.72 610 1978-2008 31 14 Madina 24.54 39.69 630 1978-2008 31 15 Yenbo 24.14 38.06 8 1978-2008 31 16 Jeddah 21.71 39.18 18 1978-2008 31 17 Taif 21.48 40.55 1455 1978-2008 24 18 Makkah 21.43 39.79 273 1985-2008 24 19 Al-Baha 20.29 41.64 1655 1985-2008 24 20 Bisha 19.99 42.61 1167 1985-2008 31 21 Khamis Mushait 18.29 42.80 2047 1978-2008 31 22 Abha 18.23 42.66 2100 1978-2008 31 23 Najran 17.61 44.41 1213 1978-2008 31 24 Sharurah 17.46 47.10 727 1985-2008 24 25 Gizan 16.90 42.58 4 1978-2008 31 Copyright © 2012 SciRes. ACS 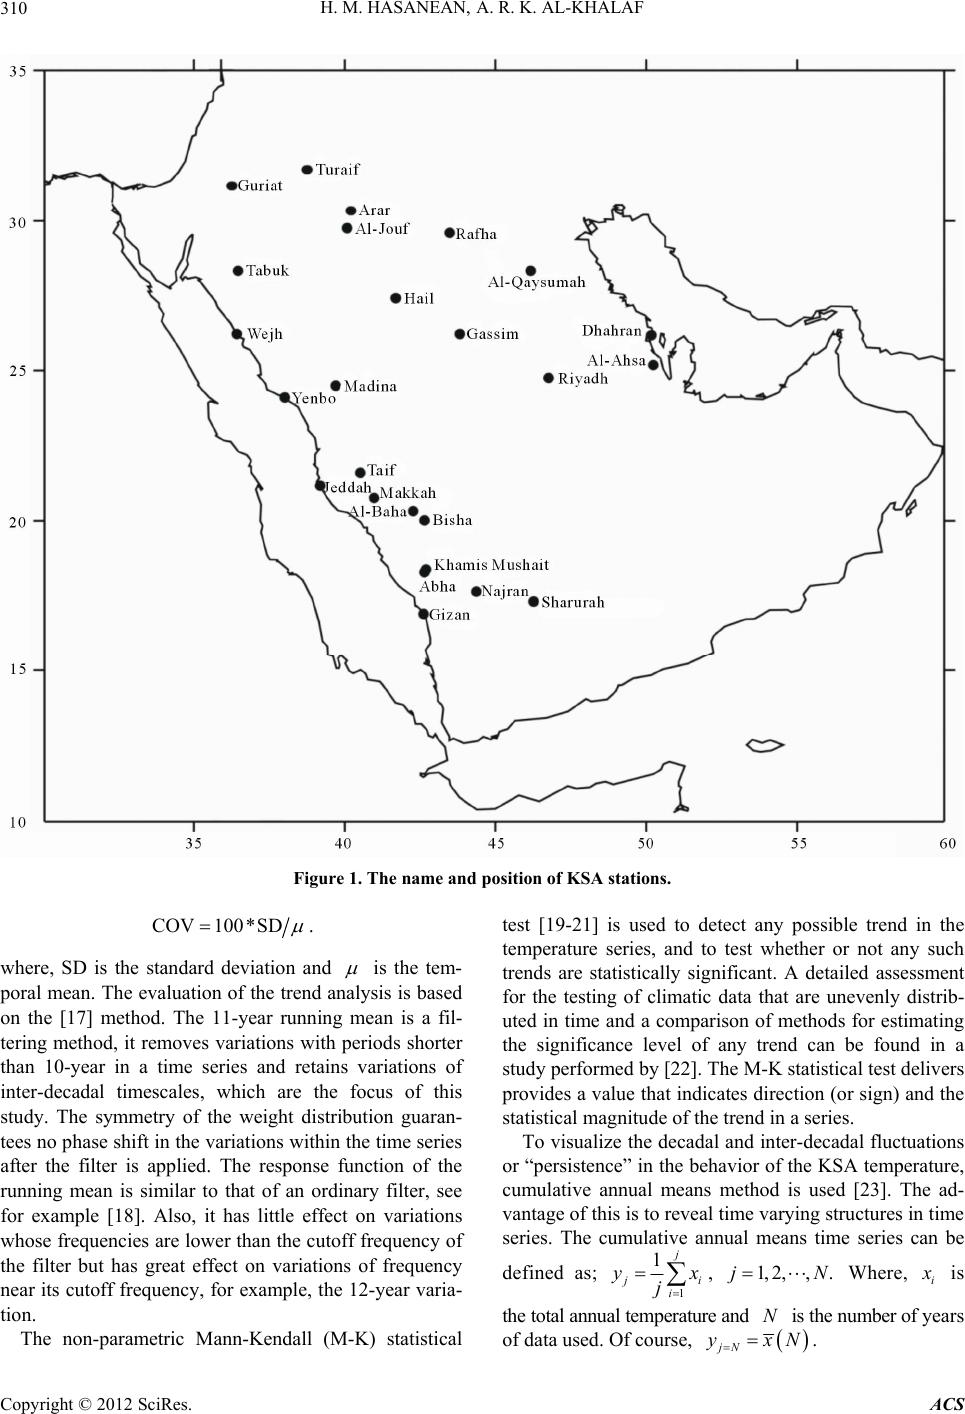 H. M. HASANEAN, A. R. K. AL-KHALAF 310 Figure 1. The name and position of KSA stations. COV 100*SD . where, SD is the standard deviation and is the tem- poral mean. The evaluation of the trend analysis is based on the [17] method. The 11-year running mean is a fil- tering method, it removes variations with periods shorter than 10-year in a time series and retains variations of inter-decadal timescales, which are the focus of this study. The symmetry of the weight distribution guaran- tees no phase shift in the variations within the time series after the filter is applied. The response function of the running mean is similar to that of an ordinary filter, see for example [18]. Also, it has little effect on variations whose frequencies are lower than the cutoff frequency of the filter but has great effect on variations of frequency near its cutoff frequency, for example, the 12-year varia- tion. The non-parametric Mann-Kendall (M-K) statistical test [19-21] is used to detect any possible trend in the temperature series, and to test whether or not any such trends are statistically significant. A detailed assessment for the testing of climatic data that are unevenly distrib- uted in time and a comparison of methods for estimating the significance level of any trend can be found in a study performed by [22]. The M-K statistical test delivers provides a value that indicates direction (or sign) and the statistical magnitud e of the trend in a series. To visualize the decadal and inter-decadal fluctuations or “persistence” in the behavior of the KSA temperature, cumulative annual means method is used [23]. The ad- vantage of this is to reveal time varying structures in time series. The cumulative annual means time series can be defined as; 1 1 i i x j , Where, 1, 2,,.jN i is the total annua l temp er a ture and is the number of ye ars of data used. Of course, N jN xN . Copyright © 2012 SciRes. ACS 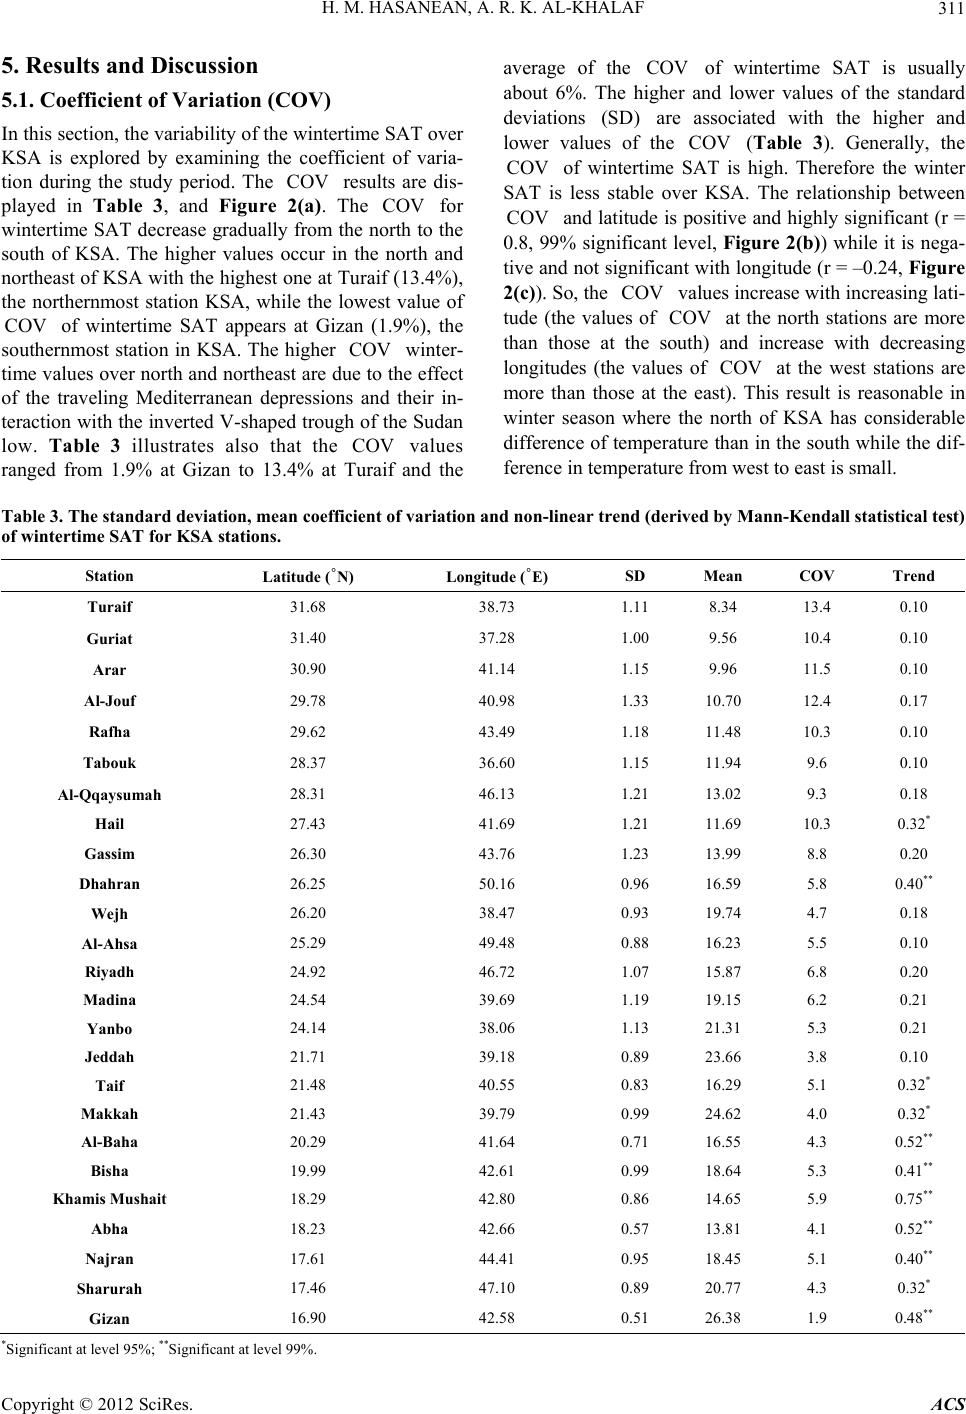 H. M. HASANEAN, A. R. K. AL-KHALAF 311 5. Results and Discussion 5.1. Coefficient of Variation (COV) In this section, the variability of the wintertime SAT over KSA is explored by examining the coefficient of varia- tion during the study period. The results are dis- played in Table 3, and Figure 2(a). The for wintertime SAT decrease gradually from the north to the south of KSA. The higher values occur in the north and northeast of KSA with the highest one at Turaif (13.4%), the northernmost station KSA, while the lowest value of of wintertime SAT appears at Gizan (1.9%), the southernmost station in KSA. The higher winter- time values over north and northeast are due to the effect of the traveling Mediterranean depressions and their in- teraction with the inverted V-shaped trough of th e Sudan low. Table 3 illustrates also that the values ranged from 1.9% at Gizan to 13.4% at Turaif and the COV COV COV COV COV COV (SD) COV COV COV COVCOV COV average of the of wintertime SAT is usually about 6%. The higher and lower values of the standard deviations are associated with the higher and lower values of the (Table 3). Generally, the of wintertime SAT is high. Therefore the winter SAT is less stable over KSA. The relationship between and latitude is positive and highly sign ificant (r = 0.8, 99% significant level, Figure 2(b)) while it is nega- tive and not significant with longitude (r = –0.24, Figure 2(c)). So, the values increase with increasin g lati- tude (the values of at the north stations are more than those at the south) and increase with decreasing longitudes (the values of at the west stations are more than those at the east). This result is reasonable in winter season where the north of KSA has considerable difference of temperature than in the south while the dif- ference in temperature from west to east is small. Table 3. The standard deviation, mean coe ffic ient of variation and non-line ar trend (de ri ve d by M ann-Ke ndall statistic a l test) of wintertime SAT for KSA stations. Station Latitude (˚N) Longitude (˚E) SD Mean COV Trend Turaif 31.68 38.73 1.11 8.34 13.4 0.10 Guriat 31.40 37.28 1.00 9.56 10.4 0.10 Arar 30.90 41.14 1.15 9.96 11.5 0.10 Al-Jouf 29.78 40.98 1.33 10.70 12.4 0.17 Rafha 29.62 43.49 1.18 11.48 10.3 0.10 Tabouk 28.37 36.60 1.15 11.94 9.6 0.10 Al-Qqaysumah 28.31 46.13 1.21 13.02 9.3 0.18 Hail 27.43 41.69 1.21 11.69 10.3 0.32* Gassim 26.30 43.76 1.23 13.99 8.8 0.20 Dhahran 26.25 50.16 0.96 16.59 5.8 0.40** Wejh 26.20 38.47 0.93 19.74 4.7 0.18 Al-Ahsa 25.29 49.48 0.88 16.23 5.5 0.10 Riyadh 24.92 46.72 1.07 15.87 6.8 0.20 Madina 24.54 39.69 1.19 19.15 6.2 0.21 Yanbo 24.14 38.06 1.13 21.31 5.3 0.21 Jeddah 21.71 39.18 0.89 23.66 3.8 0.10 Taif 21.48 40.55 0.83 16.29 5.1 0.32* Makkah 21.43 39.79 0.99 24.62 4.0 0.32* Al-Baha 20.29 41.64 0.71 16.55 4.3 0.52** Bisha 19.99 42.61 0.99 18.64 5.3 0.41** Khamis Mushait 18.29 42.80 0.86 14.65 5.9 0.75** Abha 18.23 42.66 0.57 13.81 4.1 0.52** Najran 17.61 44.41 0.95 18.45 5.1 0.40** Sharurah 17.46 47.10 0.89 20.77 4.3 0.32* Gizan 16.90 42.58 0.51 26.38 1.9 0.48** *Significant at level 95%; **Significant at level 99%. Copyright © 2012 SciRes. ACS 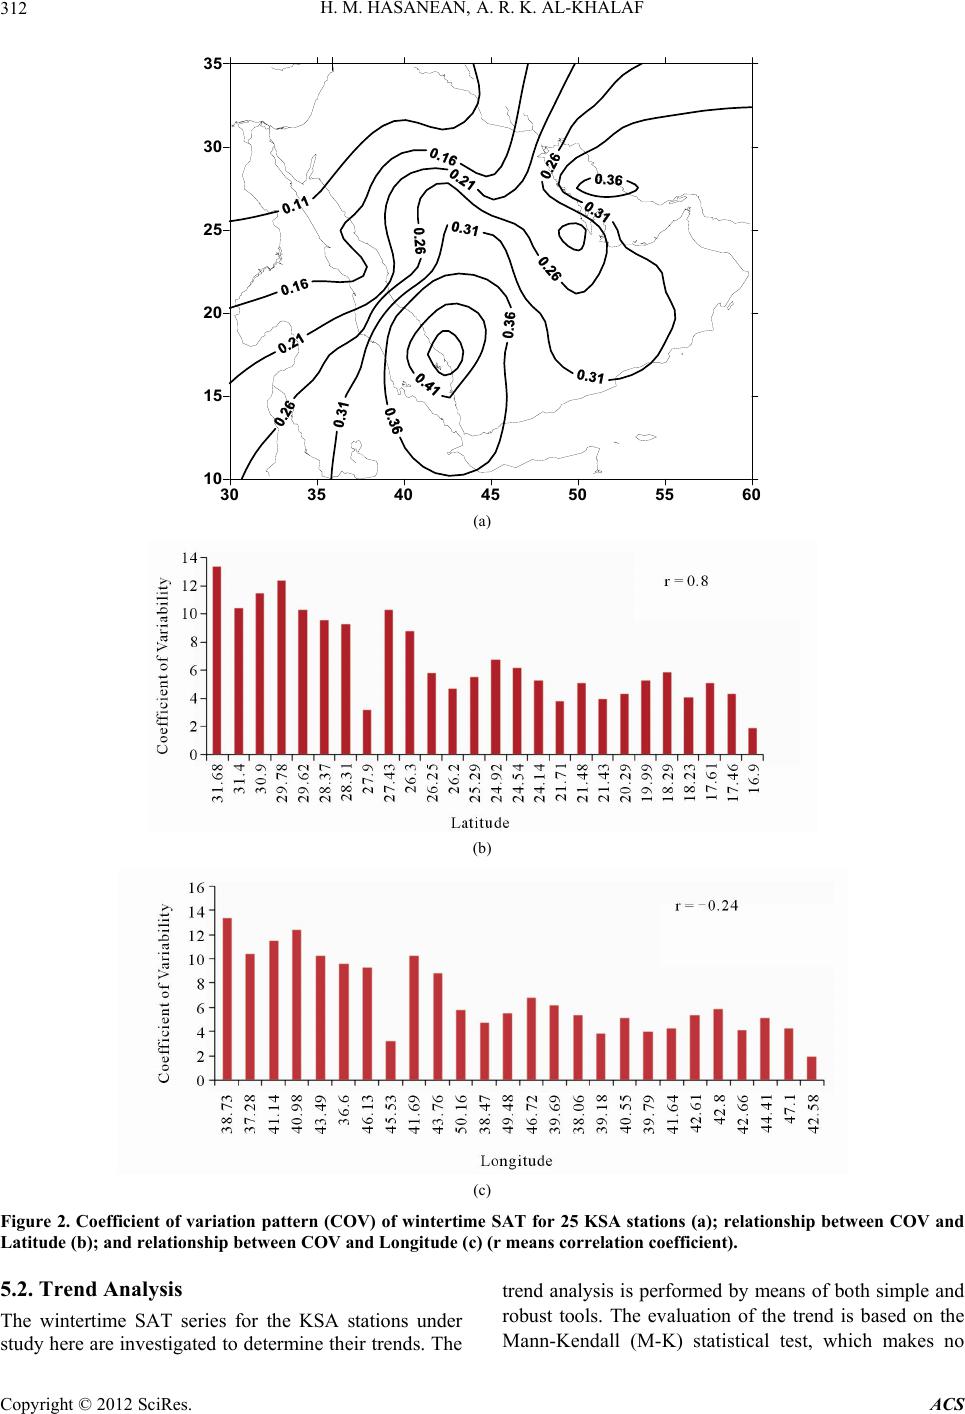 H. M. HASANEAN, A. R. K. AL-KHALAF 312 30 3 40 45 50 55 60 10 15 20 25 30 35 (a) (b) (c) Figure 2. Coefficient of variation pattern (COV) of wintertime SAT for 25 KSA stations (a); relationship between COV and Latitude (b); and relationship betw een COV and Longitude (c) (r means correlation coefficient). 5.2. Trend Analysis The wintertime SAT series for the KSA stations under study here are investigated to d etermine their trends. The trend analysis is performed by means of both simple and robust tools. The evaluation of the trend is based on the Mann-Kendall (M-K) statistical test, which makes no Copyright © 2012 SciRes. ACS 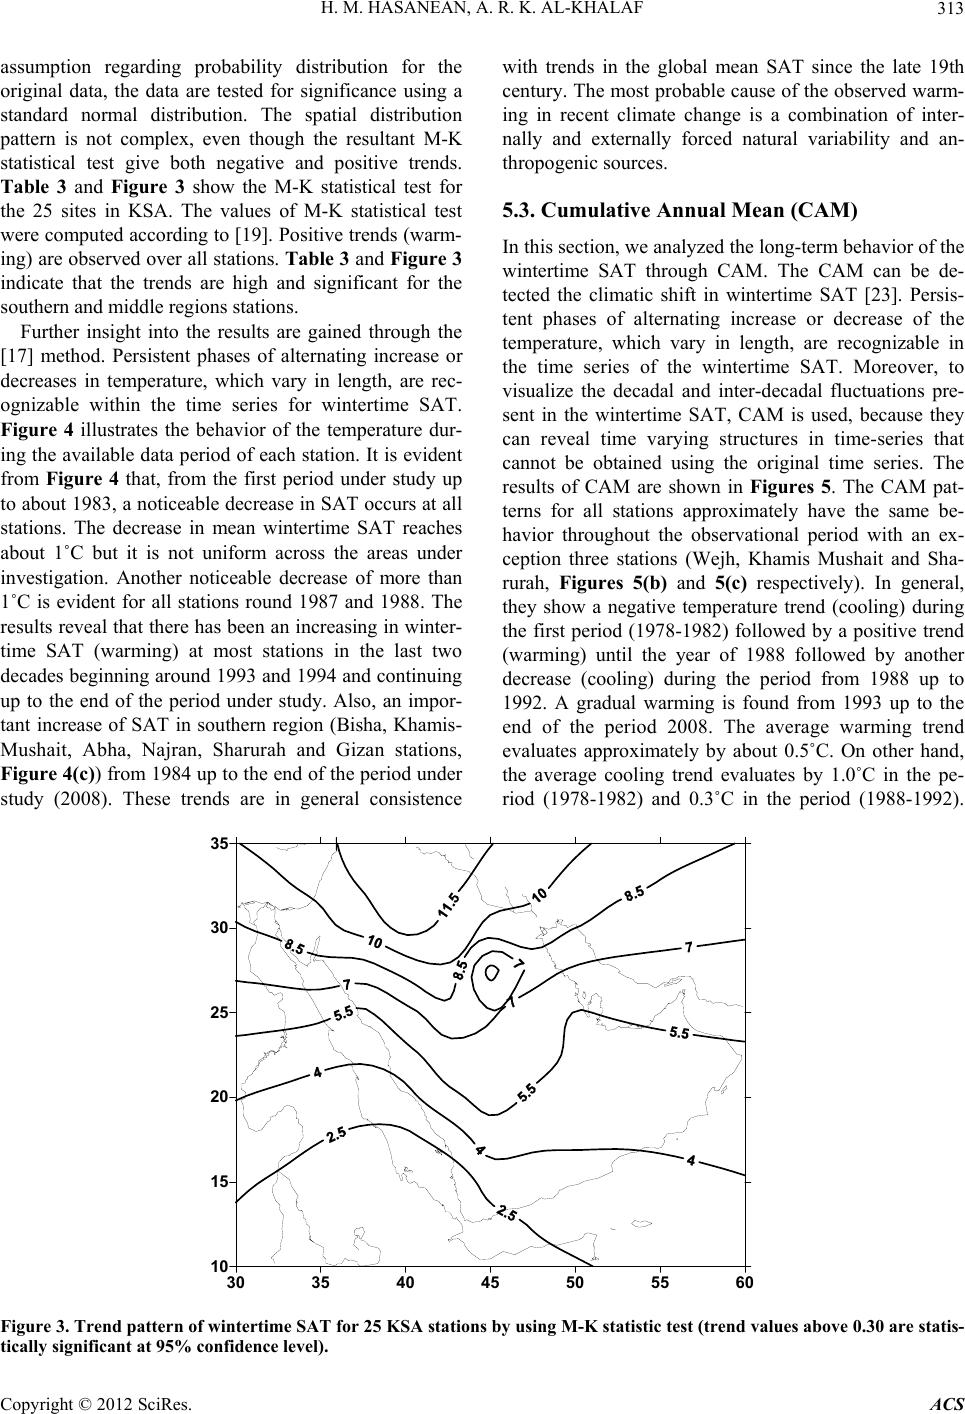 H. M. HASANEAN, A. R. K. AL-KHALAF 313 assumption regarding probability distribution for the original data, the data are tested for significance using a standard normal distribution. The spatial distribution pattern is not complex, even though the resultant M-K statistical test give both negative and positive trends. Table 3 and Figure 3 show the M-K statistical test for the 25 sites in KSA. The values of M-K statistical test were computed according to [19]. Positiv e trends (warm- ing) are observed over all stations. Table 3 and Figure 3 indicate that the trends are high and significant for the southern and middle regions stations. Further insight into the results are gained through the [17] method. Persistent phases of alternating increase or decreases in temperature, which vary in length, are rec- ognizable within the time series for wintertime SAT. Figure 4 illustrates the behavior of the temperature dur- ing the available data period of each station. It is evident from Figure 4 that, from the first period under study up to about 1983, a noticeable decrease in SAT occurs at all stations. The decrease in mean wintertime SAT reaches about 1˚C but it is not uniform across the areas under investigation. Another noticeable decrease of more than 1˚C is evident for all stations round 1987 and 1988. The results reveal that there has been an increasing in winter- time SAT (warming) at most stations in the last two decades beginning around 1993 and 1994 and continuing up to the end of the period under study. Also, an impor- tant increase of SAT in southern region (Bisha, Khamis- Mushait, Abha, Najran, Sharurah and Gizan stations, Figure 4(c)) from 1984 up to the end of the period under study (2008). These trends are in general consistence with trends in the global mean SAT since the late 19th century. The most probable cause of the observed warm- ing in recent climate change is a combination of inter- nally and externally forced natural variability and an- thropogenic sources. 5.3. Cumulative Annual Mean (CAM) In this section, we analyzed the long-term behavior of the wintertime SAT through CAM. The CAM can be de- tected the climatic shift in wintertime SAT [23]. Persis- tent phases of alternating increase or decrease of the temperature, which vary in length, are recognizable in the time series of the wintertime SAT. Moreover, to visualize the decadal and inter-decadal fluctuations pre- sent in the wintertime SAT, CAM is used, because they can reveal time varying structures in time-series that cannot be obtained using the original time series. The results of CAM are shown in Figures 5. The CAM pat- terns for all stations approximately have the same be- havior throughout the observational period with an ex- ception three stations (Wejh, Khamis Mushait and Sha- rurah, Figures 5(b) and 5(c) respectively). In general, they show a negative temperature trend (cooling) during the first period (1978-1982) followed by a positive trend (warming) until the year of 1988 followed by another decrease (cooling) during the period from 1988 up to 1992. A gradual warming is found from 1993 up to the end of the period 2008. The average warming trend evaluates approximately by about 0.5˚C. On other hand, the average cooling trend evaluates by 1.0˚C in the pe- riod (1978-1982) and 0.3˚C in the period (1988-1992). 30 3 10 15 20 25 30 3 40 4 50 5 60 Figure 3. Trend pattern of wintertime SAT for 25 KSA stations by using M-K statistic test (trend values above 0.30 are statis- tically significant at 95% confidence level). Copyright © 2012 SciRes. ACS 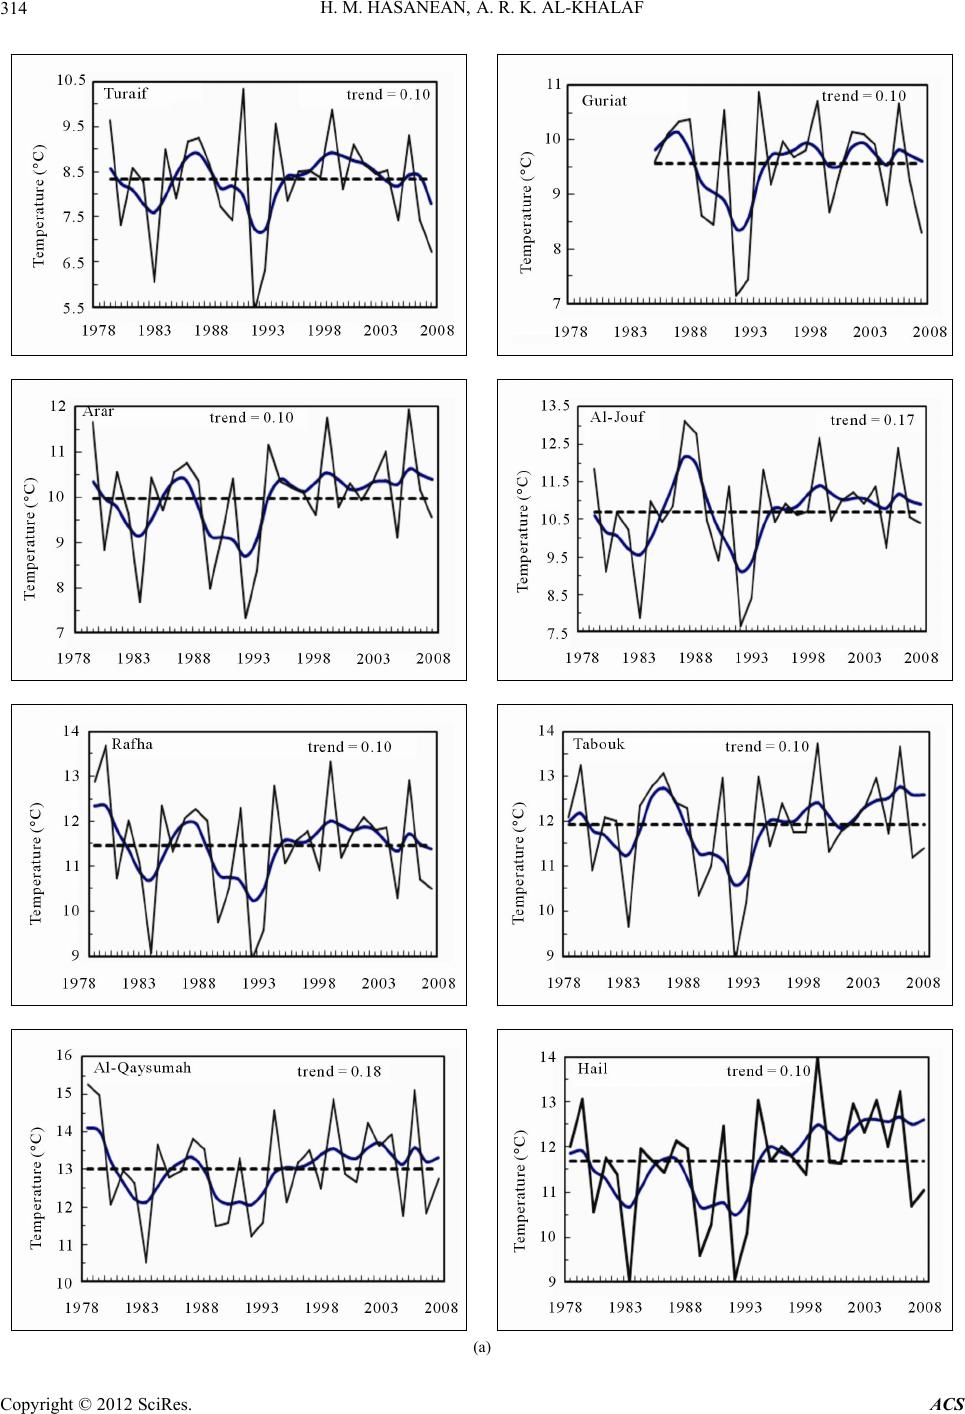 H. M. HASANEAN, A. R. K. AL-KHALAF 314 (a) Copyright © 2012 SciRes. ACS 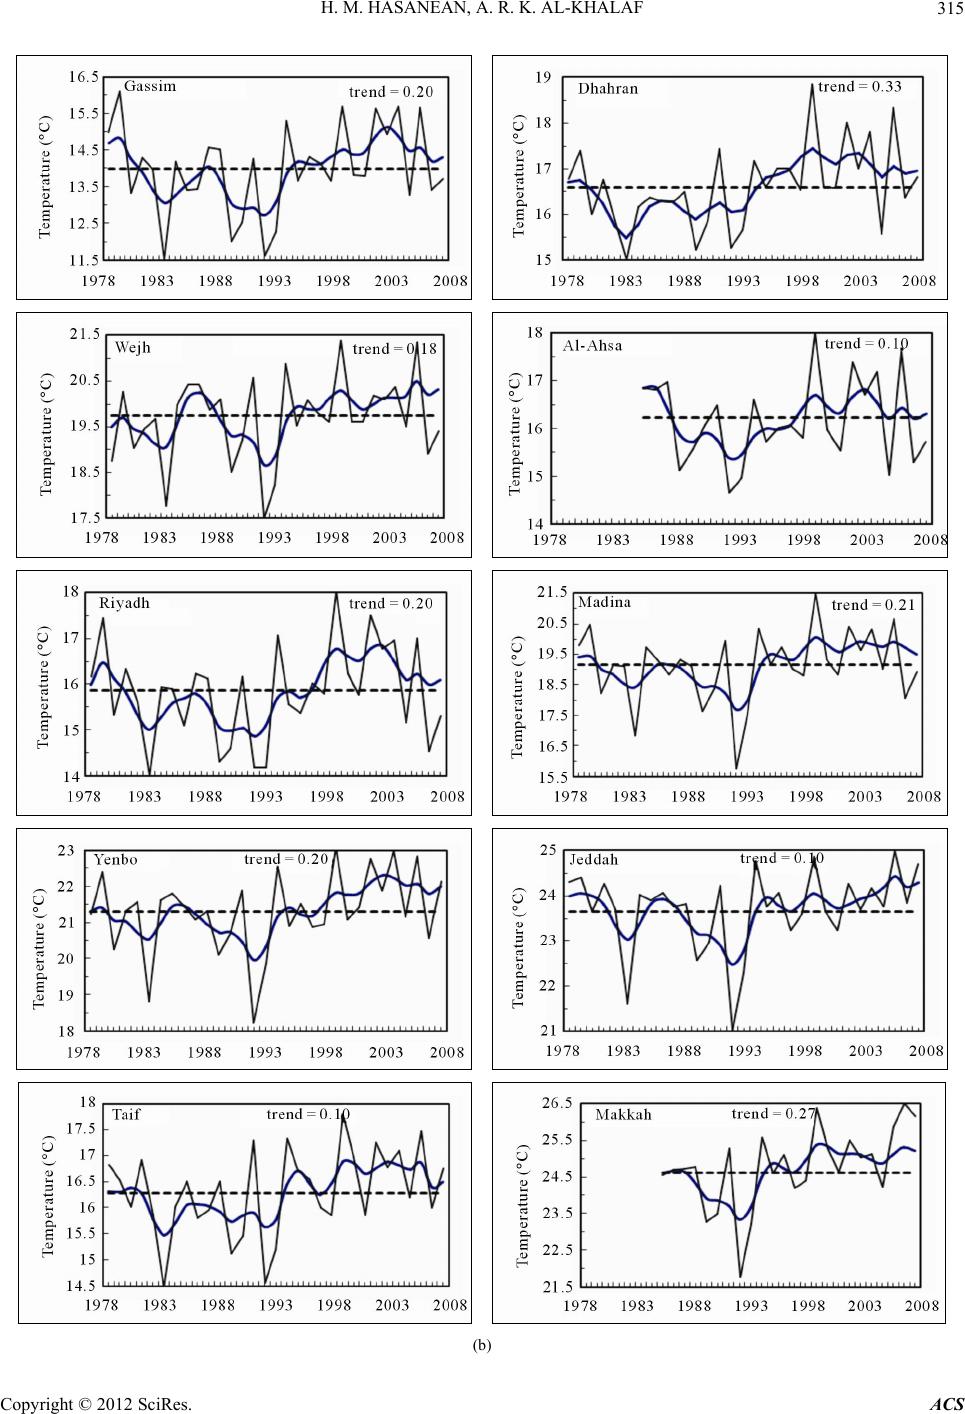 H. M. HASANEAN, A. R. K. AL-KHALAF 315 (b) Copyright © 2012 SciRes. ACS 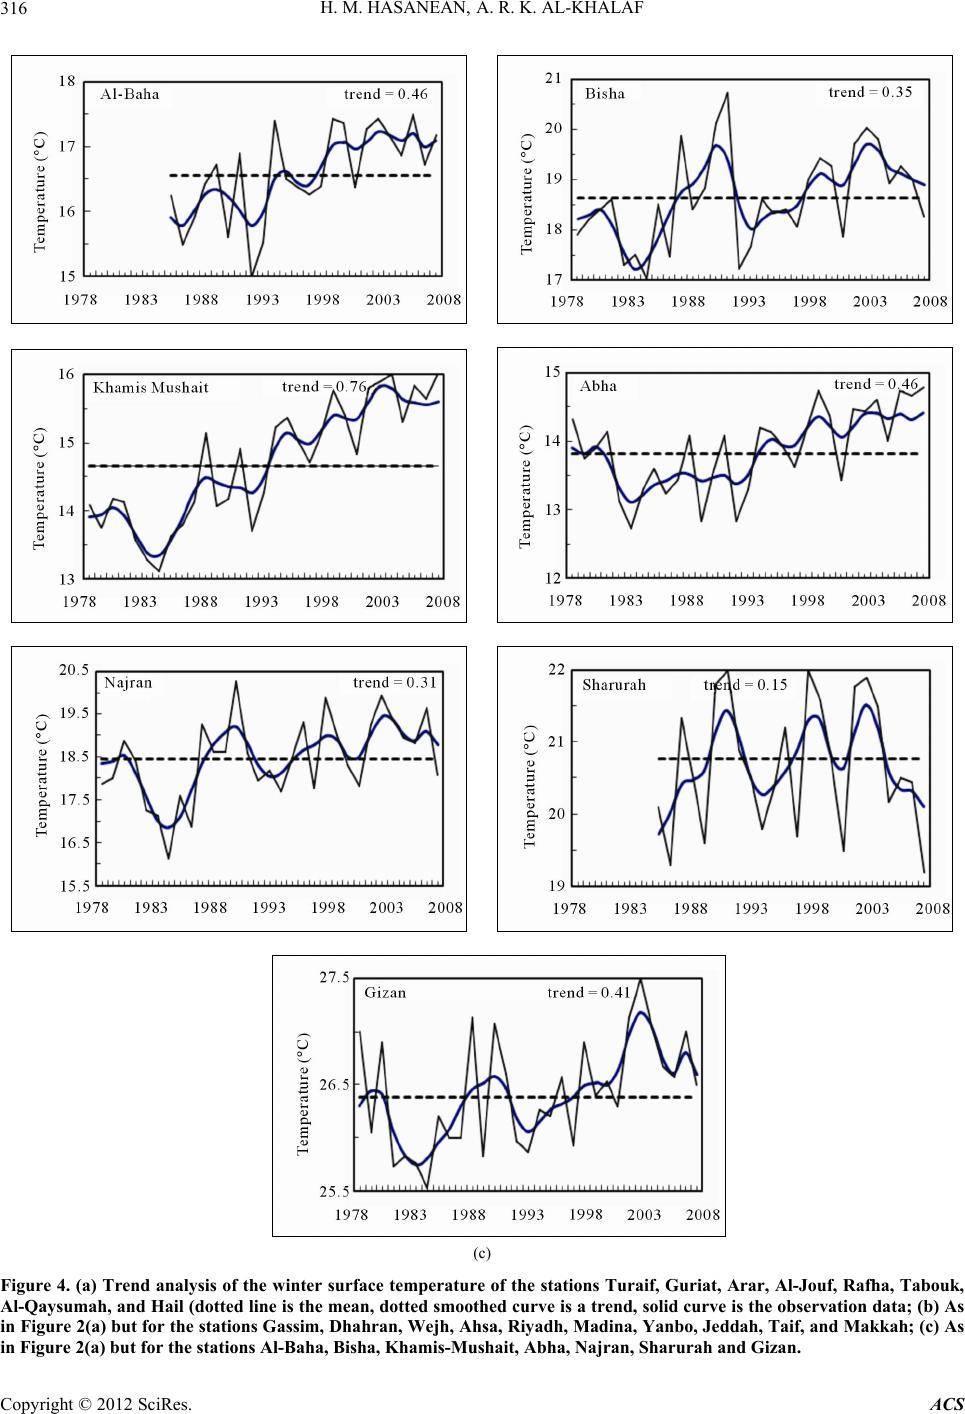 H. M. HASANEAN, A. R. K. AL-KHALAF 316 (c) Figure 4. (a) Trend analysis of the winter surface temperature of the stations Turaif, Guriat, Arar, Al-Jouf, Rafha, Tabouk, Al-Qaysumah, and Hail (dotted line is the mean, dotted smoothed curve is a trend, solid curve is the observation data; (b) As in Figure 2(a) but for the stations Gassim, Dhahran, Wejh, Ahsa, Riyadh, M adina, Yanbo, Jeddah, Taif, and M akkah; (c) As in Figure 2(a) but for the stations Al-Baha, Bisha, Khamis-Mushait, Abha, Najran, Sharurah and Gizan. Copyright © 2012 SciRes. ACS 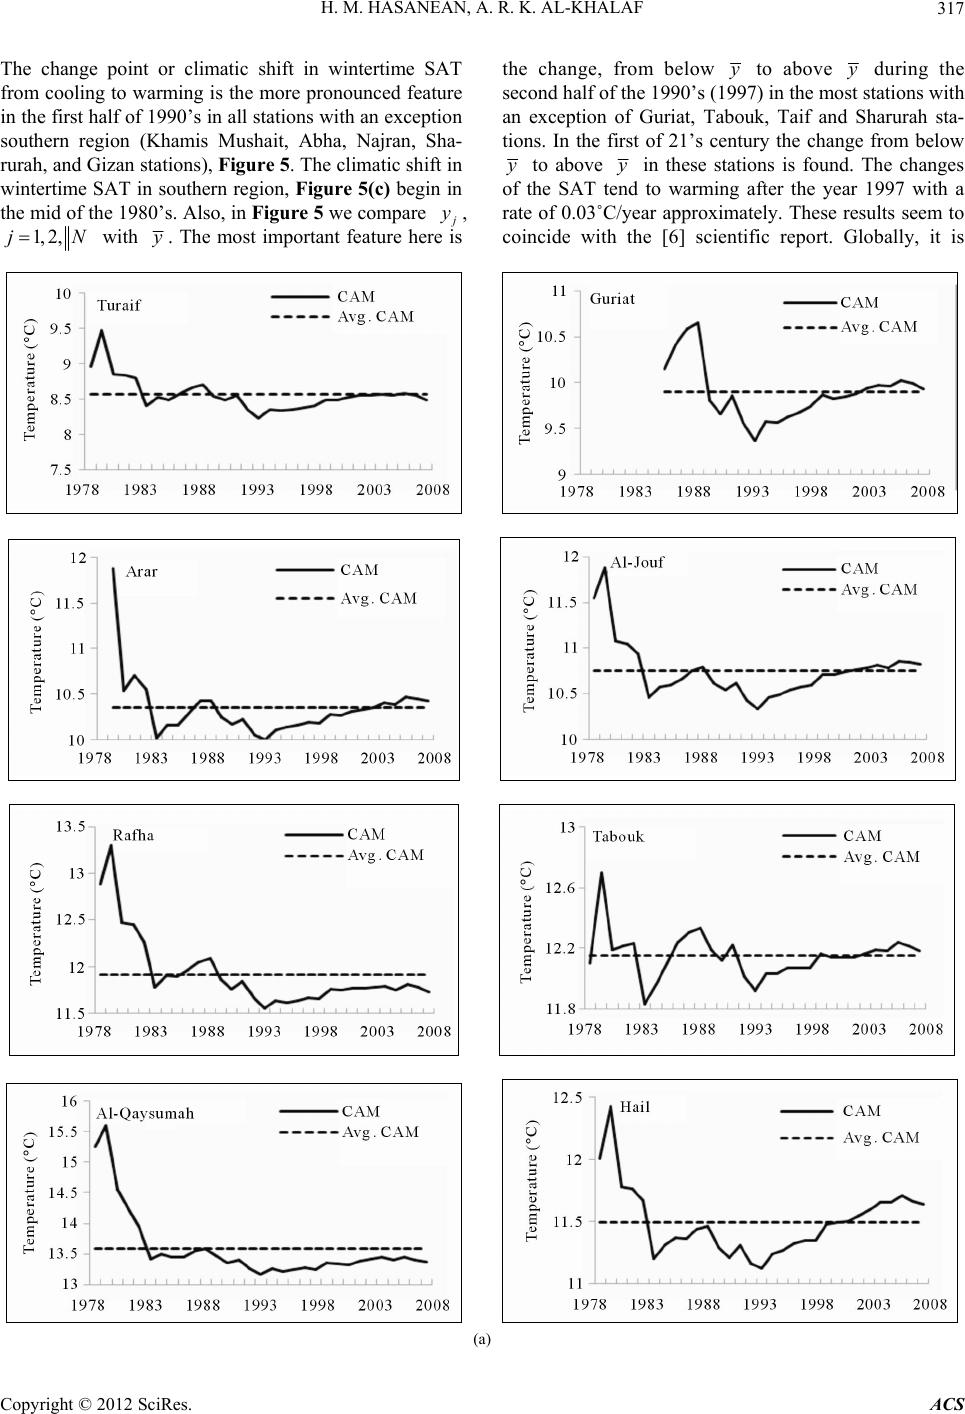 H. M. HASANEAN, A. R. K. AL-KHALAF ACS 317 Copyright © 2012 SciRes. The change point or climatic shift in wintertime SAT from cooling to warming is the more pronounced feature in the first half of 1990’s in all stations with an exception southern region (Khamis Mushait, Abha, Najran, Sha- rurah, and Gizan stations), Figure 5. The climatic shift in wintertime SAT in southern region, Figure 5(c) begin in the mid of the 1980’s. Also, in Figure 5 we compare y, 1, 2,jN with . The most important feature here is the change, from below to above during the second half of the 1990’s (1997) in the most stations with an exception of Guriat, Tabouk, Taif and Sharurah sta- tions. In the first of 21’s century the change from below to above in these stations is found. The changes of the SAT tend to warming after the year 1997 with a rate of 0.03˚C/year approximately. These results seem to coincide with the [6] scientific report. Globally, it is (a) 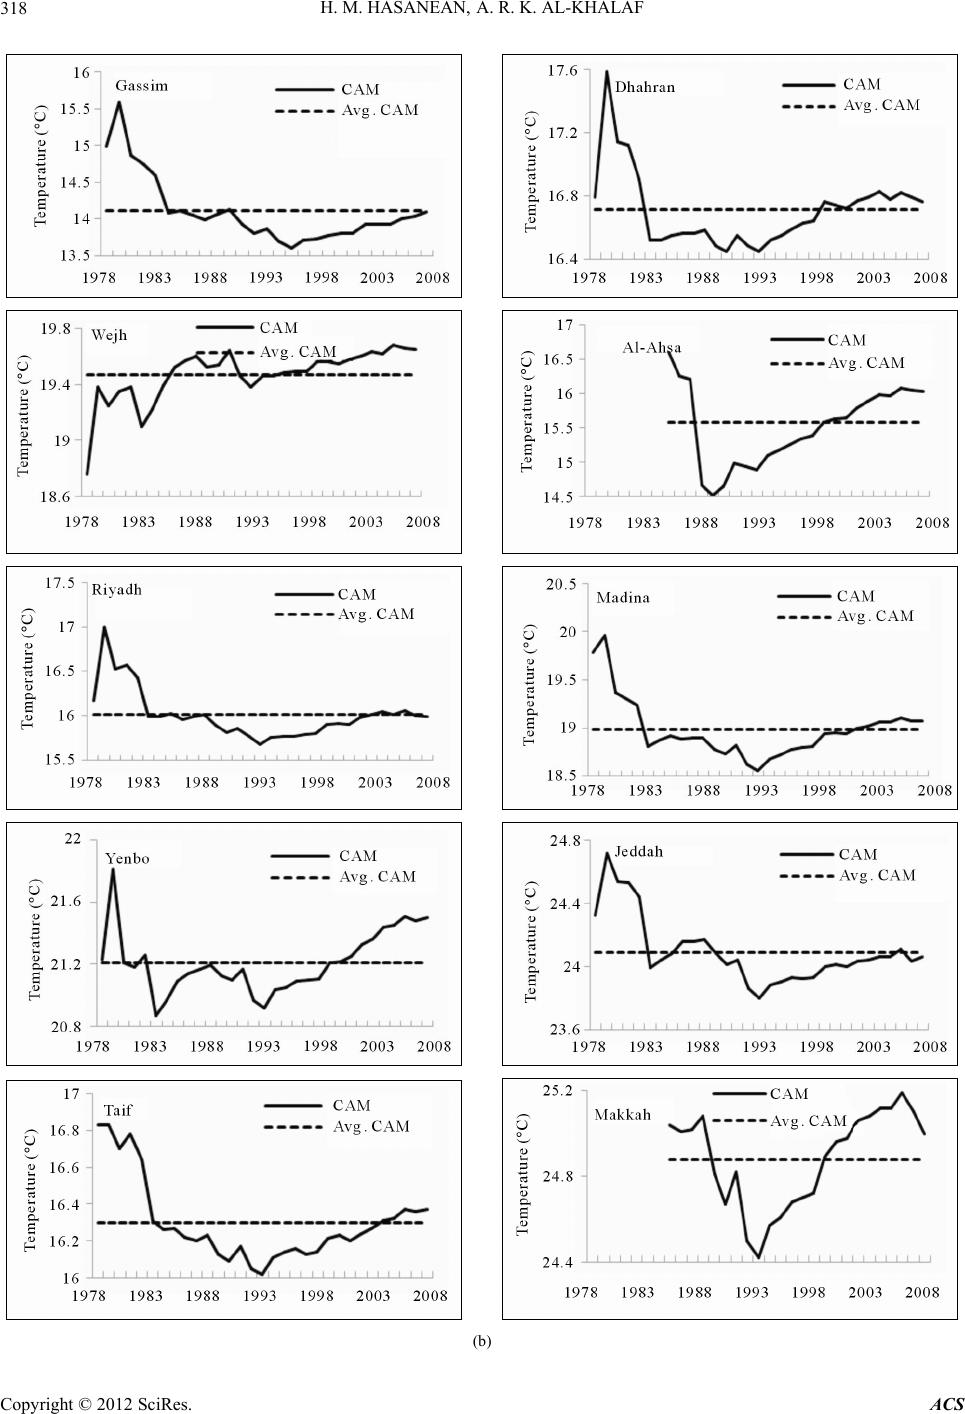 H. M. HASANEAN, A. R. K. AL-KHALAF 318 (b) Copyright © 2012 SciRes. ACS 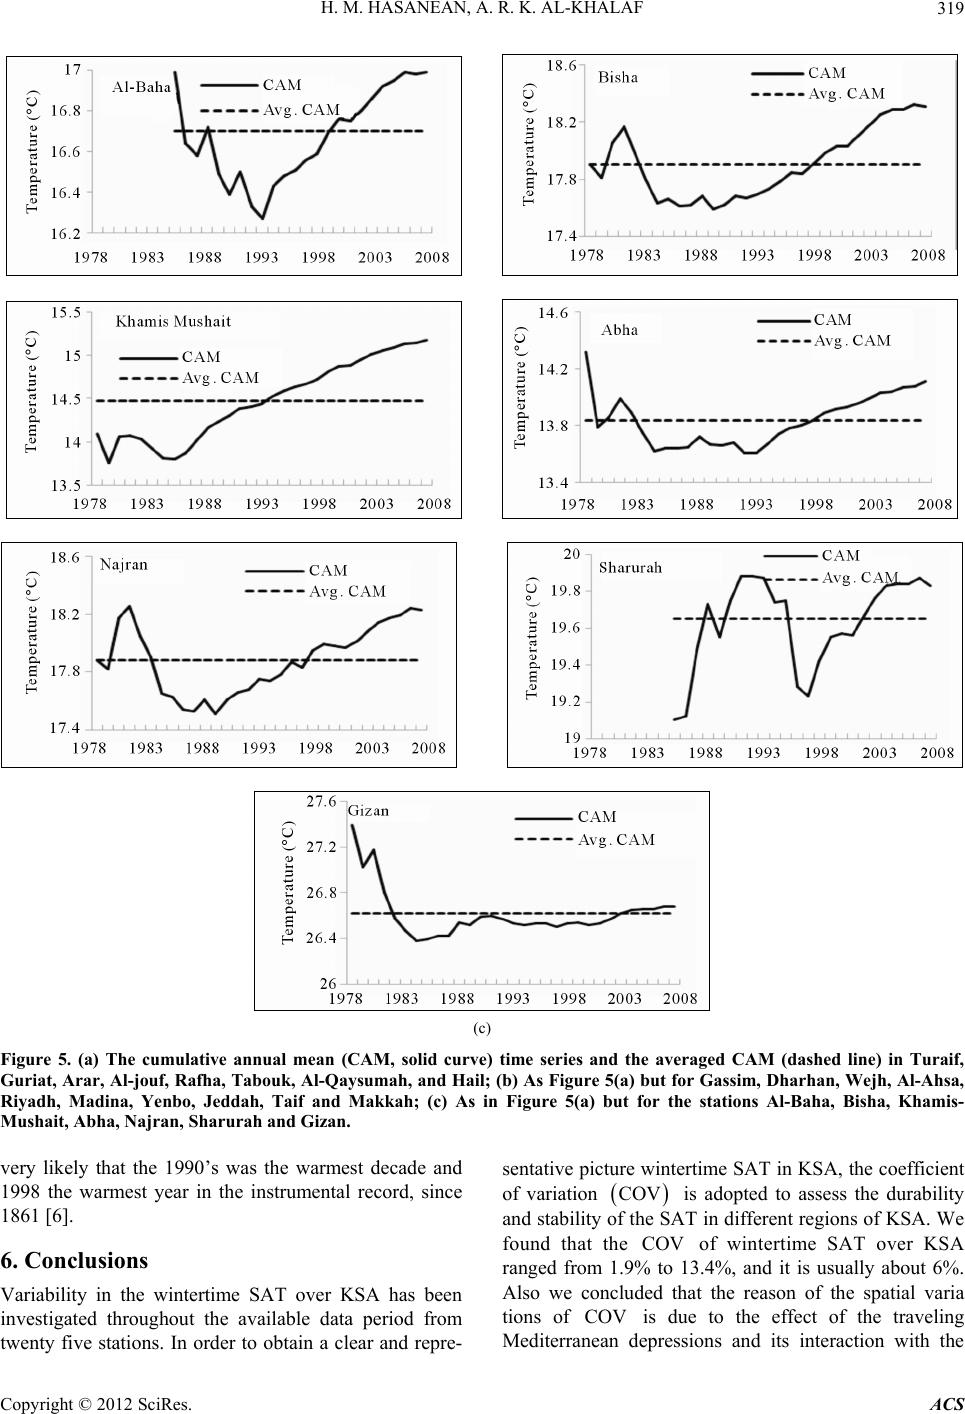 H. M. HASANEAN, A. R. K. AL-KHALAF ht © 2012 SciRes. ACS 319 (c) Figure 5. (a) The cumulative annual mean (CAM, solid curve) time series and the averaged CAM (dashed line) in Turaif, Guriat, Arar, Al-jouf, Rafha, Tabouk, Al-Q aysumah, and Hail; (b) As Figure 5(a) but for Gassim, Dharhan, Wejh, Al-Ahsa, Riyadh, Madina, Yenbo, Jeddah, Taif and Makkah; (c) As in Figure 5(a) but for the stations Al-Baha, Bisha, Khamis- Mushait, Abha, Najran, Sharurah and Gizan. very likely that the 1990’s was the warmest decade and 1998 the warmest year in the instrumental record, since 1861 [6]. Copyrig 6. Conclusions Variability in the wintertime SAT over KSA has been investigated throughout the available data period from twenty five stations. In order to obtain a clear and repre- sentative picture wintertime SAT in KSA, the coefficient of variation COV COV V is adopted to assess the durability and stability of the SAT in different regions of KSA. We found that the of wintertime SAT over KSA ranged from 1.9% to 13.4%, and it is usually about 6%. Also we concluded that the reason of the spatial varia tions of CO is due to the effect of the traveling Mediterranean depressions and its interaction with the  H. M. HASANEAN, A. R. K. AL-KHALAF 320 inverted V-shape trough of the Sudan low. Relationship between and latitudes is highly significant, while with longitudes is not significant. Mann-Kendall (M-K) statistical test illustrates that po sitive trends (warming) in wintertime SAT series occurs over the all stations and the trends of wintertime SAT are significant at mid and southern regi o n of the KS A. COV The use of the [17] method for surface temperature is provide to be fruitful approach to studying inter-annual climate fluctuations, because they reveal time varying structure in the raw data or in the more traditional statis- tical analyses. Examination of the [17] method winter- time SAT over KSA has revealed support for the notion of extended “persistence” over several years, even though simple year-to-year persistence may be evident. The wintertime SAT of the area is characterized by warm periods 1993-2008 at all regions of KSA stations, and 1984-2008 in southern region stations. While cooling in the wintertime SAT appears for the short period of about 5 years, 1978-1982 and 1988-1992. A warm period was not uniform, continuous or of the same order. Recent warming has only occurred during the last two decades at most stations. These trends are in general consistence with the global trends in the mean surface temperature. The most probable cause of the observed warming in the recent climate change is a combination of internally and externally forced natural variability and anthropogenic sources. Regarding to the analysis of CAM, one can see that, the CAM patterns for all stations approximately h ave the same behavior throughout the observational period. Fluctuation every 5 years from cooling to warming and in reverse is found in the most stations from the begin- ning period up to under study up to 1992. A gradual warming is found from 1993 up to the end of the period 2008. The average warming trend evaluates approxi- mately by about 0.5˚C. On other hand, the average cool- ing trend evaluates by 1.0˚C in the period (1978-1982) and 0.3˚C in the period (1988-1992). The climatic shift in wintertime SAT from cooling to warming is found in the first half of 1990’s in all stations with an exception southern region. In southern region the climatic shift in wintertime SAT, begin in the mid of the 1980’s. More- over, the most important feature is the change, from be- low average of CAM to above average of CAM, during the second half of the 1990’s in the most stations. These results seem to coincide with the [6] scientific report. Globally, it is very likely that the 1990’s was the warm- est decade and 1998 the warmest year in the instrumental record, since 1861 [6]. 7. Acknowledgements The authors are grateful for being enabled to use monthly mean KSA station temperature series from Presidency of Meteorology and Environment in Kingdom of Saudi Arabia (K SA). We are indebted to the faculty of meteor- ology and environmental, for making available the com- puter and other facilities in this work. REFERENCES [1] T. M. L. Wigley, P. D. Jones and P. M. Kelly, “Empirical Climate Studies: Warm World Scenarios and the Detec- tion of Climatic Change Induced by Radiatively Active Gases,” In: B. Bolin, J. Jäger and B. R. Döös, Eds., The Greenhouse Effect, Climatic Change, and Ecosystems, John Wiley, New York, 1986, pp. 271-323. [2] H. W. Ellsaesser, M. C. Mac Cracken, J. J. Walton and S. L. Grotch, “Global Climatic Trends as Revealed by the Recorded Data,” Reviews of Geophysics, Vol. 24, No. 4, 1986, pp. 745-792. [3] IPCC, “The Regional Impacts of Climate Change: An Assessment of Vulnerability—A Special Report of IPCC Working Group,” Cambridge University Press, Cam- bridge, 1998. [4] Y. Li, “A Phase Space EOF Method and Its Application to Climate Diagnosis,” Plateau Meteorology, Vol. 20, No. 1, 2001, pp. 88-93. [5] M. Yan, D. Wei and C. Panqin, “Analysis of Climate Jumps in the Sanjiang Plain,” Scientia Geographica Sini- ca, Vol. 23, No. 6, 2003, pp. 661-667. [6] IPCC, “Climate Change: The Physical Science Basis, Summary for Policymakers,” Contribution of the Work- ing Group 1 to the Fourth Assessment Report of the In- tergovernmental Panel on Climate Change, 2007, 21 pages. [7] F. Zhao, Z. Xu and J. Huang, “Long-Term Trend and Abrupt Change for Major Climate Variables in the Upper Yellow River Basin,” Acta Meteorologica Sinica, Vol. 21, No. 2, 2008, pp. 204-214. [8] K. Hu, G. Huang and R. Huang, “The Impact of Tropical Indian Ocean Variability on Summer Surface Air Tem- perature in China,” Journal of Climate, Vol. 24, No. 20, 2011, pp. 5365-5377. doi:10.1175/2011JCLI4152.1 [9] C. R. Bryant, B. Smit, M. Brklacich, T. R. Johnston, J. Smithers, Q. Chiotti and B. Singh, “Adaptation in Cana- dian Agriculture to Climatic Variability and Change,” Climate Change, Vol. 45, No. 1, 2000, pp. 181-201. doi:10.1023/A:1005653320241 [10] P. D. Jones, “Hemispheric Surface Air Temperature Va ri a- tions: Recent Trends and an Update to 1987,” Journal of Climate, Vol. 1, No. 6, 1988, pp. 654-660. doi:10.1175/1520-0442(1988)001<0654:HSATVR>2.0.C O;2 [11] T. M. Smith and W. R. Reynolds, “A Global Merged Land-Air-Sea Surface Temperature Reconstruction Based on Historical Observations (1980-1997),” Journal of Climate, Vol. 18, No. 12, 2005, pp. 2021-2036. doi:10.1175/JCLI3362.1 [12] J. E. Hansen, R. Ruedy, M. Sato, M. Imhoff, W. Lawrence, D. Easterling and T. Karl, “A Closer Look at Unit e d S ta t es and Global Surface Temperature Change,” Journal of Copyright © 2012 SciRes. ACS  H. M. HASANEAN, A. R. K. AL-KHALAF Copyright © 2012 SciRes. ACS 321 Geophysical Research, Vol. 106, No. D20, 2001, pp. 23947-23963. doi:10.1029/2001JD000354 [13] V. Conrad and C. Pollack, “Methods in Climatology,” Harvard University Press, Cambridge, 1962, p. 459. [14] R. Heino, “Climate in Finland during the Period of Mete- orological Observations,” Academic Dissertation, Mete- orological Institute, Helsinki, 1994, p. 209. [15] J. M. Mitchell, B. Dzerdzeevskii, H. Flohn and W. L. Hofmery, “Climatic Change,” World Meteorological Or- ganization (WMO), Technical Note, No. 195, Geneva, 1966, 79 pages. [16] E. S. Pearson and H. O. Hartley, “Biometrika Tables for Statisticians,” Cambridge University Press, Cambridge, 1958, p. 240. [17] Q. Hu, C. M. Woodruff and S. E. Mudrick, “Interdecadal Variations of Annual Precipitation in the Central United States,” Bulletin of the American Meteorological Society, Vol. 79, No. 2, 1998, pp. 221-229. doi:10.1175/1520-0477(1998)079<0221:IVOAPI>2.0.CO;2 [18] R. Shapiro, “Linear Filtering,” Mathematical Computa- tion, Vol. 29, No. 132, 1975, pp. 1094-1097. doi:10.1090/S0025-5718-1975-0389356-X [19] R. Sneyers “On the Statistical Analysis of Series of Ob- servations,” World Meteorological Organization (WMO), Technical Note, No. 143, Geneva, 1990, p. 192. [20] C. D. Schonwiese and J. Rapp, “Climate Trend Atlas of Europe: Based on Observations 1891-1990,” Interna- tional Journal of Climatology, Vol. 18, No. 5, 1998, pp. 580-581. [21] H. M. Hasanean, “Wintertime Surface Temperature in Egypt in Relation to the Associated Atmospheric Circula- tion,” International Journal of Climatology, Vol. 24, No. 8, 2004, pp. 985-999. doi:10.1002/joc.1043 [22] R. Huth, “Testing of Trends in Data Unevenly Distributed in Time,” Theoretical and Applied Climatology, Vol. 64, No. 3-4, 1999, pp. 151-162. doi:10.1007/s007040050119 [23] E. G. Pavia and F. Graef, “The Recent Rainfall Climatol- ogy of the Mediterranean Californias,” Journal of Climate, Vol. 15, No. 18, 2002, pp. 2697-2701. doi:10.1175/1520-0442(2002)015<2697:TRRCOT>2.0.C O;2
|