Paper Menu >>
Journal Menu >>
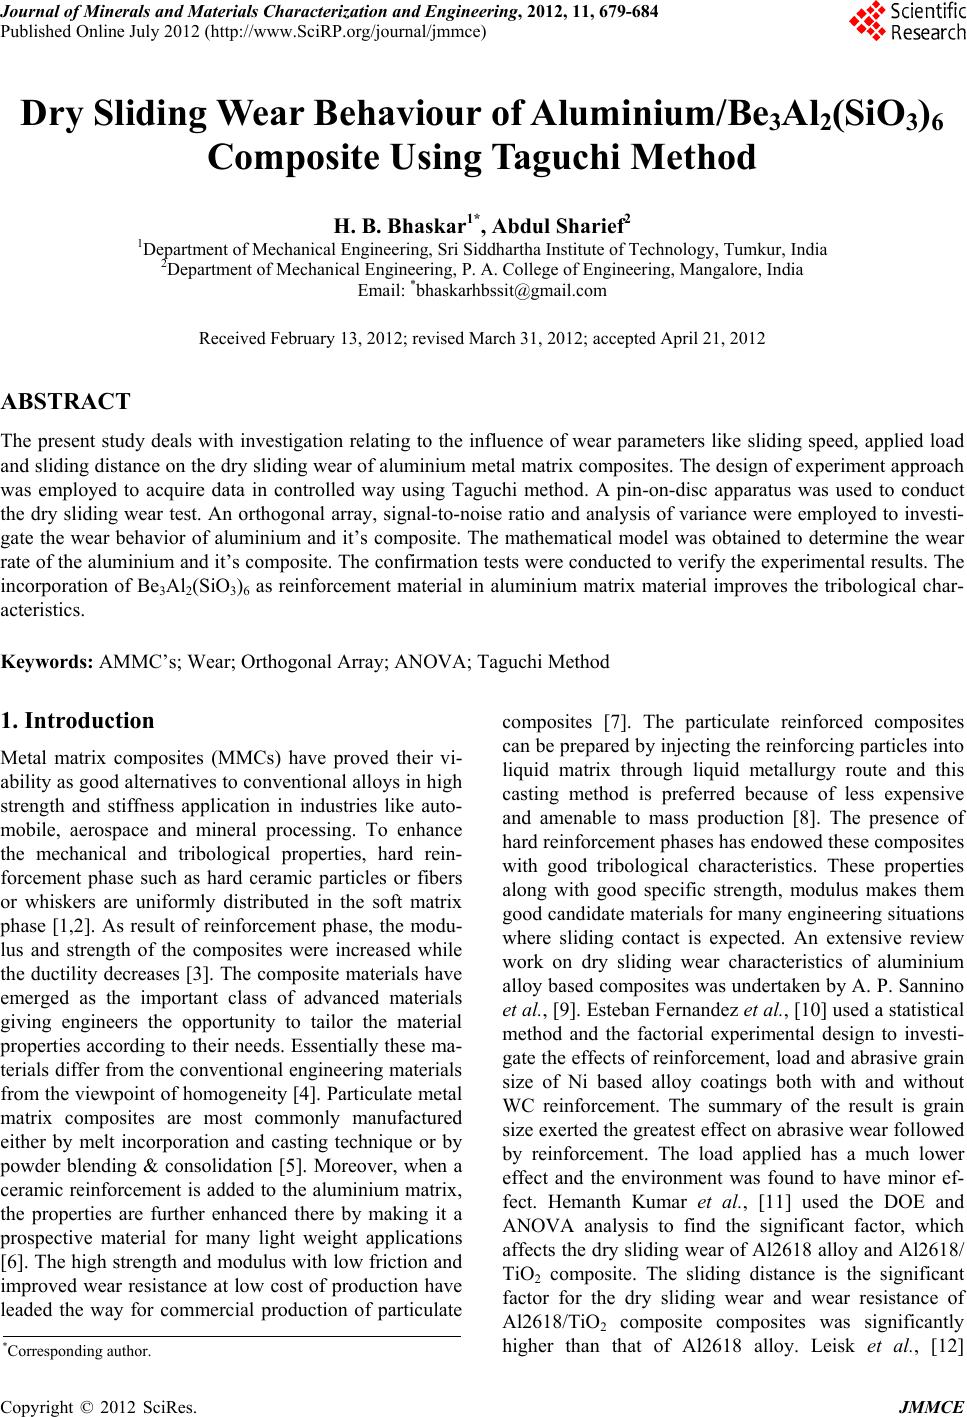 Journal of Minerals and Materials Characterization and Engineering, 2012, 11, 679-684 Published Online July 2012 (http://www.SciRP.org/journal/jmmce) Dry Sliding Wear Behaviour of Aluminium/Be3Al2(SiO3)6 Composite Using Taguchi Method H. B. Bhaskar1*, Abdul Sharief2 1Department of Mechanical Engineering, Sri Siddhartha Institute of Technology, Tumkur, India 2Department of Mechanical Engineering, P. A. College of Engineering, Mangalore, India Email: *bhaskarhbssit@gmail.com Received February 13, 2012; revised March 31, 2012; accepted April 21, 2012 ABSTRACT The present study deals with investigation relating to the influence of wear parameters like sliding speed, applied load and sliding distance on the dry sliding wear of aluminium metal matrix composites. The design of experiment approach was employed to acquire data in controlled way using Taguchi method. A pin-on-disc apparatus was used to conduct the dry sliding wear test. An orthogonal array, signal-to-noise ratio and analysis of variance were employed to investi- gate the wear behavior of aluminium and it’s composite. The mathematical model was obtained to determine the wear rate of the aluminium and it’s composite. The confirmation tests were conducted to verify the experimental results. The incorporation of Be3Al2(SiO3)6 as reinforcement material in aluminium matrix material improves the tribological char- acteristics. Keywords: AMMC’s; Wear; Orthogonal Array; ANOVA; Taguchi Method 1. Introduction Metal matrix composites (MMCs) have proved their vi- ability as good alternatives to conventional alloys in high strength and stiffness application in industries like auto- mobile, aerospace and mineral processing. To enhance the mechanical and tribological properties, hard rein- forcement phase such as hard ceramic particles or fibers or whiskers are uniformly distributed in the soft matrix phase [1,2]. As result of reinforcement phase, the modu- lus and strength of the composites were increased while the ductility decreases [3]. The composite materials have emerged as the important class of advanced materials giving engineers the opportunity to tailor the material properties according to their needs. Essentially these ma- terials differ from the conventional engineering materials from the viewpoint of homogeneity [4]. Particulate metal matrix composites are most commonly manufactured either by melt incorporation and casting technique or by powder blending & consolidation [5]. Moreover, when a ceramic reinforcement is added to the aluminium matrix, the properties are further enhanced there by making it a prospective material for many light weight applications [6]. The high strength and modulus with low friction and improved wear resistance at low cost of production have leaded the way for commercial production of particulate composites [7]. The particulate reinforced composites can be prepared by injecting the reinforcing particles into liquid matrix through liquid metallurgy route and this casting method is preferred because of less expensive and amenable to mass production [8]. The presence of hard reinforcement phases has endowed these composites with good tribological characteristics. These properties along with good specific strength, modulus makes them good candidate materials for many engineering situations where sliding contact is expected. An extensive review work on dry sliding wear characteristics of aluminium alloy based composites was undertaken by A. P. Sannino et al., [9]. Esteban Fernandez et al., [10] used a statistical method and the factorial experimental design to investi- gate the effects of reinforcement, load and abrasive grain size of Ni based alloy coatings both with and without WC reinforcement. The summary of the result is grain size exerted the greatest effect on abrasive wear followed by reinforcement. The load applied has a much lower effect and the environment was found to have minor ef- fect. Hemanth Kumar et al., [11] used the DOE and ANOVA analysis to find the significant factor, which affects the dry sliding wear of Al2618 alloy and Al2618/ TiO2 composite. The sliding distance is the significant factor for the dry sliding wear and wear resistance of Al2618/TiO2 composite composites was significantly higher than that of Al2618 alloy. Leisk et al., [12] *Corresponding author. Copyright © 2012 SciRes. JMMCE 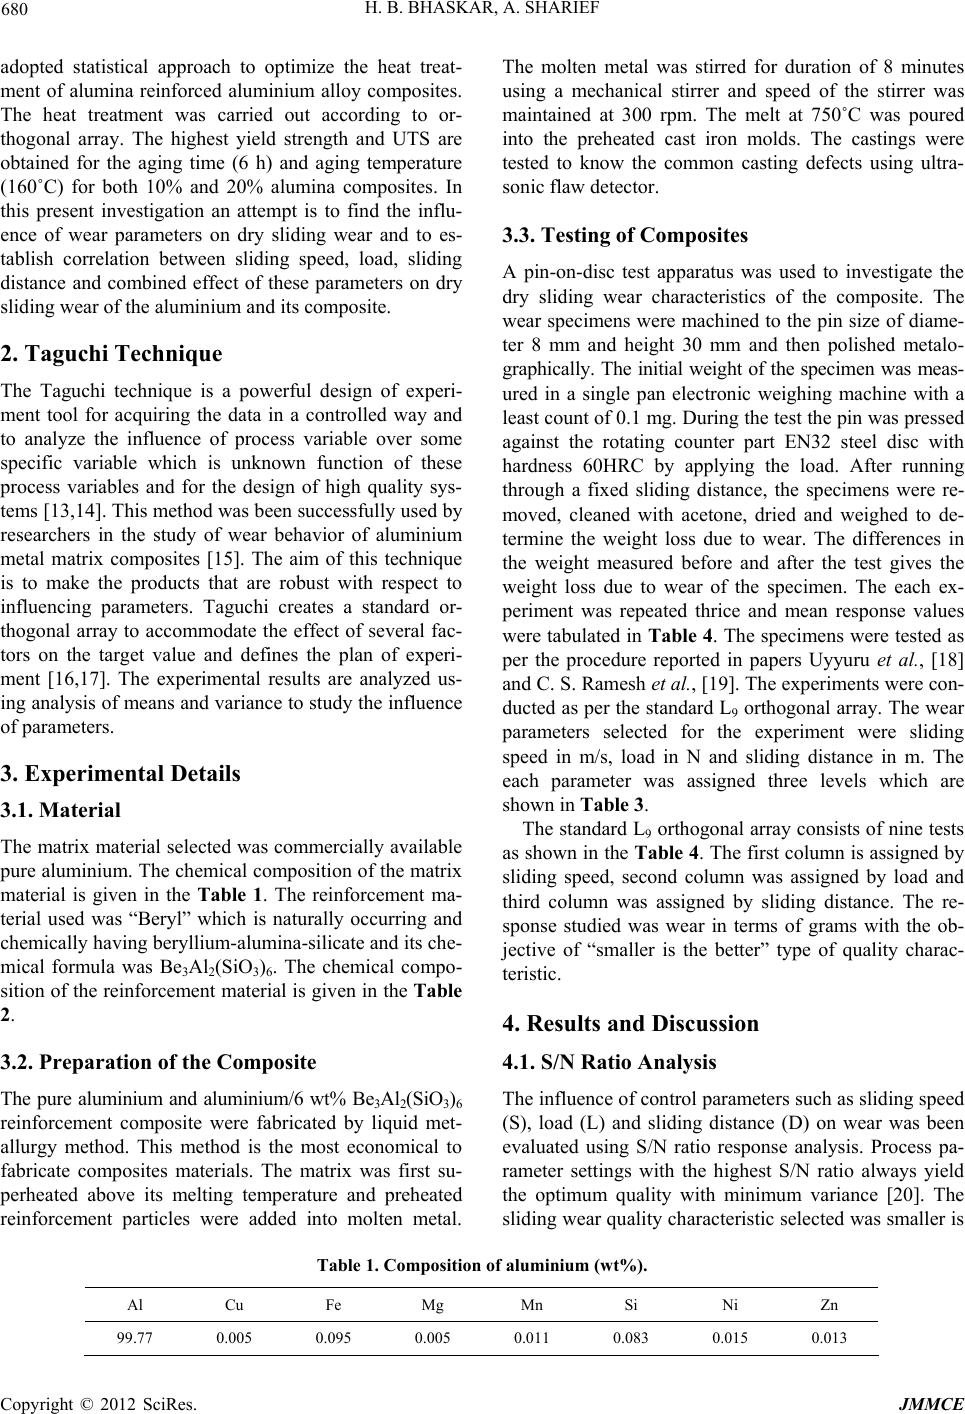 H. B. BHASKAR, A. SHARIEF 680 adopted statistical approach to optimize the heat treat- ment of alumina reinforced aluminium alloy composites. The heat treatment was carried out according to or- thogonal array. The highest yield strength and UTS are obtained for the aging time (6 h) and aging temperature (160˚C) for both 10% and 20% alumina composites. In this present investigation an attempt is to find the influ- ence of wear parameters on dry sliding wear and to es- tablish correlation between sliding speed, load, sliding distance and combined effect of these parameters on dry sliding wear of the aluminium and its composite. 2. Taguchi Technique The Taguchi technique is a powerful design of experi- ment tool for acquiring the data in a controlled way and to analyze the influence of process variable over some specific variable which is unknown function of these process variables and for the design of high quality sys- tems [13,14]. This method was been successfully used by researchers in the study of wear behavior of aluminium metal matrix composites [15]. The aim of this technique is to make the products that are robust with respect to influencing parameters. Taguchi creates a standard or- thogonal array to accommodate the effect of several fac- tors on the target value and defines the plan of experi- ment [16,17]. The experimental results are analyzed us- ing analysis of means and variance to study the influence of parameters. 3. Experimental Details 3.1. Material The matrix material selected was commercially available pure aluminium. The chemical composition of the matrix material is given in the Table 1. The reinforcement ma- terial used was “Beryl” which is naturally occurring and chemically having beryllium-alumina-silicate and its che- mical formula was Be3Al2(SiO3)6. The chemical compo- sition of the reinforcement material is given in the Table 2. 3.2. Preparation of the Composite The pure aluminium and aluminium/6 wt% Be3Al2(SiO3)6 reinforcement composite were fabricated by liquid met- allurgy method. This method is the most economical to fabricate composites materials. The matrix was first su- perheated above its melting temperature and preheated reinforcement particles were added into molten metal. The molten metal was stirred for duration of 8 minutes using a mechanical stirrer and speed of the stirrer was maintained at 300 rpm. The melt at 750˚C was poured into the preheated cast iron molds. The castings were tested to know the common casting defects using ultra- sonic flaw detector. 3.3. Testing of Composites A pin-on-disc test apparatus was used to investigate the dry sliding wear characteristics of the composite. The wear specimens were machined to the pin size of diame- ter 8 mm and height 30 mm and then polished metalo- graphically. The initial weight of the specimen was meas- ured in a single pan electronic weighing machine with a least count of 0.1 mg. During the test the pin was pressed against the rotating counter part EN32 steel disc with hardness 60HRC by applying the load. After running through a fixed sliding distance, the specimens were re- moved, cleaned with acetone, dried and weighed to de- termine the weight loss due to wear. The differences in the weight measured before and after the test gives the weight loss due to wear of the specimen. The each ex- periment was repeated thrice and mean response values were tabulated in Table 4. The specimens were tested as per the procedure reported in papers Uyyuru et al., [18] and C. S. Ramesh et al., [19]. The experiments were con- ducted as per the standard L9 orthogonal array. The wear parameters selected for the experiment were sliding speed in m/s, load in N and sliding distance in m. The each parameter was assigned three levels which are shown in Table 3. The standard L9 orthogonal array consists of nine tests as shown in the Table 4. The first column is assigned by sliding speed, second column was assigned by load and third column was assigned by sliding distance. The re- sponse studied was wear in terms of grams with the ob- jective of “smaller is the better” type of quality charac- teristic. 4. Results and Discussion 4.1. S/N Ratio Analysis The influence of control parameters such as sliding speed (S), load (L) and sliding distance (D) on wear was been evaluated using S/N ratio response analysis. Process pa- rameter settings with the highest S/N ratio always yield the optimum quality with minimum variance [20]. The sliding wear quality characteristic selected was smaller is Table 1. Composition of aluminium (wt%). Al Cu Fe Mg Mn Si Ni Zn 99.77 0.005 0.095 0.005 0.011 0.083 0.015 0.013 Copyright © 2012 SciRes. JMMCE 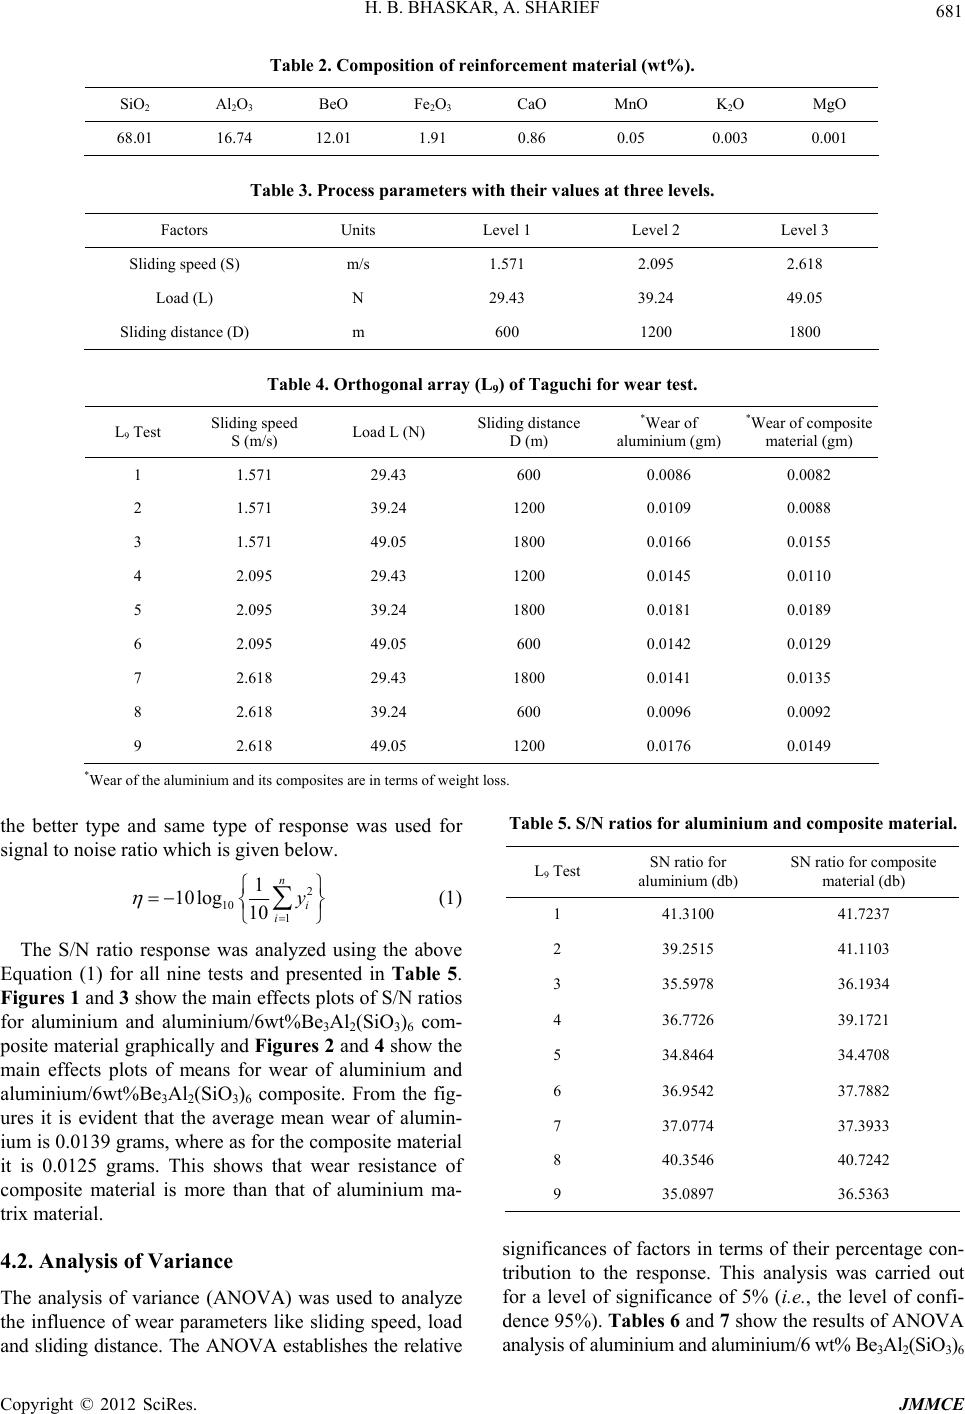 H. B. BHASKAR, A. SHARIEF 681 Table 2. Composition of reinforcement material (wt%). SiO2 Al2O3 BeO Fe2O3 CaO MnO K2O MgO 68.01 16.74 12.01 1.91 0.86 0.05 0.003 0.001 Table 3. Process parameters with their values at three levels. Factors Units Level 1 Level 2 Level 3 Sliding speed (S) m/s 1.571 2.095 2.618 Load (L) N 29.43 39.24 49.05 Sliding distance (D) m 600 1200 1800 Table 4. Orthogonal array (L9) of Taguchi for wear test. L9 Test Sliding speed S (m/s) Load L (N) Sliding distance D (m) *Wear of aluminium (gm) *Wear of composite material (gm) 1 1.571 29.43 600 0.0086 0.0082 2 1.571 39.24 1200 0.0109 0.0088 3 1.571 49.05 1800 0.0166 0.0155 4 2.095 29.43 1200 0.0145 0.0110 5 2.095 39.24 1800 0.0181 0.0189 6 2.095 49.05 600 0.0142 0.0129 7 2.618 29.43 1800 0.0141 0.0135 8 2.618 39.24 600 0.0096 0.0092 9 2.618 49.05 1200 0.0176 0.0149 *Wear of the aluminium and its composites are in terms of weight loss. the better type and same type of response was used for signal to noise ratio which is given below. 2 10 1 1 10log 10 n i i y (1) The S/N ratio response was analyzed using the above Equation (1) for all nine tests and presented in Table 5. Figures 1 and 3 show the main effects plots of S/N ratios for aluminium and aluminium/6wt%Be3Al2(SiO3)6 com- posite material graphically and Figures 2 and 4 show the main effects plots of means for wear of aluminium and aluminium/6wt%Be3Al2(SiO3)6 composite. From the fig- ures it is evident that the average mean wear of alumin- ium is 0.0139 grams, where as for the composite material it is 0.0125 grams. This shows that wear resistance of composite material is more than that of aluminium ma- trix material. 4.2. Analysis of Variance The analysis of variance (ANOVA) was used to analyze the influence of wear parameters like sliding speed, load and sliding distance. The ANOVA establishes the relative Table 5. S/N ratios for aluminium and composite material. L9 Test SN ratio for aluminium (db) SN ratio for composite material (db) 1 41.3100 41.7237 2 39.2515 41.1103 3 35.5978 36.1934 4 36.7726 39.1721 5 34.8464 34.4708 6 36.9542 37.7882 7 37.0774 37.3933 8 40.3546 40.7242 9 35.0897 36.5363 significances of factors in terms of their percentage con- tribution to the response. This analysis was carried out for a level of significance of 5% (i.e., the level of confi- dence 95%). Tables 6 and 7 show the results of ANOVA analysis of aluminium and aluminium/6 wt% Be3Al2(SiO3)6 Copyright © 2012 SciRes. JMMCE 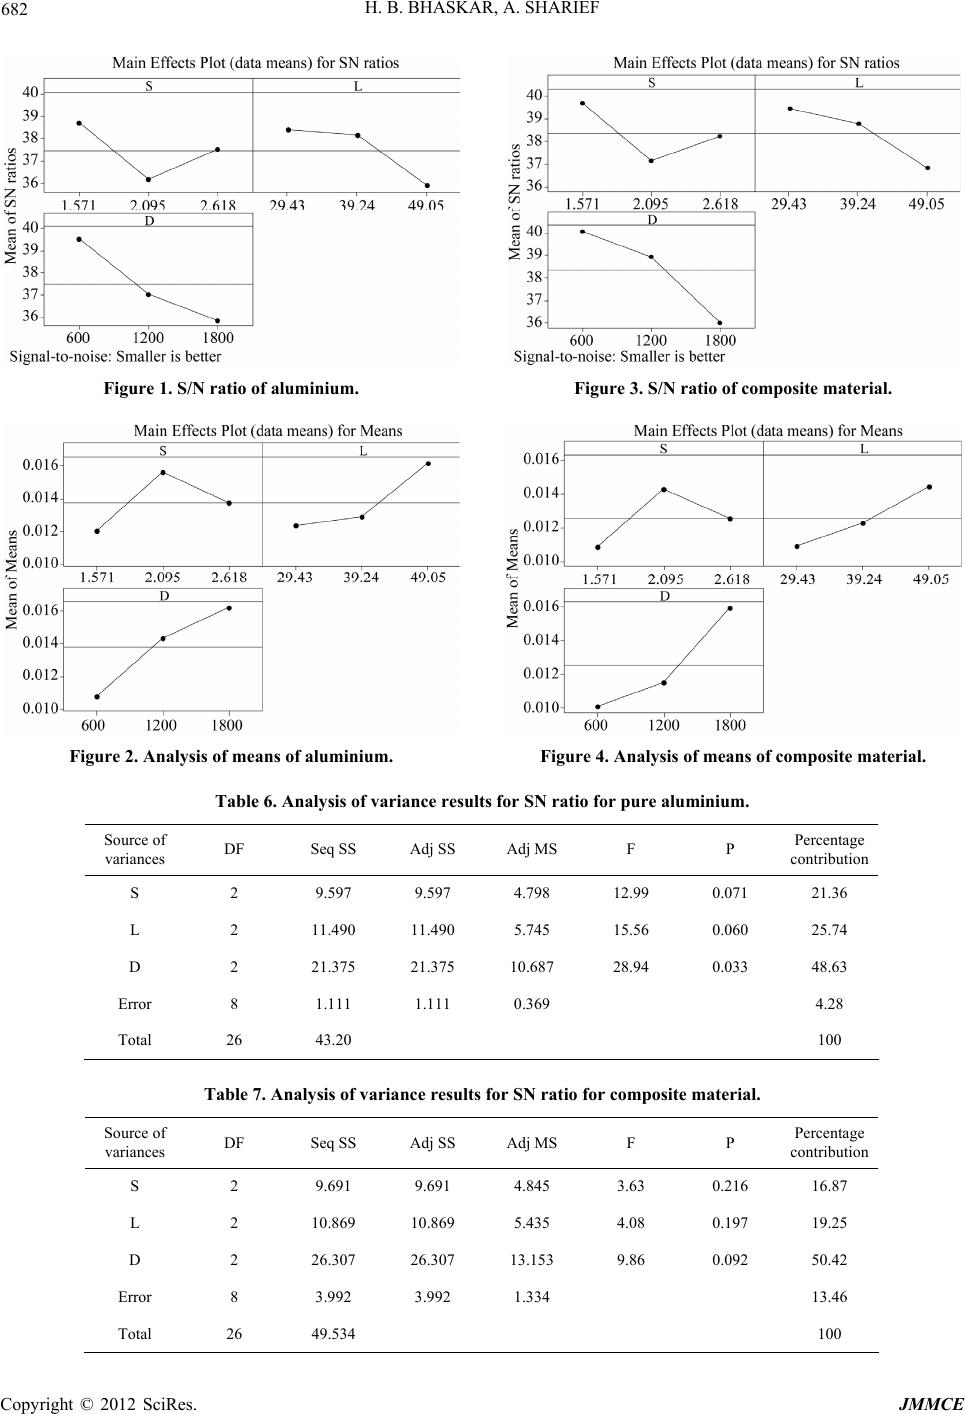 H. B. BHASKAR, A. SHARIEF 682 Figure 1. S/N ratio of aluminium. Figure 2. Analysis of means of aluminium. Figure 3. S/N ratio of composite material. Figure 4. Analysis of means of composite material. Table 6. Analysis of variance results for SN ratio for pure aluminium. Source of variances DF Seq SS Adj SS Adj MS F P Percentage contribution S 2 9.597 9.597 4.798 12.99 0.071 21.36 L 2 11.490 11.490 5.745 15.56 0.060 25.74 D 2 21.375 21.375 10.687 28.94 0.033 48.63 Error 8 1.111 1.111 0.369 4.28 Total 26 43.20 100 Table 7. Analysis of variance results for SN ratio for composite material. Source of variances DF Seq SS Adj SS Adj MS F P Percentage contribution S 2 9.691 9.691 4.845 3.63 0.216 16.87 L 2 10.869 10.869 5.435 4.08 0.197 19.25 D 2 26.307 26.307 13.153 9.86 0.092 50.42 Error 8 3.992 3.992 1.334 13.46 Total 26 49.534 100 Copyright © 2012 SciRes. JMMCE  H. B. BHASKAR, A. SHARIEF 683 composite. We can observe from the ANOVA analysis (Table 6) that the sliding speed, load and sliding distance have the influence on wear of aluminium matrix material. The last column of the Tables 6 and 7 indicate the percentage con- tribution of each factor on the total variation indicating their degree of influence on the result. One can observe from the ANOVA Table 6 that the load (25.74%) and sliding distance (48.63%) have great influence on the wear of the aluminium matrix material. The Table 7 shows ANOVA analysis of aluminium/6wt%Be3Al2(SiO3)6 com- posite material. From the results, it is found that load (19.25%) and sliding distance (50.42%) have great in- fluence on the wear of the composite material. The mechanism of material removal during wear process of the aluminium is by plastic deformation and gouging. The wear resistance of the composite material is improved due to the presence of hard reinforcement par- ticles in the matrix material. The wear process in the composite material is by plastic deformation, gouging and reinforcement particles will crush to very minute particles and form a very thin sub surface layer desig- nated as mechanically mixed layer (MML) which pro- vides protection to the matrix material. The MML forms a layer between the work hardened pin and the counter face which withstands high stresses and is very effective in reducing the sliding wear. Figures 5 and 6 show the micro structure of the aluminium and aluminium/6 wt% Be3Al2(SiO3)6 composite material. 4.3. Multiple Linear Regression Model A multiple linear regression analysis attempts to model the relationship between two or more predictor variables and a response variable by fitting a linear equation to the observed data [21,22]. In order to establish the correla- tion between the wear parameters: sliding speed, load, sliding distance and the wear, the multiple linear regres- sion model was used [23,24]. The regression equation for aluminium: Waluminium = −0.00258 + 0.00163 S + 0.000192 L + 0.000005 D (2) The regression equation for composite material: Wcomposite material = −0.00379 + 0.00163 S + 0.000180 L + 0.000005 D (3) 4.4. Confirmation Test The confirmation test was performed for composite ma- terial by selecting the set of parameters as shown in Ta- ble 8. The Table 9 shows the results obtained using re- gression Equation (3) and the experimental results. Both the results were compared and observed that the calcu- lated error varies from 5.52% to 9.8%. Therefore the 25 μm Figure 5. Micrograph of aluminum. 25 μm Figure 6. Micrograph of Al/6wt%Be3Al2(SiO3)6. Table 8. Parameters used in the confirmation wear test. Test Sliding speed (m/s)Load (N) Sliding distance (m) 1 1.58 9.81 750 2 1.98 19.6 1150 3 2.30 39.2 1350 Table 9. Confirmation wear test and comparison with re- gression model. Test Expt. Reg. model (Equation (3)) % of error 1 0.0046 0.0043 5.52 2 0.0094 0.0087 7.4 3 0.0153 0.0138 9.8 multiple regression equation derived above correlate the evaluation of the wear of the composite with the reason- able degree of approximation. 5. Conclusions Based on the above analysis the following conclusions Copyright © 2012 SciRes. JMMCE  H. B. BHASKAR, A. SHARIEF 684 are drawn from this present study. 1) The DOE technique was successfully used to study the dry sliding wear of aluminium and aluminium/ 6wt% Be3Al2(SiO3)6 composite; 2) The analysis of variance shows that the sliding dis- tance (48.63%) and load (25.74%) have significant in- fluence on the wear of the aluminium matrix; 3) The analysis of variance shows that the sliding dis- tance (50.42%) and load (19.25%) have significant in- fluence on the wear of the composite material; 4) The wear resistance of composite is more than that of aluminium matrix. The average mean wear of alumin- ium is 0.0139 grams, where as for the composite material it is 0.0125 grams; 5) The conformation tests showed that error associated with wear of the composite material varies from 5.52% to 9.8%. REFERENCES [1] B. G. Park, A. G. Crosky and A. K. Hellier, “Material Characterisation and Mechanical Properties of Al2O3-Al Metal Matrix Composites,” Journal of Material Science, Vol. 31, 1997, pp. 1775-1788. [2] T. S. Srivastava, “Microstructure, Tensile Properties and Fracture Behaviour of Al2O3 Particulate-Reinforced Alu- minium Alloy Metal Matrix Composites,” Journal of Material Science, Vol. 31, No. 5, 1996, pp. 1375-1388. doi:10.1007/BF00353120 [3] N. R. P. Swamy, C. S. Ramesh and T. Chandrashekar, “Effect of Heat Treatment on Strength and Abrasive Wear Behaviour of Al6061-SiCp Composites,” Bulletin of Ma- terials Science, Vol. 33, No. 1, 2010, pp. 49-54. doi:10.1007/s12034-010-0007-y [4] J. A. Hooker and P. J. Doorber, “Metal Matrix Compo- sites for Aeroengines,” Material Science and Technology, Vol. 6, No. 7-8, 2000, pp. 725-731. [5] I. Sinclair and P. J. Gregson, “Structural Performance of Discontinuous Metal Matrix Composites,” Materials Sci- ence and Technology, Vol. 3, No. 9, 1997, pp. 709-726. doi:10.1179/026708397790290254 [6] T. W. Clyne, “Metal Matrix Composites: Matrices and Processing,” Elsevier, Amsterdam, 2001. [7] V. K. Lindroos and M. J. Talvitie, “Recent Advances in Metal Matrix Composites,” Journal of Materials Proc- essing Technology, Vol. 53, 1995, pp. 273-278. [8] M. Singla, D. D. Dwivedi, L. Singh and V. Chawla, “De- velopment of Aluminium Based Silicon Carbide Particu- late Metal Matrix Composite,” Journal of Minerals & Materials Characterization & Engineering, Vol. 8, No. 6, 2009, pp. 455-467. [9] A. P. Sannino and H. J. Rack, “Dry Sliding Wear of Dis- continuously Reinforced Aluminium Composites: Review and Discussion,” Wear, Vol. 189, No. 1-2, 1995, pp. 1-19. doi:10.1016/0043-1648(95)06657-8 [10] J. E. Fernandez, M. R. del Fernandez, R. V. diaz and R. T. Navarro, “Abrasive Wear Analysis Using Factorial Ex- perimental Design,” Wear, Vol. 255, No. 1-6, 2003, pp. 38-43. doi:10.1016/S0043-1648(03)00103-0 [11] T. R. H. Kumar, R. P. Swamy and T. K. Chandrashekar, “Tribological Studies on Discontinuously Reinforced Metal Matrix Composite Using Design of Experiment,” Journal of Manufacturing Engineering, Vol. 6, No. 2, 2011, pp. 106-110. [12] G. Leisk and A. Saigal, “A Statistical Approach to the Heat Treatment Optimization of Al-Al2O3 Particulate Com- posite,” Journal of Materials Engineering and Perform- ance, Vol. 1, No. 1, 1992, pp. 45-48. doi:10.1007/BF02650031 [13] K. R. Roy, “A Primer on the Taguchi Method,” Van Nostrand Reinhold, New York, 1990. [14] P. J. Ross, “Taguchi Technique for Quality Engineering,” McGraw-Hill, New York, 1993. [15] Y. Sahin, “The Prediction of Wear Resistance Model for the Metal Matrix Composites,” Wear, Vol. 258, No. 11- 12, 2005, pp. 1717-1722. [16] G. Taguchi and S. Konishi, “Taguchi Methods Orthogo- nal Arrays and Linear Graphs: Tools for Quality Engi- neering,” American Supplier Institute, Dearborn, 1987. [17] G. Taguchi, “Taguchi on Robust Technology Develop- ment: Bringing Quality Engineering Upstream,” ASME Press, New York, 1993. doi:10.1115/1.800288 [18] R. K, Uyyuru, M. K. Surappa and S. Brusethang, “Effect of Reinforcement Volume Fraction and Size Distribution on the Tribological Behavior of Al-Composite/Brake Pad Tribo-Couple,” Wear, Vol. 260, No. 11-12, 2006, pp. 1248- 1255. doi:10.1016/j.wear.2005.08.011 [19] C. S. Ramesh, S. K. Sheshadri and K. J. L. Iyer, “A Sur- vey of Aspects of Wear of Metals,” Indian Journal of Technology, Vol. 29, No. 4, 1991, pp. 179-185. [20] K. Palanikumar, “Application of Taguchi and Response Surface Methodologies for Surface Roughness in Ma- chining Glass Fiber Reinforced Plastics by PCD Tool- ing,” The International Journal of Advanced Manufac- turing Technology, Vol. 36, No. 1-2, 2008, pp. 19-27. [21] D. C. Montgomery and G. C. Runger, “Applied Statistics and Probability for Engineers,” John Wiley & Sons, New York, 1999. [22] D. C. Montgomery, “Design and Analysis of Experi- ments,” Wiley India Pvt. Ltd., New Delhi, 2007. [23] S. Basavarajappa and G. Chandramohan, “Wear Studies on Metal Matrix Composites: A Taguchi Approach,” Jour- nal of Materials Science and Technology, Vol. 21, No. 6, 2005, pp. 845-850. [24] K. Hokkirigawa and K. Kato, “An Experimental and Theoretical Investigation of Ploughing, Cutting and Wedge Formation during Abrasive Wear,” Tribology Interna- tional, Vol. 21, No. 1, 1988, pp. 51-57. doi:10.1016/0301-679X(88)90128-4 Copyright © 2012 SciRes. JMMCE |