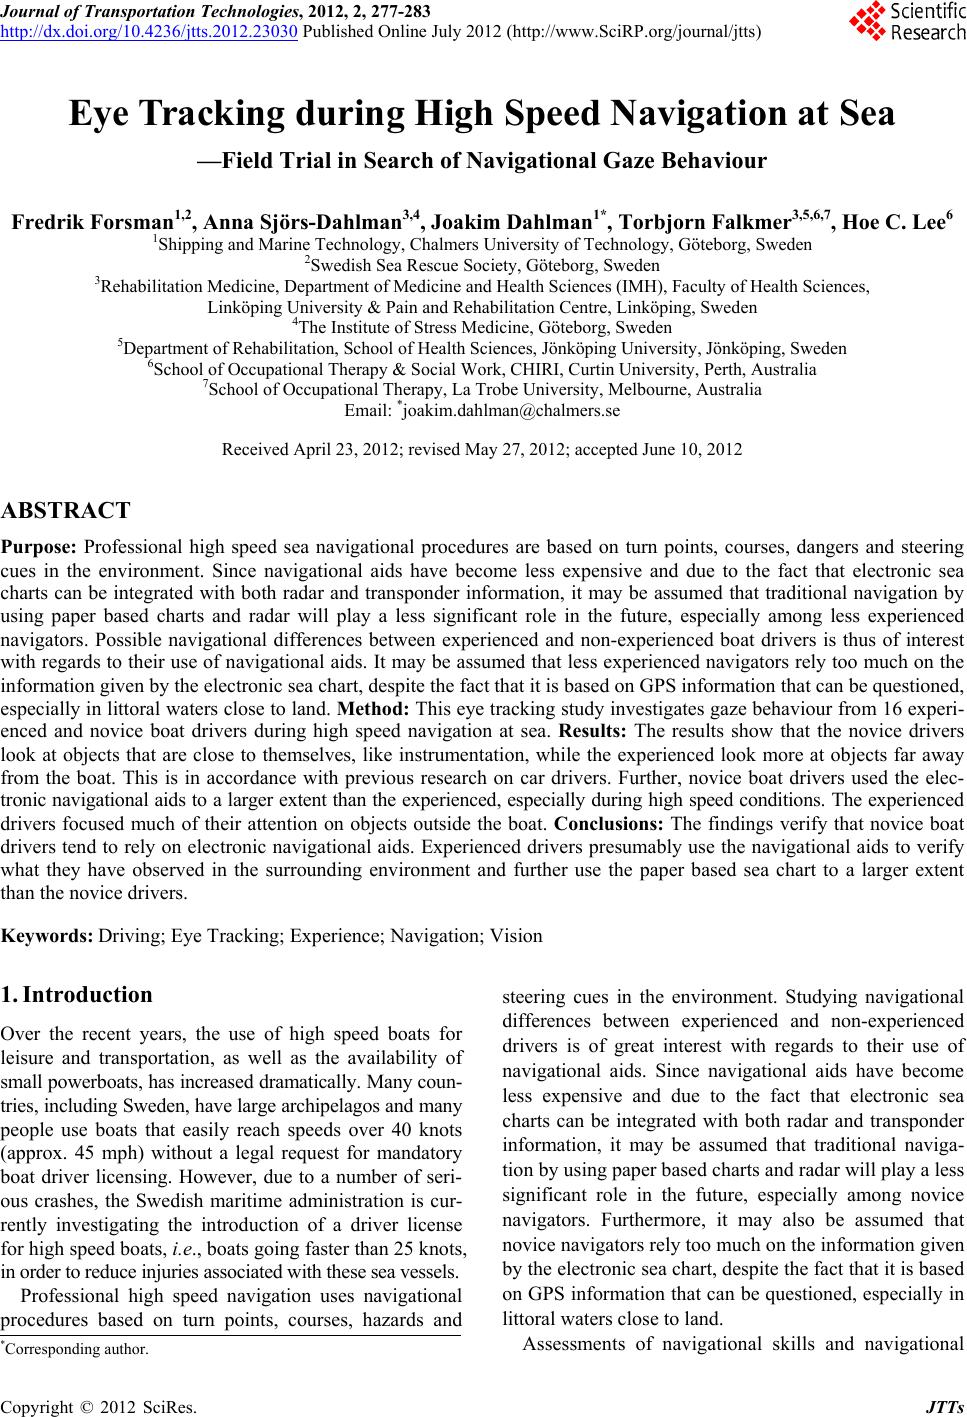
 Journal of Transportation Technologies, 2012, 2, 277-283 http://dx.doi.org/10.4236/jtts.2012.23030 Published Online July 2012 (http://www.SciRP.org/journal/jtts) Eye Tracking during High Speed Navigation at Sea —Field Trial in Search of Navigational Gaze Behaviour Fredrik Forsman1,2, Anna Sjörs-Dahlman3,4, Joakim Dahlman1*, Torbjorn Falkmer3,5,6,7, Hoe C. Lee6 1Shipping and Marine Technology, Chalmers University of Technology, Göteborg, Sweden 2Swedish Sea Rescue Society, Göteborg, Sweden 3Rehabilitation Medicine, Department of Medicine and Health Sciences (IMH), Faculty of Health Sciences, Linköping University & Pain and Rehabilitation Centre, Linköping, Sweden 4The Institute of Stress Medicine, Göteborg, Sweden 5Department of Rehabilitation, School of Health Sciences, Jönköping University, Jönköping, Sweden 6School of Occupational Therapy & Social Work, CHIRI, Curtin University, Perth, Australia 7School of Occupational Therapy, La Trobe University, Melbourne, Australia Email: *joakim.dahlman@chalmers.se Received April 23, 2012; revised May 27, 2012; accepted June 10, 2012 ABSTRACT Purpose: Professional high speed sea navigational procedures are based on turn points, courses, dangers and steering cues in the environment. Since navigational aids have become less expensive and due to the fact that electronic sea charts can be integrated with both radar and transponder information, it may be assumed that traditional navigation by using paper based charts and radar will play a less significant role in the future, especially among less experienced navigators. Possible navigational differences between experienced and non-experienced boat drivers is thus of interest with regards to their use of navigational aids. It may be assumed that less experienced navigators rely too much on the information given by the electronic sea chart, despite the fact that it is based on GPS information that can be questioned, especially in littoral waters close to land. Method: This eye tracking study investigates gaze behaviour from 16 experi- enced and novice boat drivers during high speed navigation at sea. Results: The results show that the novice drivers look at objects that are close to themselves, like instrumentation, while the experienced look more at objects far away from the boat. This is in accordance with previous research on car drivers. Further, novice boat drivers used the elec- tronic navigational aids to a larger extent than the experienced, especially during high speed conditions. The experienced drivers focused much of their attention on objects outside the boat. Conclusions: The findings verify that novice boat drivers tend to rely on electronic navigational aids. Experienced drivers presumably use the navigational aids to verify what they have observed in the surrounding environment and further use the paper based sea chart to a larger extent than the novice drivers. Keywords: Driving; Eye Tracking; Experience; Navigation; Vision 1. Introduction Over the recent years, the use of high speed boats for leisure and transportation, as well as the availability of small powerboats, has increased dramatically. Many coun- tries, including Sweden, have large archipelagos and many people use boats that easily reach speeds over 40 knots (approx. 45 mph) without a legal request for mandatory boat driver licensing. However, due to a number of seri- ous crashes, the Swedish maritime administration is cur- rently investigating the introduction of a driver license for high speed boats, i.e., boats going faster than 25 knots, in order to reduce injuries associated with these sea vessels. Professional high speed navigation uses navigational procedures based on turn points, courses, hazards and steering cues in the environment. Studying navigational differences between experienced and non-experienced drivers is of great interest with regards to their use of navigational aids. Since navigational aids have become less expensive and due to the fact that electronic sea charts can be integrated with both radar and transponder information, it may be assumed that traditional naviga- tion by using paper based charts and radar will play a less significant role in the future, especially among novice navigators. Furthermore, it may also be assumed that novice navigators rely too much on the information given by the electronic sea chart, despite the fact that it is based on GPS information that can be questioned, especially in littoral waters close to land. Assessments of navigational skills and navigational *Corresponding author. C opyright © 2012 SciRes. JTTs 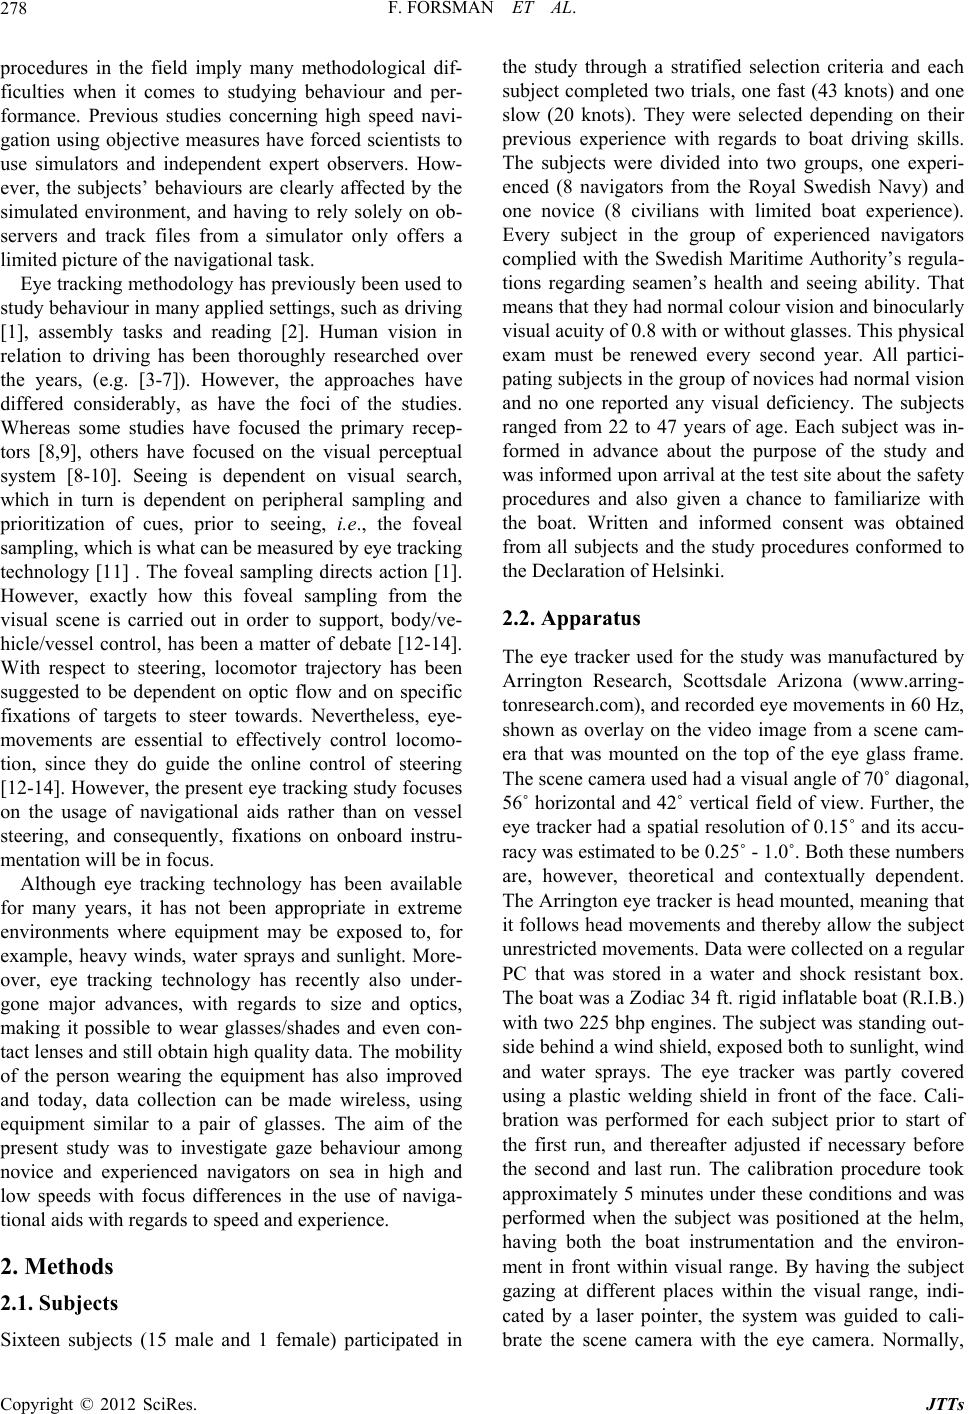 F. FORSMAN ET AL. 278 procedures in the field imply many methodological dif- ficulties when it comes to studying behaviour and per- formance. Previous studies concerning high speed navi- gation using objective measures have forced scientists to use simulators and independent expert observers. How- ever, the subjects’ behaviours are clearly affected by the simulated environment, and having to rely solely on ob- servers and track files from a simulator only offers a limited picture of the navigational task. Eye tracking methodology has previously been used to study behaviour in many applied settings, such as driving [1], assembly tasks and reading [2]. Human vision in relation to driving has been thoroughly researched over the years, (e.g. [3-7]). However, the approaches have differed considerably, as have the foci of the studies. Whereas some studies have focused the primary recep- tors [8,9], others have focused on the visual perceptual system [8-10]. Seeing is dependent on visual search, which in turn is dependent on peripheral sampling and prioritization of cues, prior to seeing, i.e ., the foveal sampling, which is what can be measured by eye tracking technology [11] . The foveal sampling directs action [1]. However, exactly how this foveal sampling from the visual scene is carried out in order to support, body/ve- hicle/vessel control, has been a matter of debate [12-14]. With respect to steering, locomotor trajectory has been suggested to be dependent on optic flow and on specific fixations of targets to steer towards. Nevertheless, eye- movements are essential to effectively control locomo- tion, since they do guide the online control of steering [12-14]. However, the present eye tracking study focuses on the usage of navigational aids rather than on vessel steering, and consequently, fixations on onboard instru- mentation will be in focus. Although eye tracking technology has been available for many years, it has not been appropriate in extreme environments where equipment may be exposed to, for example, heavy winds, water sprays and sunlight. More- over, eye tracking technology has recently also under- gone major advances, with regards to size and optics, making it possible to wear glasses/shades and even con- tact lenses and still obtain high quality data. The mobility of the person wearing the equipment has also improved and today, data collection can be made wireless, using equipment similar to a pair of glasses. The aim of the present study was to investigate gaze behaviour among novice and experienced navigators on sea in high and low speeds with focus differences in the use of naviga- tional aids with regards to speed and experience. 2. Methods 2.1. Subjects Sixteen subjects (15 male and 1 female) participated in the study through a stratified selection criteria and each subject completed two trials, one fast (43 knots) and one slow (20 knots). They were selected depending on their previous experience with regards to boat driving skills. The subjects were divided into two groups, one experi- enced (8 navigators from the Royal Swedish Navy) and one novice (8 civilians with limited boat experience). Every subject in the group of experienced navigators complied with the Swedish Maritime Authority’s regula- tions regarding seamen’s health and seeing ability. That means that they had normal colour vision and binocularly visual acuity of 0.8 with or without glasses. This physical exam must be renewed every second year. All partici- pating subjects in the group of novices had normal vision and no one reported any visual deficiency. The subjects ranged from 22 to 47 years of age. Each subject was in- formed in advance about the purpose of the study and was informed upon arrival at the test site about the safety procedures and also given a chance to familiarize with the boat. Written and informed consent was obtained from all subjects and the study procedures conformed to the Declaration of Helsinki. 2.2. Apparatus The eye tracker used for the study was manufactured by Arrington Research, Scottsdale Arizona (www.arring- tonresearch.com), and recorded eye movements in 60 Hz, shown as overlay on the video image from a scene cam- era that was mounted on the top of the eye glass frame. The scene camera used had a visual angle of 70˚ diagonal, 56˚ horizontal and 42˚ vertical field of view. Further, the eye tracker had a spatial resolution of 0.15˚ and its accu- racy was estimated to be 0.25˚ - 1.0˚. Both these numbers are, however, theoretical and contextually dependent. The Arrington eye tracker is head mounted, meaning that it follows head movements and thereby allow the subject unrestricted movements. Data were collected on a regular PC that was stored in a water and shock resistant box. The boat was a Zodiac 34 ft. rigid inflatable boat (R.I.B.) with two 225 bhp engines. The subject was standing out- side behind a wind shield, exposed both to sunlight, wind and water sprays. The eye tracker was partly covered using a plastic welding shield in front of the face. Cali- bration was performed for each subject prior to start of the first run, and thereafter adjusted if necessary before the second and last run. The calibration procedure took approximately 5 minutes under these conditions and was performed when the subject was positioned at the helm, having both the boat instrumentation and the environ- ment in front within visual range. By having the subject gazing at different places within the visual range, indi- cated by a laser pointer, the system was guided to cali- brate the scene camera with the eye camera. Normally, Copyright © 2012 SciRes. JTTs 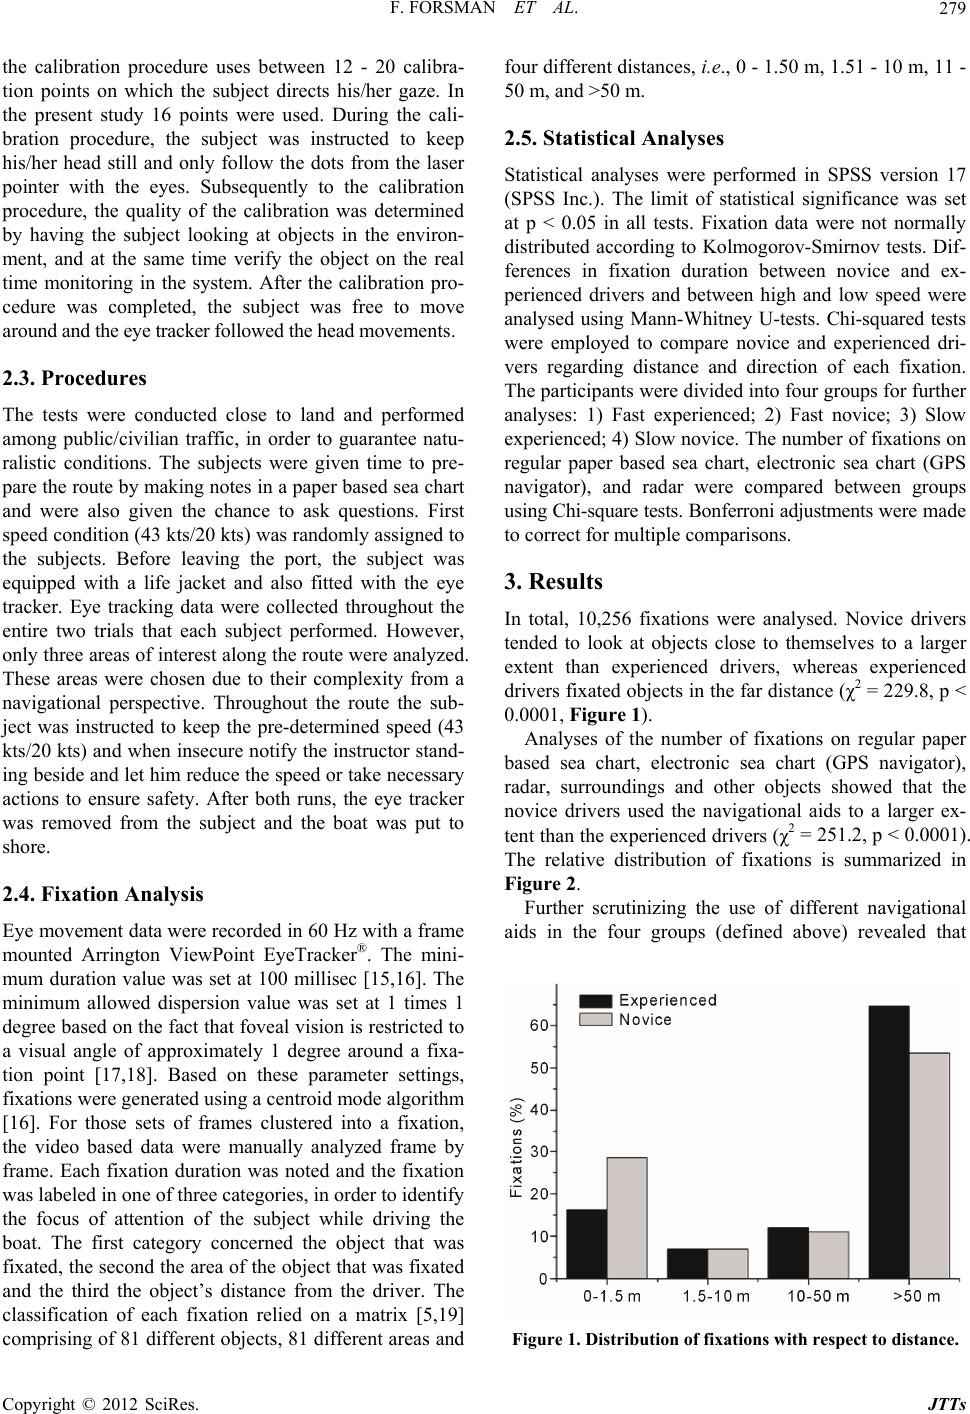 F. FORSMAN ET AL. 279 the calibration procedure uses between 12 - 20 calibra- tion points on which the subject directs his/her gaze. In the present study 16 points were used. During the cali- bration procedure, the subject was instructed to keep his/her head still and only follow the dots from the laser pointer with the eyes. Subsequently to the calibration procedure, the quality of the calibration was determined by having the subject looking at objects in the environ- ment, and at the same time verify the object on the real time monitoring in the system. After the calibration pro- cedure was completed, the subject was free to move around and the eye tracker followed the head movements. 2.3. Procedures The tests were conducted close to land and performed among public/civilian traffic, in order to guarantee natu- ralistic conditions. The subjects were given time to pre- pare the route by making notes in a paper based sea chart and were also given the chance to ask questions. First speed condition (43 kts/20 kts) was randomly assigned to the subjects. Before leaving the port, the subject was equipped with a life jacket and also fitted with the eye tracker. Eye tracking data were collected throughout the entire two trials that each subject performed. However, only three areas of interest along the route were analyzed. These areas were chosen due to their complexity from a navigational perspective. Throughout the route the sub- ject was instructed to keep the pre-determined speed (43 kts/20 kts) and when insecure notify the instructor stand- ing beside and let him reduce the speed or take necessary actions to ensure safety. After both runs, the eye tracker was removed from the subject and the boat was put to shore. 2.4. Fixation Analysis Eye movement data were recorded in 60 Hz with a frame mounted Arrington ViewPoint EyeTracker®. The mini- mum duration value was set at 100 millisec [15,16]. The minimum allowed dispersion value was set at 1 times 1 degree based on the fact that foveal vision is restricted to a visual angle of approximately 1 degree around a fixa- tion point [17,18]. Based on these parameter settings, fixations were generated using a centroid mode algorithm [16]. For those sets of frames clustered into a fixation, the video based data were manually analyzed frame by frame. Each fixation duration was noted and the fixation was labeled in one of three categories, in order to identify the focus of attention of the subject while driving the boat. The first category concerned the object that was fixated, the second the area of the object that was fixated and the third the object’s distance from the driver. The classification of each fixation relied on a matrix [5,19] comprising of 81 different objects, 81 different areas and four different distances, i.e., 0 - 1.50 m, 1.51 - 10 m, 11 - 50 m, and >50 m. 2.5. Statistical Analyses Statistical analyses were performed in SPSS version 17 (SPSS Inc.). The limit of statistical significance was set at p < 0.05 in all tests. Fixation data were not normally distributed according to Kolmogorov-Smirnov tests. Dif- ferences in fixation duration between novice and ex- perienced drivers and between high and low speed were analysed using Mann-Whitney U-tests. Chi-squared tests were employed to compare novice and experienced dri- vers regarding distance and direction of each fixation. The participants were divided into four groups for further analyses: 1) Fast experienced; 2) Fast novice; 3) Slow experienced; 4) Slow novice. The number of fixations on regular paper based sea chart, electronic sea chart (GPS navigator), and radar were compared between groups using Chi-square tests. Bonferroni adjustments were made to correct for multiple comparisons. 3. Results In total, 10,256 fixations were analysed. Novice drivers tended to look at objects close to themselves to a larger extent than experienced drivers, whereas experienced drivers fixated objects in the far distance (χ2 = 229.8, p < 0.0001, Figure 1). Analyses of the number of fixations on regular paper based sea chart, electronic sea chart (GPS navigator), radar, surroundings and other objects showed that the novice drivers used the navigational aids to a larger ex- tent than the experienced drivers (χ2 = 251.2, p < 0.0001). The relative distribution of fixations is summarized in Figure 2. Further scrutinizing the use of different navigational aids in the four groups (defined above) revealed that Figure 1. Distribution of fixations with respect to distance. Copyright © 2012 SciRes. JTTs 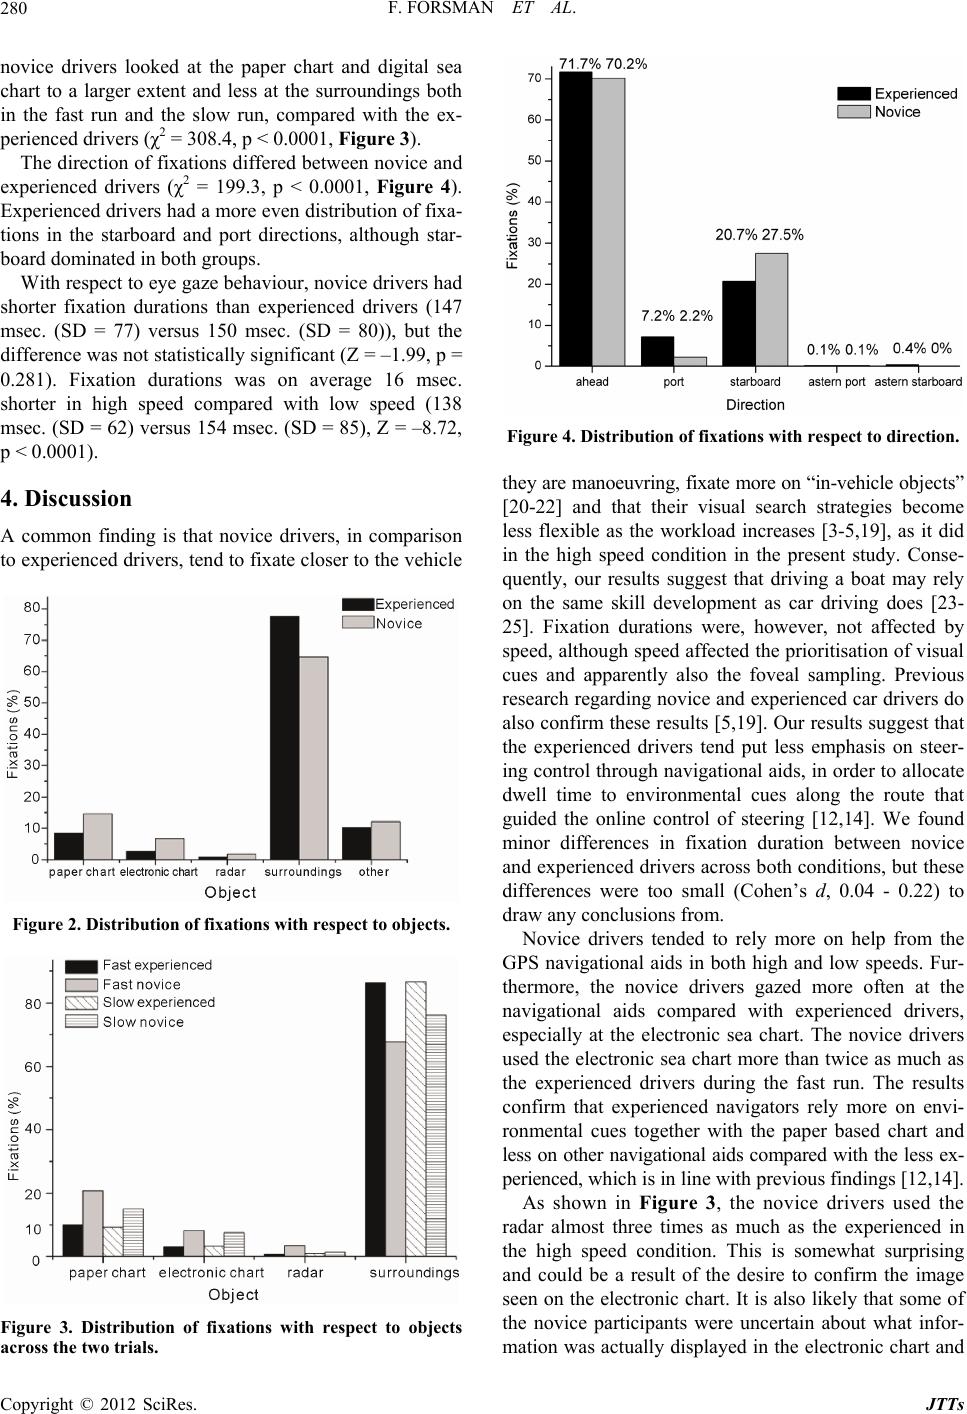 F. FORSMAN ET AL. 280 novice drivers looked at the paper chart and digital sea chart to a larger extent and less at the surroundings both in the fast run and the slow run, compared with the ex- perienced drivers (χ2 = 308.4, p < 0.0001, Fi gur e 3). The direction of fixations differed between novice and experienced drivers (χ2 = 199.3, p < 0.0001, Figure 4). Experienced drivers had a more even distribution of fixa- tions in the starboard and port directions, although star- board dominated in both groups. With respect to eye gaze behaviour, novice drivers had shorter fixation durations than experienced drivers (147 msec. (SD = 77) versus 150 msec. (SD = 80)), but the difference was not statistically significant (Z = –1.99, p = 0.281). Fixation durations was on average 16 msec. shorter in high speed compared with low speed (138 msec. (SD = 62) versus 154 msec. (SD = 85), Z = –8.72, p < 0.0001). 4. Discussion A common finding is that novice drivers, in comparison to experienced drivers, tend to fixate closer to the vehicle Figure 2. Distribution of fixations with respect to objects. Figure 3. Distribution of fixations with respect to objects Figure 4. Distribution of fixations with respect to direc tion. ey are manoeuvring, fixate more on “in-vehicle objects” y more on help from the G ra th [20-22] and that their visual search strategies become less flexible as the workload increases [3-5,19], as it did in the high speed condition in the present study. Conse- quently, our results suggest that driving a boat may rely on the same skill development as car driving does [23- 25]. Fixation durations were, however, not affected by speed, although speed affected the prioritisation of visual cues and apparently also the foveal sampling. Previous research regarding novice and experienced car drivers do also confirm these results [5,19]. Our results suggest that the experienced drivers tend put less emphasis on steer- ing control through navigational aids, in order to allocate dwell time to environmental cues along the route that guided the online control of steering [12,14]. We found minor differences in fixation duration between novice and experienced drivers across both conditions, but these differences were too small (Cohen’s d, 0.04 - 0.22) to draw any conclusions from. Novice drivers tended to rel PS navigational aids in both high and low speeds. Fur- thermore, the novice drivers gazed more often at the navigational aids compared with experienced drivers, especially at the electronic sea chart. The novice drivers used the electronic sea chart more than twice as much as the experienced drivers during the fast run. The results confirm that experienced navigators rely more on envi- ronmental cues together with the paper based chart and less on other navigational aids compared with the less ex- perienced, which is in line with previous findings [12,14]. As shown in Figure 3, the novice drivers used the dar almost three times as much as the experienced in the high speed condition. This is somewhat surprising and could be a result of the desire to confirm the image seen on the electronic chart. It is also likely that some of the novice participants were uncertain about what infor- mation was actually displayed in the electronic chart and across the two trials. Copyright © 2012 SciRes. JTTs  F. FORSMAN ET AL. 281 that it was assumed that it also included a radar overlay. Further, a somewhat surprising finding was that both groups tended to look more to starboard throughout the route. This can possibly be explained by the fact that the paper based sea chart was placed to the starboard side of the steering console in the boat and that the driver had to move his/her head to the right in order to look at the pa- per based chart. Since the use of regular paper based sea charts seemed to in gaze behaviour found may be partly ex n of the present study was that of any study ba t study was performed during daylight and m randomized order, it is possi- bl decrease with increased speed in the present study, it is reasonable to assume that it reflects the uncertainty and added cognitive demands that follow with increased speed [16,24]. The complexity of driving in high speeds forced the novice drivers to rely on electronic sea charts rather than on paper based charts. If no electronic sea charts had been available for the novice drivers, he/she would most likely have reduced the speed in attempts of regaining orientation. In order to understand the limita- tions of the electronic sea charts, the driver would have had to have experienced a situation prior to the trials, in which the navigational information given by the elec- tronic sea chart was incorrect. Considering the fact that the navigational information displayed is based on GPS information, it may display errors that potentially could result in crashes. The differences plained by how familiar the driver was in interpreting navigational information. As previously mentioned, no- vice drivers did look more at the radar than the experi- enced drivers did, which might indicate well-developed navigational tactics. During good visibility it is possible that the radar will not be as crucial as during poor visibi- lity. Furthermore, it might be more efficient to direct attention towards other information sources like the vis- ual cues in the environment. We believe that experts have a more efficient way of extracting information from the instruments, and therefore do not need to look at the instrument in the same extent and manor as the novice drivers did. A limitatio sed on eye tracker generated data. Eye movements, however precisely measured by eye trackers, only reflect the foveal direction of the eye [18]. Thus, analyses of eye movement data needs to take into account the anatomy and physiology of the human visual system [16]. The visual system consists of two sub-systems, foveal and peripheral vision. Foveal vision is restricted to a visual angle of approximately 1 around a fixation point [17,18]. It provides a person with high-resolution information, which supports capabilities such as recognition [26]. Pe- ripheral vision enables a person to detect changes in con- trast and movement, but with decreased visual acuity. Peripheral vision supports capabilities such as the per- son’s orientation, but without the person being fully conscious of this process [27]. These two systems oper- ate simultaneously and are dependent on each other. For example, when driving, the driver uses his foveal vision to detect directional cues [28], which may labelled as focal or the “what”, since it is fixating a stimulus to ap- preciate its fine detail [29], while the peripheral system is used to maintain lateral control of the vehicle [22], that in turn could be labeled ambient, or the “where” in human the visual system, since it detects of motion, optic flow, changes in objects. Peripheral vision also provides the driver with a wide range of visual information from which the foveal sampling of features takes place. The visual sampling is based on cognitive processes [18]. The sampling process is dependent on eye movements [11]. Eye movements are directed by an individual schema of the driver [30], which is updated with information ga- thered both by peripheral and foveal sampling. The goal of this information gathering is to identify certain fea- tures in the environment, in order to control a vehicle/ vessel. There is laboratory evidence that a foveal fixation point, which is what we measured in the present study, does not necessarily represent visual attention [31,32]. A change in the focus of visual attention is possible without a change in the point of fixation. However, it is not pos- sible to change the fixation point without changing the focus of visual attention [33], which suggests that every time a new object was fixated, it represented a shift of visual focus. The presen ost often under optimal conditions with regards to wave height and weather, which of course, to some ex- tent, facilitated the use of the eye tracker and also made navigation easier, but on the other hand also made eye tracking more difficult with regards to sunlight, etc. Al- though the eye tracker used allows the subject to move around and also follow the head movements, the drivers were informed not only to gaze but also to follow the gaze direction with the head. Gaze behaviour normally does not require head movements if the object of interest is within visual range. However with regards to the eye trackers limited visual angle of 70˚ diagonal, 56˚ hori- zontal and 42˚ vertical it will not detect fixations outside this unless the head follows the gaze direction. Further, the participants could have been influenced by the fact that we informed them about the purpose of the study prior to the trials. This might have resulted in a biased behaviour and that a potential overreliance in any one of the navigational aids was reduced. The fact that we also had an onboard navigational instructor during the trials might have influenced the participants both to become more or less risk taking. Lastly, despite having a e that the participants experienced a learning effect when conducting the second round of the leg. Future Copyright © 2012 SciRes. JTTs  F. FORSMAN ET AL. 282 studies using eye tracking during high speed navigation should study gaze order effects of which navigational aid that is used, at what time, in order to answer were the information processing starts and ends. 5. Acknowledgements the frame-by-frame video REFERENCES [1] T. Falkmer, “ing as a Tool f ual Task Performance, G. Underwood, “Visual Search of AUW Consulting performed analyses. Eye Movement Recordor Accident in-Depth Investigations—A Pilot Study,” Road Safety on Three Continents, 2000. [2] T. Dukic, “Visual Demand in Man in Department of Product and Production Development,” Ph.D. Thesis, Chalmers University of Technology, Göte- borg, 2006, p. 410. [3] P. R. Chapman and Driving Situations: Danger and Experience,” Perception, Vol. 27, No. 8, 1998, pp. 951-946. doi:10.1068/p270951 [4] D. E. Crundall and G. Underwood, “Effects of Experience and Processing Demands on Visual Information Acquisi- tion in Drivers,” Ergonomics, Vol. 41, No. 4, 1998, pp. 448-458. doi:10.1080/001401398186937 [5] T. Falkmer and N. P. Gregersen, “A Comparison of Eye Movement Behavior of Inexperienced and Experienced Drivers in Real Traffic Environments,” Optometry and Vision Sciences, Vol. 82, 2005, pp. 732-739. doi:10.1097/01.opx.0000175560.45715.5b [6] C. Owsley, et al., “Vision Impairment and Driving,” Sur- vey of Ophthalmology, Vol. 43, No. 6, 1999, pp. 535-550. doi:10.1016/S0039-6257(99)00035-1 [7] D. D. Salvucci and A. Liu, “The Time Course of a Lane Change: Driver Control and Eye-Movement Behavior,” Transportation Research Part F: Traffic Psychology and Behavior, Vol. 5, No. 2, 2002, pp. 123-132. doi:10.1016/S1369-8478(02)00011-6 [8] C. Owsley, B. T. Stalvey, J. Wells, M. E. Sloane and J. G erry, “Bilateral Cataract Sur- . McGwin, “Visual Risk Factors for Crash Involvement in Older Drivers with Cataract,” Ophthalmology, Vol. 119, No. 6, 2001, pp. 881-887. [9] J. M. Wood and T. P. Carb gery and Driving Performance,” British Journal of Oph- talmology, Vol. 90, No. 10, 2006, pp. 1277-1280. doi:10.1136/bjo.2006.096057 [10] A. R. Bowers, A. Mandel, J., R. B. Goldstein and E. Peli, “Driving with Hemianopia, I: Detection Performance in a Driving Simulator,” Invest Ophtalmol Visual Science, Vol. 50, No. 11, 2009, pp. 5137-5147. doi:10.1167/iovs.09-3799 [11] T. C. Lansdown, “Visual Demand and the Introduction of W. H. Warren, “Behavioral Dynamics of Steering, Obstacle Avoidance, and Route Selection Advanced Driver Information Systems into Road Vehi- cles,” Ph.D. Thesis, Laughborough University, Lough- borough, 1996. [12] B. R. Fajen and ,” Journal of Experimental Psychology: Human Perception and Performance, Vol. 29, No. 2, 2003, pp. 343-362. doi:10.1037/0096-1523.29.2.343 [13] K. D. Robertshaw and R. M. Wilkie, “Does Gaze Infl ence Steering around a Bend?” Jo u- urnal of Vision, Vol. 8, No. 4, 2008, pp. 1-13. doi:10.1167/8.4.18 [14] R. M. Wilkie, G. K. Kountouriotis, N. Merat and J. P. Wann, “Using Vision to Control Locomotion: Looking Where You Want to Go,” Experimental Brain Research, Vol. 204, No. 4, 2010, pp. 539-547. doi:10.1007/s00221-010-2321-4 [15] A. S. Cohen, “Is the Duration of an Ey cient Criterion Referring to Information Input e Fixation Suffi- ?” Percep- tual and Motor Skills, Vol. 45, 1977, p. 766. doi:10.2466/pms.1977.45.3.766 [16] T. Falkmer, J. Dahlman, T. Dukic, A. Bjällm Larsson, “Fixation Identificati ark and M. on in Centroid versus Start-Point Modes Using Eye Tracking Data,” Perceptual and Motor Skills, Vol. 106, No. 3, 2008, pp. 710-724. doi:10.2466/pms.106.3.710-724 [17] A. T. Duchowski, “Eye Tracking Methodology, Theo and Practice,” Springer, London, ry 2003. pprentices with and without Ce- [18] A. L. Yarbus, “Eye Movements and Vision,” Plenum Press, New York, 1967. [19] T. Falkmer and N. P. Gregersen, “Fixations among Ex- perienced Drivers and A rebral Palsy, in Real Traffic Environments,” Transporta- tion Research Part F: Traffic Psychology and Behavior, Vol. 4, No. 3, 2001, pp. 171-185. doi:10.1016/S1369-8478(01)00021-3 [20] R. R. Mourant and T. H. Rockwe Movement Patterns to the Visual Scene ll, “Mapping Eye- in Driving: An pists Can Help Each Other to Better Under- Exploratory Study,” Human Factors, Vol. 14, 1970, pp. 325-335. [21] T. A. Ranney and L. A. Hunt, “Researchers and Occupa- tional Thera stand What Makes a Good Driver: Two Perspectives,” Work, Vol. 8, 1997, pp. 293-297. doi:10.1016/S1051-9815(96)00249-5 [22] T. H. Rockwell, “Eye Movement An formation Acquisition in Driving,” A alysis of Visual In- ustralian Research , “Effect of Driving Experience on Visuals , and Task Demands, on Interference from a Board, 1972. [23] L. Nabatilan, F. Aghazadeh, A. Nimbarte, C. Harvey and S. Chowdhury Behavior and Driving Performance under Different Driv- ing Conditions,” Cognition, Technology & Work, 2011, pp. 1-9. [24] D. Shinar, N. Tractinsky and R. Compton, “Effects of Practice, Age Phone Task While Driving,” Accident Analysis and Pre- vention, Vol. 37, No. 2, 2005, pp. 315-326. doi:10.1016/j.aap.2004.09.007 [25] D. Crundall, G. Underwood and P. Chapm Experience and the Functional F an, “Driving ield of View,” Perception, Vol. 28, No. 9, 1999, pp. 1075-1088. doi:10.1068/p2894 [26] S. Samuelsson, T. Falkmer and L. Nilsson, “Om Möj- ligheterna att Upptäcka och Identifiera Perifiert Pre- senterad Information i Bilen (in Swedish),” VTI, Linkö- Copyright © 2012 SciRes. JTTs  F. FORSMAN ET AL. Copyright © 2012 SciRes. JTTs 283 ision and Some Implications,” Annual Hu- ping, 1996. [27] H. Leibowitz, “Recent Advances in Our Understanding of Peripheral V man Factors ans Ergonimics Society Meeting. 1986. [28] W. Spijkers, “Distribution of Eye-Fixations during Driv- ing,” IATSS Research, Vol. 16, 1992, pp. 27-34. [29] D. Ingle, G. Schneider, C. Trevarthen and R. Held, “Lo- cating and Identifying: Two Modes of Visual Process- ing,” Psychological Research, Vol. 31, No. 1, 1967, pp. 42-44. doi:10.1007/BF00422384 [30] U. Neisser, “Cognitive Psychology,” Appelton-Century -Crofts, New York, 1967. [31] M. Groner, et al., “Can We Use Eye Tracking to Support Problem Solving?” Thirteenth European Conference on Eye Movements ECEM13, Bern, 2005. [32] M. I. Possner, C. R. Snyder and B. J. Davidson, “Atten- tion and the Detection of Signals,” Journal of Experi- mental Psychology: General, Vol. 109, No. 2, 1980, pp. 160-174. doi:10.1037/0096-3445.109.2.160 [33] M. Shepard, J. M. Findlay and R. J. Hockey, “The Rela- tionship between Eye Movements and Spatial Attention,” Quarterly Journal of Experimental Psychology, Vol. 38, No. 3, 1986, pp. 475-491. doi:10.1080/14640748608401609
|