 Journal of Transportation Technologies, 2012, 2, 248-259 http://dx.doi.org/10.4236/jtts.2012.23027 Published Online July 2012 (http://www.SciRP.org/journal/jtts) Performance Evaluation of Intelligent Adaptive Traffic Control Systems: A Case Study Saeed Samadi1, Ali Pajoumand Rad2, Farhad Mohammad Kazemi3, Hamed Jafarian2 1Department of EE, Research Institute of Food Science & Technology, Mashhad, Iran 2Mashhad Traffic Control Center, Mashhad Traffic and Transportation Organization, Mashhad, Iran 3Department of Computer Engineering, Payame Noor University, Mashhad, Iran Email: s.samadi@rifst.ac.ir Received April 12, 2012; revised May 13, 2012; accepted June 3, 2012 ABSTRACT Mashhad, the second largest city in Iran, like many other big cities, is faced with increasing traffic congestion owing to rapidly increasing population and annual pilgrimage. In recent years, Mashhad traffic and transportation authorities have been challenged with how to manage the increasing congestion with limited budgets for major roadway construc- tion projects. Mashhad has recognized the need to improve the existing system capacity to get th e most out of their cur- rent transportation system infrastructures. Since most of the delay ti mes occur at signalized intersectio ns, using an intel- ligent control system with proper cap abilities to overcome the growing traffic requirements is reco mmen ded. Fo llowing comprehensive studies carried out with the aim of developing the Mashhad traffic control center, the SCATS adaptive traffic control system was introduced as the selected intelligent control system for integrating signalized intersections. The first intersection was equipped with this system in 2005. This paper describes the results of a field evaluation in which fixed actuated-coordinated signal timings are compared with those dynamically computed by SCATS. The ef- fects of this system on optimizing fuel consumption as well as reducing air pollutants are fully discussed. It is found that SCATS consistently reduced travel times and the average delay per stopped or appro a ching vehicle. The positive impact of adaptive traffic control systems on fuel consumption and air pollution are also highlighted. Keywords: ITS; Adaptive Traffic Control; SCATS; Measure of Effectiveness; Delay; Travel Time 1. Introduction Intelligent Transportation Systems, or ITS, can be de- fined as the application of computing, information, and communications technologies to the real-time manage- ment of vehicles and networks involving the movement of people, goods, and services. When integrated into the transportation system’s infrastructure, and into vehicles themselves, these technologies relieve congestion, im- prove safety, and enhan ce productivity. Intellig ent Trans- portation Systems (ITS) encompasses a broad range of wireless and wire line communications-based informa- tion and electronics technologies [1]. Advanced Traffic Management System (ATMS) is a major subsystem of ITS, and real-time traffic control is considered to be one of the main operational processes of ATMS, with the aim of implementing adaptive traffic systems (Figure 1). The objects of this process are: 1) To minimize congestion while maximizing the movement of people and goods; 2) To improv e the flow of traffic; and 3) To manage travel demand and prioritize it. The net- work of streets and roads plays an important role in ur- ban traffic systems, and the quality of managing this network determines the success or failure of the whole system. Therefore, intersection control has its specific and important place as the most effective parameter in- fluencing the quality o f controlling street networks [2]. This paper describes the results of a field evaluation in which fixed actuated-coordinated signal timings are com- pared with those dynamically computed by the SCATS adaptive traffic control system. Travel times, travel time stopped, delays, and number of stops were collected by driving probe vehicles on the major selected routes, and information was extracted from traffic surveillance video cameras. Then, the main measures of effectiveness which are used in investigating the traffic condition of intersec- tions are intr oduced, and the methodolog y of the study is also described. Finally, the results of studies carried out before and after using SCATS at selected intersections are fully analyzed. 2. Signalized Intersections Control Systems 2.1. Pre-Time System It is the simplest method for controlling the traffic load C opyright © 2012 SciRes. JTTs 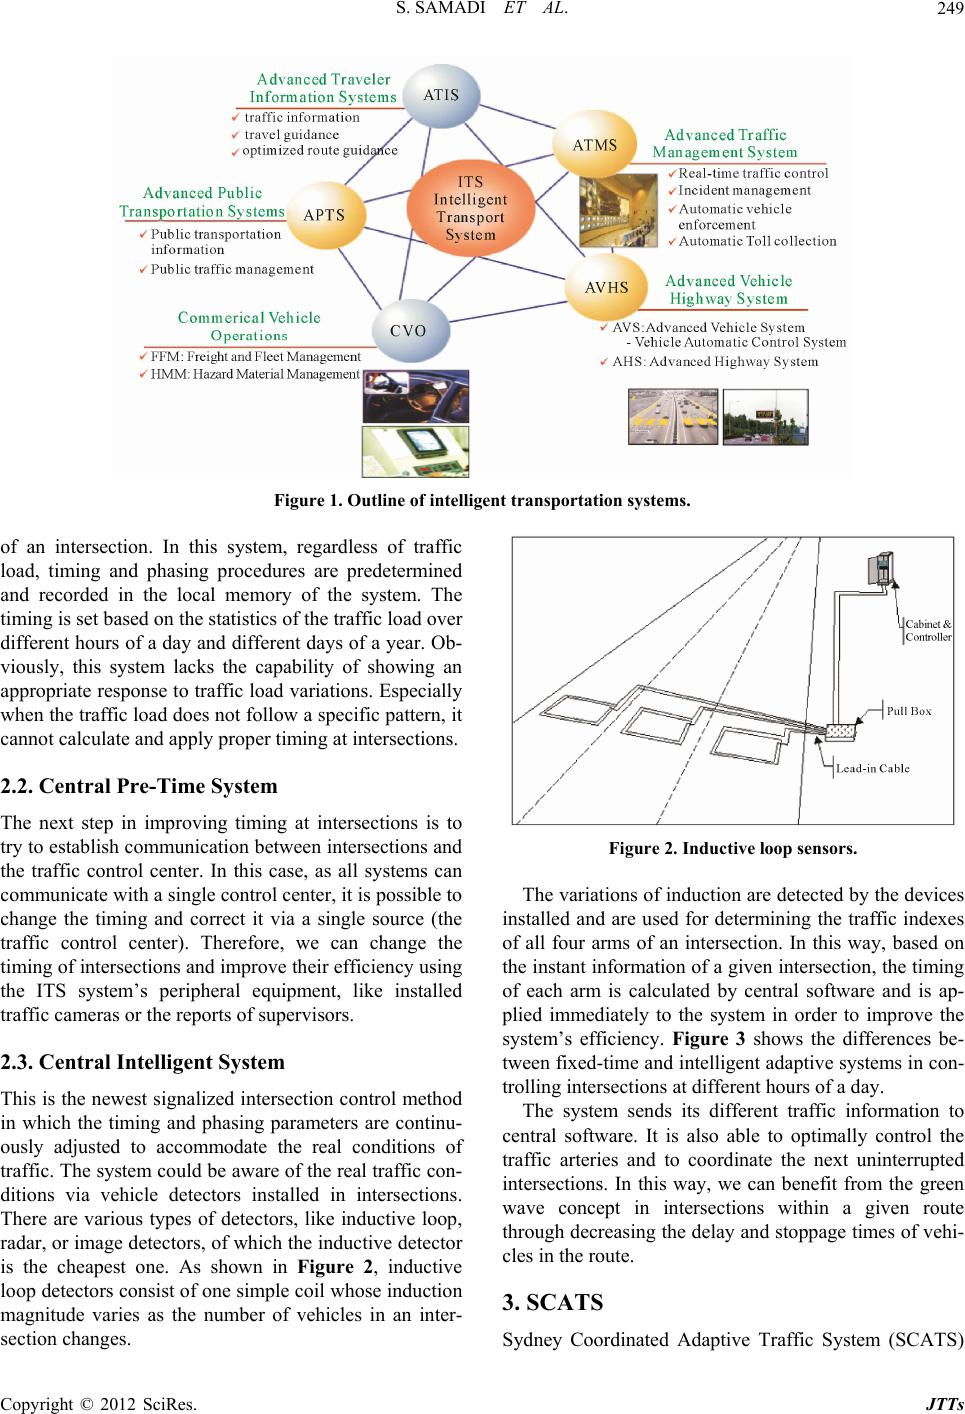 S. SAMADI ET AL. 249 Figure 1. Outline of intelligent transportation systems. of an intersection. In this system, regardless of traffic load, timing and phasing procedures are predetermined and recorded in the local memory of the system. The timing is set based on the statistics of the traffic load over differen t hours of a day and different days of a year. Ob- viously, this system lacks the capability of showing an appropriate response to traffic load variations. Especially when the traffic load does not follow a specific pattern, it cannot calculate and ap ply proper timing at intersections. 2.2. Central Pre-Time System The next step in improving timing at intersections is to try to establish communication b etween intersections and the traffic control center. In this case, as all systems can communicate with a single control center, it is possible to change the timing and correct it via a single source (the traffic control center). Therefore, we can change the timing of intersections and improve their efficiency using the ITS system’s peripheral equipment, like installed traffic cameras or the reports of supervisors. 2.3. Central Intelligent System This is the newest signalized intersection control method in which the timing and phasing parameters are continu- ously adjusted to accommodate the real conditions of traffic. The system could be aware of the real traffic con- ditions via vehicle detectors installed in intersections. There are various types of detectors, like inductive loop, radar, or image detectors, of which the inductive detector is the cheapest one. As shown in Figure 2, inductive loop detectors consist of one simple coil whose induction magnitude varies as the number of vehicles in an inter- section changes. Figure 2. Inductive loop sensors. The variations of induction are detected by the devices installed and are used for determining the traffic indexes of all four arms of an intersection. In this way, based on the instant information of a given in tersection, the timing of each arm is calculated by central software and is ap- plied immediately to the system in order to improve the system’s efficiency. Figure 3 shows the differences be- tween fixed-time and intellig ent adaptive systems in con - trolling intersection s at different hours of a day. The system sends its different traffic information to central software. It is also able to optimally control the traffic arteries and to coordinate the next uninterrupted intersections. In this way, we can benefit from the green wave concept in intersections within a given route through decreasing the delay and stoppage times of vehi- cles in the route. 3. SCATS Sydney Coordinated Adaptive Traffic System (SCATS) Copyright © 2012 SciRes. JTTs 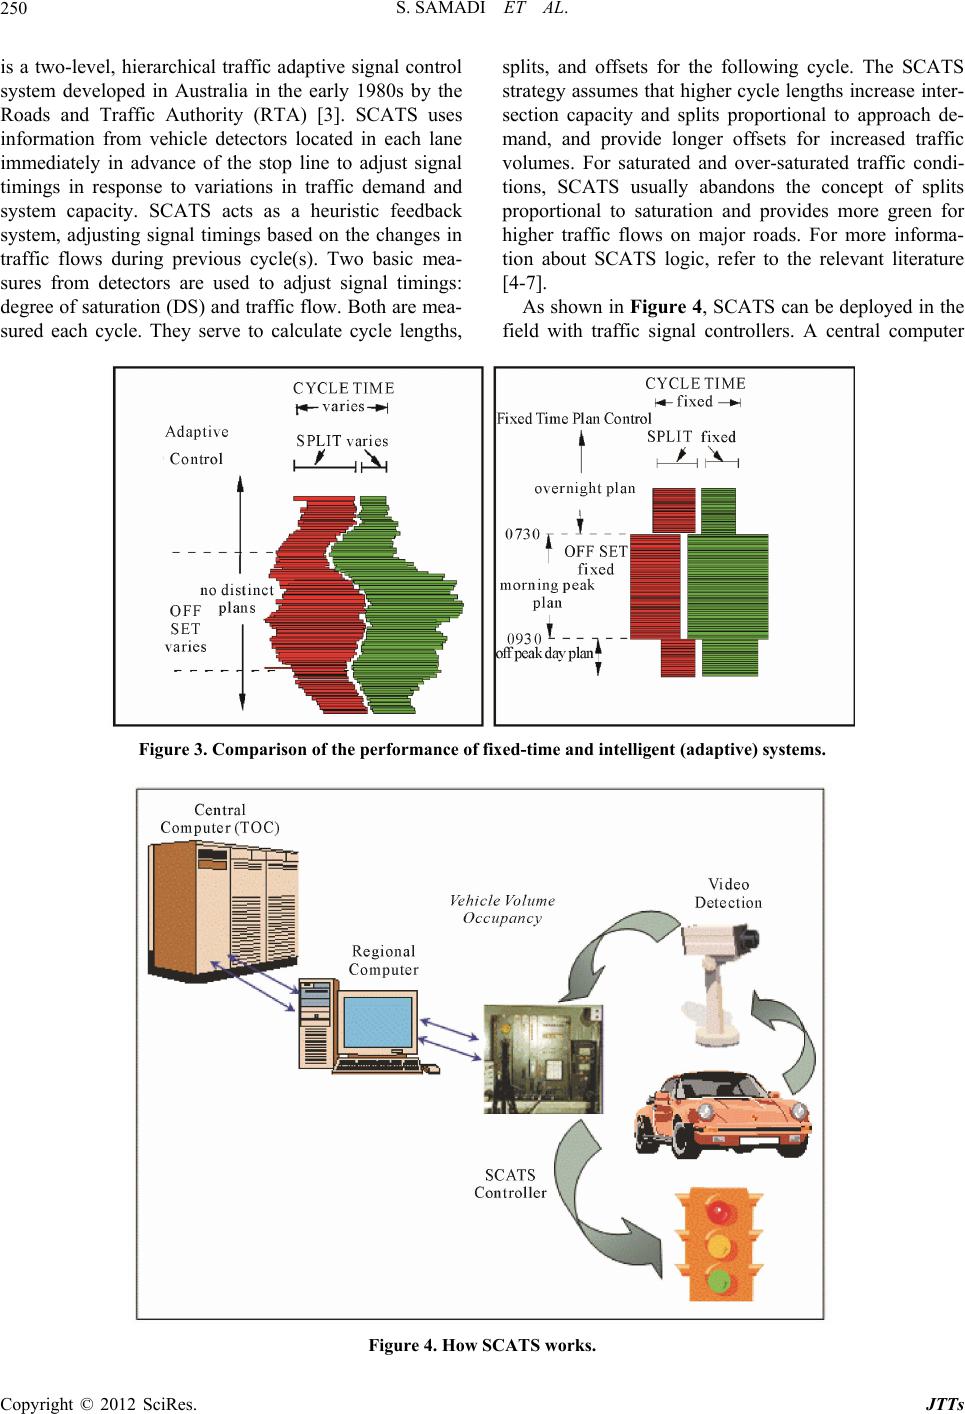 S. SAMADI ET AL. 250 is a two-level, hierarchical traffic adaptive signal control system developed in Australia in the early 1980s by the Roads and Traffic Authority (RTA) [3]. SCATS uses information from vehicle detectors located in each lane immediately in advance of the stop line to adjust signal timings in response to variations in traffic demand and system capacity. SCATS acts as a heuristic feedback system, adjusting signal timings based on the changes in traffic flows during previous cycle(s). Two basic mea- sures from detectors are used to adjust signal timings: degree of saturation (DS) and traffic flow. Both are mea- sured each cycle. They serve to calculate cycle lengths, splits, and offsets for the following cycle. The SCATS strategy assumes that higher cycle lengths increase inter- section capacity and splits proportional to approach de- mand, and provide longer offsets for increased traffic volumes. For saturated and over-saturated traffic condi- tions, SCATS usually abandons the concept of splits proportional to saturation and provides more green for higher traffic flows on major roads. For more informa- tion about SCATS logic, refer to the relevant literature [4-7]. As shown in Figure 4, SCATS can be deployed in the field with traffic signal controllers. A central computer Figure 3. Comparison of the performance of fixed-time and intelligent (adaptive) systems. Figure 4. How SCATS works. Copyright © 2012 SciRes. JTTs 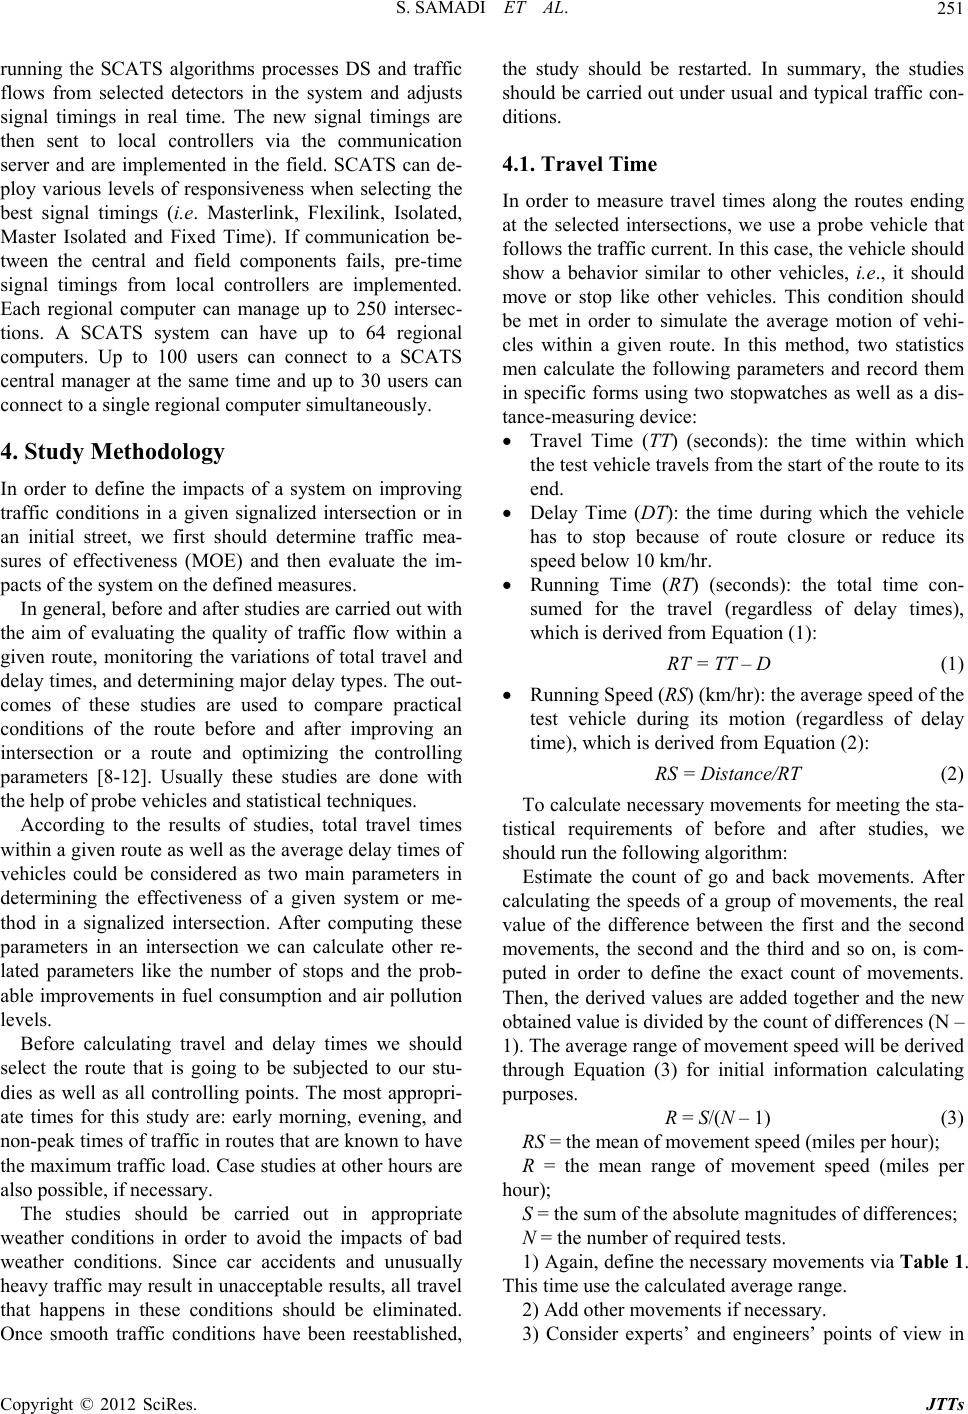 S. SAMADI ET AL. 251 running the SCATS algorithms processes DS and traffic flows from selected detectors in the system and adjusts signal timings in real time. The new signal timings are then sent to local controllers via the communication server and are implemented in the field. SCATS can de- ploy various levels of responsiveness when selecting the best signal timings (i.e. Masterlink, Flexilink, Isolated, Master Isolated and Fixed Time). If communication be- tween the central and field components fails, pre-time signal timings from local controllers are implemented. Each regional computer can manage up to 250 intersec- tions. A SCATS system can have up to 64 regional computers. Up to 100 users can connect to a SCATS central manager at the same time and up to 30 users can connect to a single regional computer simultaneously. 4. Study Methodology In order to define the impacts of a system on improving traffic conditions in a given signalized intersection or in an initial street, we first should determine traffic mea- sures of effectiveness (MOE) and then evaluate the im- pacts of the system on the defined measures. In general, before and after studies are carried out with the aim of evaluating the quality of traffic flow within a given route, monitoring the variations of total travel and delay times, and determining major delay types. The out- comes of these studies are used to compare practical conditions of the route before and after improving an intersection or a route and optimizing the controlling parameters [8-12]. Usually these studies are done with the help of probe vehicles and statistical techniques. According to the results of studies, total travel times within a given route as well as the average delay times of vehicles could be considered as two main parameters in determining the effectiveness of a given system or me- thod in a signalized intersection. After computing these parameters in an intersection we can calculate other re- lated parameters like the number of stops and the prob- able improvements in fuel consumption and air pollution levels. Before calculating travel and delay times we should select the route that is going to be subjected to our stu- dies as well as all controlling points. The most appropri- ate times for this study are: early morning, evening, and non-peak times of traffic in routes that are known to have the max imu m tr aff ic load . C ase studies at other hours are also possible, i f nec essa ry. The studies should be carried out in appropriate weather conditions in order to avoid the impacts of bad weather conditions. Since car accidents and unusually heavy traffic may result in unacceptable results, all travel that happens in these conditions should be eliminated. Once smooth traffic conditions have been reestablished, the study should be restarted. In summary, the studies should be carried out under usual and typical traffic con- ditions. 4.1. Travel Time In order to measure travel times along the routes ending at the selected intersections, we use a probe vehicle that follows the traffic current. In this case, the vehicle should show a behavior similar to other vehicles, i.e., it should move or stop like other vehicles. This condition should be met in order to simulate the average motion of vehi- cles within a given route. In this method, two statistics men calculate the following parameters and record them in specific forms using two stopwatches as well as a dis- tance-measuring device: Travel Time (TT) (seconds): the time within which the test vehicle travels from the start of the route to its end. Delay Time (DT): the time during which the vehicle has to stop because of route closure or reduce its speed below 10 km/hr. Running Time (RT) (seconds): the total time con- sumed for the travel (regardless of delay times), which is derived from Equati on (1): RT = TT – D (1) Running Speed (RS) (km/hr): th e av e r ag e s pe ed of the test vehicle during its motion (regardless of delay time), which is derived from Equation (2): RS = Distance/RT (2) To calculate necessary movements for meeting the sta- tistical requirements of before and after studies, we should run the following algorithm: Estimate the count of go and back movements. After calculating the speeds of a group of movements, the real value of the difference between the first and the second movements, the second and the third and so on, is com- puted in order to define the exact count of movements. Then, the derived values are added together and the new obtained value is divided by the count of differences (N – 1). The average range of movement speed will be d erived through Equation (3) for initial information calculating purposes. R = S/(N – 1) (3) RS = the mean of movement speed (miles per hour); R = the mean range of movement speed (miles per hour); S = the sum of the absolute magnitudes of differences; N = the number o f r equire d tests. 1) Again, define the necessary movements via Table 1. This time use the calculated average range. 2) Add other movements if necessary. 3) Consider experts’ and engineers’ points of view in Copyright © 2012 SciRes. JTTs 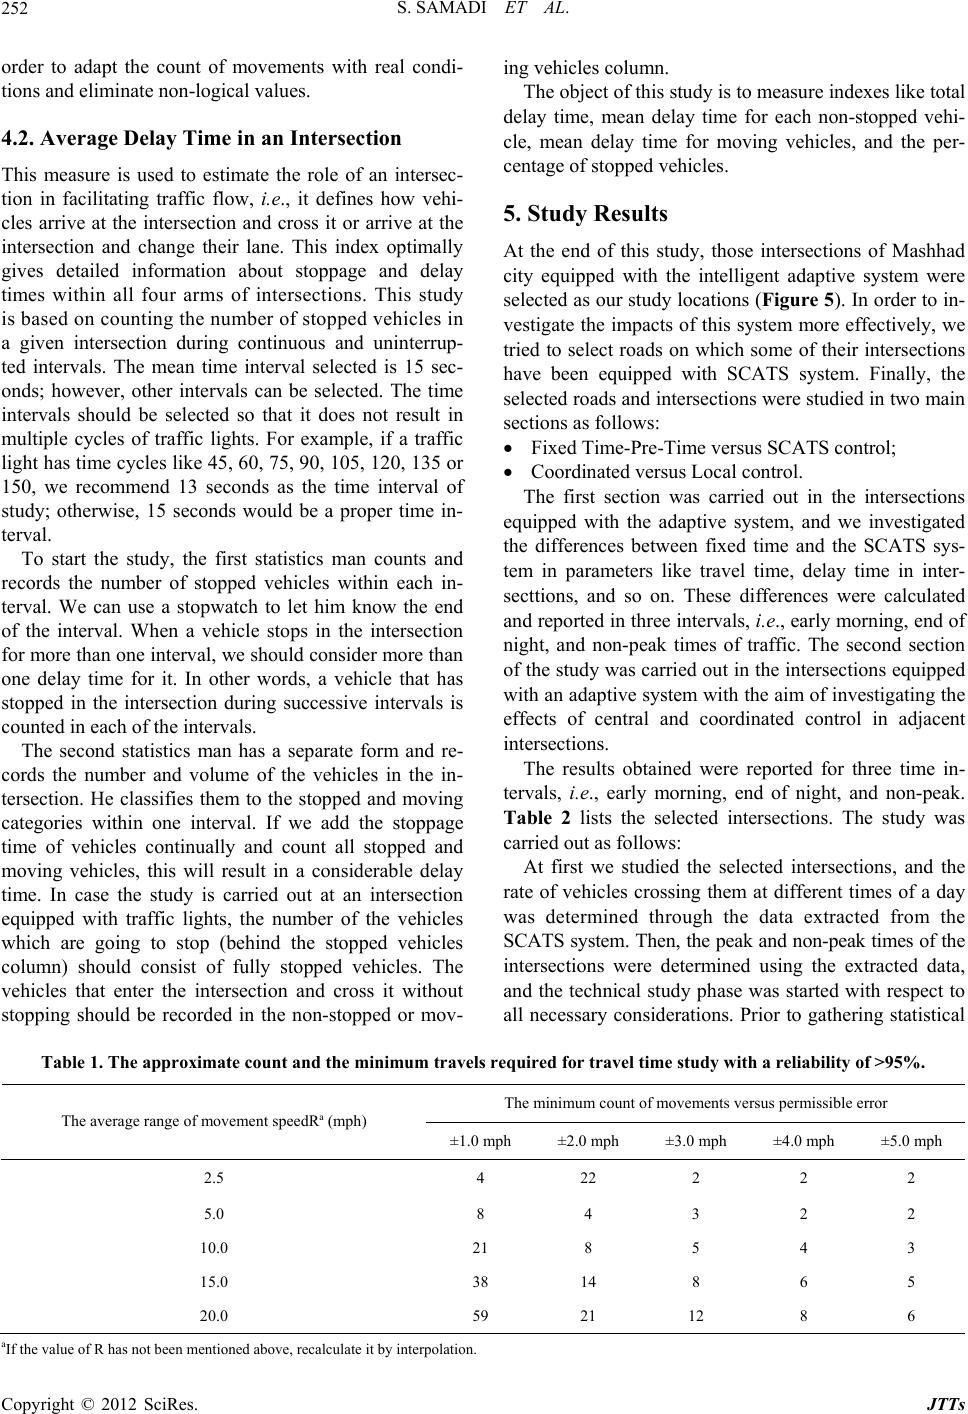 S. SAMADI ET AL. 252 order to adapt the count of movements with real condi- tions and eliminate non-logical values. 4.2. Average Delay Time in an Intersection This measure is used to estimate the role of an intersec- tion in facilitating traffic flow, i.e., it defines how vehi- cles arrive at the intersection and cross it or arrive at the intersection and change their lane. This index optimally gives detailed information about stoppage and delay times within all four arms of intersections. This study is based on counting the number of stopped vehicles in a given intersection during continuous and uninterrup- ted intervals. The mean time interval selected is 15 sec- onds; however, other intervals can be selected. The time intervals should be selected so that it does not result in multiple cycles of traffic lights. For example, if a traffic light has time cycles like 45, 60, 75, 90, 105, 120, 13 5 or 150, we recommend 13 seconds as the time interval of study; otherwise, 15 seconds would be a proper time in- terval. To start the study, the first statistics man counts and records the number of stopped vehicles within each in- terval. We can use a stopwatch to let him know the end of the interval. When a vehicle stops in the intersection for more than one interval, we should con sider more than one delay time for it. In other words, a vehicle that has stopped in the intersection during successive intervals is counted in each of the intervals. The second statistics man has a separate form and re- cords the number and volume of the vehicles in the in- tersection. He classifies them to the stopped and moving categories within one interval. If we add the stoppage time of vehicles continually and count all stopped and moving vehicles, this will result in a considerable delay time. In case the study is carried out at an intersection equipped with traffic lights, the number of the vehicles which are going to stop (behind the stopped vehicles column) should consist of fully stopped vehicles. The vehicles that enter the intersection and cross it without stopping should be recorded in the non-stopped or mov- ing vehicles column. The object of this study is to measure indexes like total delay time, mean delay time for each non-stopped vehi- cle, mean delay time for moving vehicles, and the per- centage of stopped vehicles. 5. Study Results At the end of this study, those intersections of Mashhad city equipped with the intelligent adaptive system were selected as our study locations (Figure 5). In order to in- vestigate the impacts of this system more effectively, we tried to select roads on which some of their intersections have been equipped with SCATS system. Finally, the selected roads and intersections were studied in two main sections as follows: Fixed Time-Pre-Time versus SCATS control; Coordinated versus Local control. The first section was carried out in the intersections equipped with the adaptive system, and we investigated the differences between fixed time and the SCATS sys- tem in parameters like travel time, delay time in inter- secttions, and so on. These differences were calculated and reported in three in tervals, i.e., early morning, en d of night, and non-peak times of traffic. The second section of the study was carried out in the in tersections equipped with an adaptiv e system with the aim of investigatin g the effects of central and coordinated control in adjacent intersections. The results obtained were reported for three time in- tervals, i.e., early morning, end of night, and non-peak. Table 2 lists the selected intersections. The study was carried out as follows: At first we studied the selected intersections, and the rate of vehicles crossing them at different times of a day was determined through the data extracted from the SCATS system. Then, the peak and non-peak times of the intersections were determined using the extracted data, and the technical study phase was started with respect to all necessary considerations. Prior to gathering statistical Table 1. The approximate count and the minimum travels required for travel time study with a reliability of >95%. The minimum count of movements versus permissible error The average range of movement speedRa (mph) ±1.0 mph ±2.0 mph ±3.0 mph ±4.0 mph ±5.0 mph 2.5 4 22 2 2 2 5.0 8 4 3 2 2 10.0 21 8 5 4 3 15.0 38 14 8 6 5 20.0 59 21 12 8 6 aIf the value of R has not been mentioned above, recalculate it by interpolation. Copyright © 2012 SciRes. JTTs  S. SAMADI ET AL. 253 Figure 5. Selected ro ute s on Mashhad map. data from the selected routes, periodic inspections were carried out along these routes, and traffic load conditions were determined in those periods. Finally, the values of travel and delay times were calculated at early morning, end of night, afternoon, and non-peak times. Table 3 shows the summary results of the study car- ried out on travel and delay times in three main roads consisting of six intersections. Accord ing to the tab le, the SCATS adaptive system shows evident improvements. Also, in Figure 6 comparative charts are shown of delay parameters for individual intersections and for all paths on average. After measuring the decreased rate of travel and delay times along each route as well as the parame- ters of movement components using the recorded infor- mation, we calculated fuel consumption and pollutant emission rates as well as improvement percentage in each route. Table 4 shows the results. As seen in this table, fuel consumption and CO and HC pollutant emis- sions were improved considerably so that for each vehi- cle per one kilometer, the fuel consumption rate de- creased by 22, 15, and 47 milliliters respectively in Sajjad Boulevard, Ferdowsi Boulevard, and Jomhoori- e-Eslami Boulevard. Regarding the number of vehicles crossing the inter- sections during one day, we can calculate the daily opti- mized rate of fuel consumption [13]. For example, the total number of vehicles crossing Ferdowsi Boulevard during 24 hours of a day is estimated around 85,000. Therefore, we can calculate the optimized rate of fuel consumption as follo ws: Daily optimization rate of fuel consumption in Fer- dowsi Boulevard = the average of the optimized rates of the fuel consumption of vehicles × the total vehicles crossing this route within 24 hours = 85 ,000 (vehicle/day) × 15 (mlit/vehicle) = 1275 (lit/day). On the other hand, if we extend this argument to the total number of vehicles crossing the mentioned inter- sections, we see a reduction in fuel consumption of 1200, 1300, and 2900 lit/day respectively in Sajjad Boulevard, Ferdowsi Boulevard, and Jomhoori Boulevard. Moreover, as shown in Figure 7, the amount of the produced float- ing particles, i.e., CO and UHC (unburned hydrocarbons), are considerably decreased. Finally, we can conclude that parameters like the qua- lity of a smooth traffic flow, vehicles’ speed increase, and delay time decrease, are all effective in significantly improving air pollution and gasoline consumption. There is just one negative parameter, i.e., the increase of NOx emissions, which increases as the vehicles’ speed in- creases, though it has a less negative impact on the envi- ronment. As we know, the production rate of NOx pol- lutant is higher in CNG fuels compared to gasoline [14]; however, owing to the decrease of other factors, includ- ing fuel consumption and CO pollutant, our government is serious about using this fuel. 6. Performance Improvement Suggestions On many roads of Mashhad city, traffic problems are generated from a few common sources. Since most routes suffer common problems, we can introduce general Table 2. Selected intersections and their study objects. Study Object Route Name The Selected Route Item Jomhoori-Parvin 1 Determining the optimizing rate of SCATS system compare d with pre-time case, before and after installation studies Jomhoori-Kooshesh Jomhoori Blvd. 2 Ferdowsi-Bahar 3 Determining the effectiveness of optimizing SCATS parameters and investigating the green wave concept implemented in Ferdowsi Boulevard Ferdowsi-Faramarz Ferdowsi Blvd. 4 Bahar-Sajjad 5 Determining the optimizing rate of SCATS system compared with pre-time case, before and after installation studies Bozorgmehr-Sajjad Sajjad Blvd. 6 Copyright © 2012 SciRes. JTTs 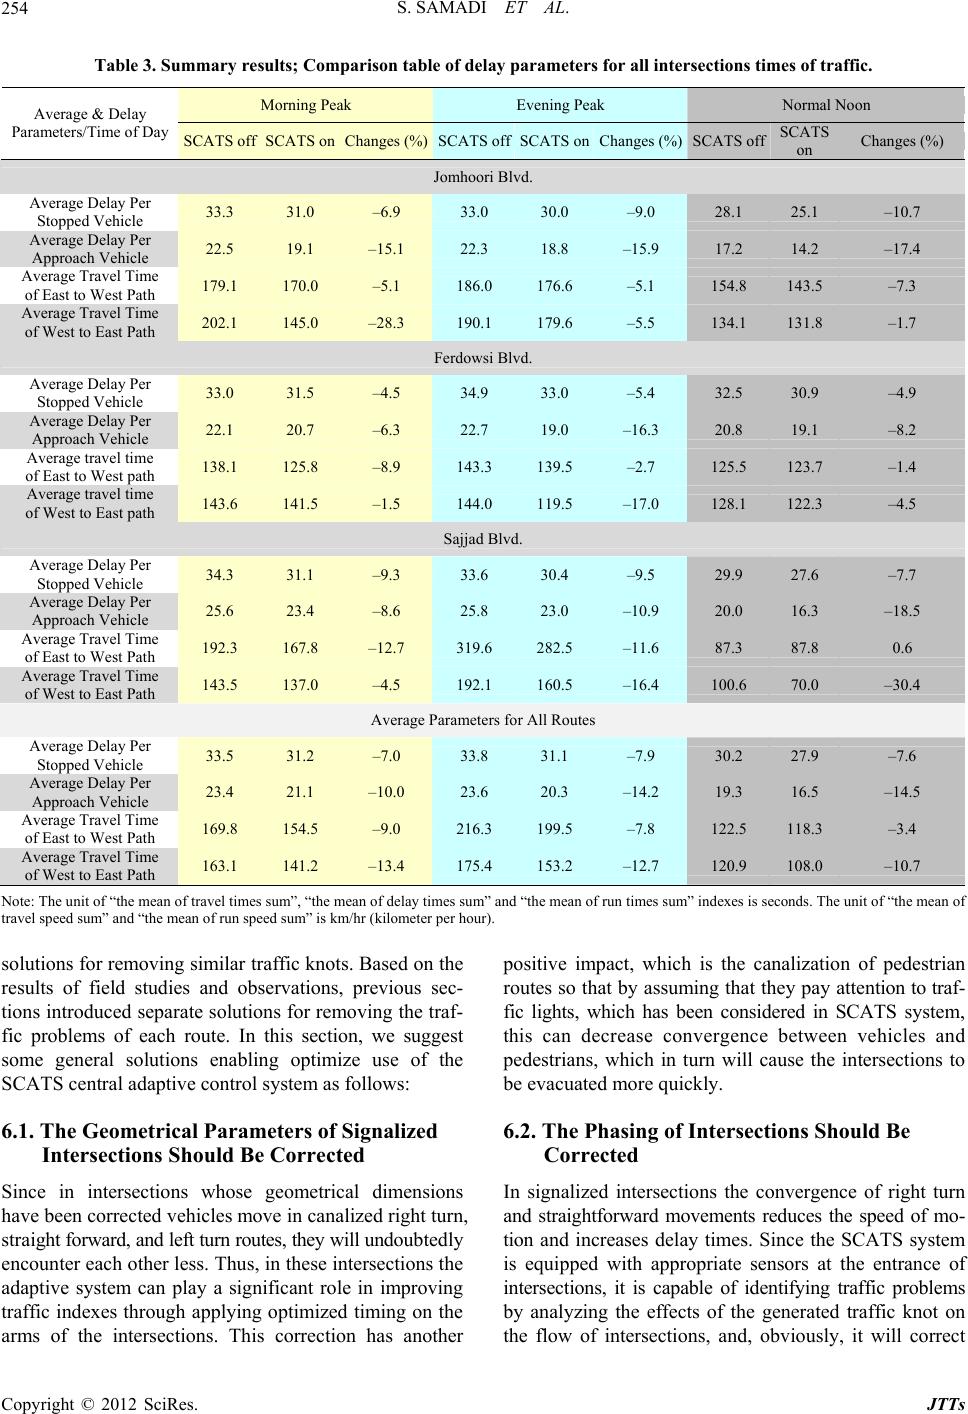 S. SAMADI ET AL. 254 Table 3. Summary results; Comparison table of delay parameters for all intersections times of traffic. Morning Peak Evening Peak Normal Noon Average & Delay Parameters/Time of Day SCATS offSCATS on Changes (%)SCATS offSCATS onChanges (%)SCATS off SCATS on Changes (%) Jomhoori Blvd. Average Delay Per Stopped Vehicle 33.3 31.0 –6.9 33.0 30.0 –9.0 28.1 25.1 –10.7 Average Delay Per Approach Vehicle 22.5 19.1 –15.1 22.3 18.8 –15.9 17.2 14.2 –17.4 Average Travel Time of East to West Path 179.1 170.0 –5.1 186.0 176.6 –5.1 154.8 143.5 –7.3 Average Travel Time of West to East Path 202.1 145.0 –28.3 190.1 179.6 –5.5 134.1 131.8 –1.7 Ferdowsi Blvd. Average Delay Per Stopped Vehicle 33.0 31.5 –4.5 34.9 33.0 –5.4 32.5 30.9 –4.9 Average Delay Per Approach Vehicle 22.1 20.7 –6.3 22.7 19.0 –16.3 20.8 19.1 –8.2 Average travel time of East to West path 138.1 125.8 –8.9 143.3 139.5 –2.7 125.5 123.7 –1.4 Average travel time of West to East path 143.6 141.5 –1.5 144.0 119.5 –17.0 128.1 122.3 –4.5 Sajjad Blvd. Average Delay Per Stopped Vehicle 34.3 31.1 –9.3 33.6 30.4 –9.5 29.9 27.6 –7.7 Average Delay Per Approach Vehicle 25.6 23.4 –8.6 25.8 23.0 –10.9 20.0 16.3 –18.5 Average Travel Time of East to West Path 192.3 167.8 –12.7 319.6 282.5 –11.6 87.3 87.8 0.6 Average Travel Time of West to East Path 143.5 137.0 –4.5 192.1 160.5 –16.4 100.6 70.0 –30.4 Average Parameters for All Routes Average Delay Per Stopped Vehicle 33.5 31.2 –7.0 33.8 31.1 –7.9 30.2 27.9 –7.6 Average Delay Per Approach Vehicle 23.4 21.1 –10.0 23.6 20.3 –14.2 19.3 16.5 –14.5 Average Travel Time of East to West Path 169.8 154.5 –9.0 216.3 199.5 –7.8 122.5 118.3 –3.4 Average Travel Time of West to East Path 163.1 141.2 –13.4 175.4 153.2 –12.7 120.9 108.0 –10.7 Note: The unit of “the mean of travel times sum”, “the mean of delay times sum” and “the mean of run times sum” indexes is seconds. The unit of “the mean of travel speed sum” and “the mean of run speed sum” is km/hr (kilometer per hour). solutions for removing similar traffic knots. Based on the results of field studies and observations, previous sec- tions introduced separate solutions for removing the traf- fic problems of each route. In this section, we suggest some general solutions enabling optimize use of the SCATS central adaptive control system as follows: 6.1. The Geometrical Parameters of Signalized Intersections Should Be Corrected Since in intersections whose geometrical dimensions have been corrected vehicles move in canalized right turn, str ai g ht forward, and left turn rou tes, they w ill undou bt edl y encounter each other less. Thus, in these intersections the adaptive system can play a significant role in improving traffic indexes through applying optimized timing on the arms of the intersections. This correction has another positive impact, which is the canalization of pedestrian routes so that by assuming that they pay attention to traf- fic lights, which has been considered in SCATS system, this can decrease convergence between vehicles and pedestrians, which in turn will cause the intersections to be ev acua ted more quickly. 6.2. The Phasing of Intersections Should Be Corrected In signalized intersections the convergence of right turn and straightforward movements reduces the speed of mo- tion and increases delay times. Since the SCATS system is equipped with appropriate sensors at the entrance of intersections, it is capable of identifying traffic problems by analyzing the effects of the generated traffic knot on the flow of intersections, and, obviously, it will correct Copyright © 2012 SciRes. JTTs 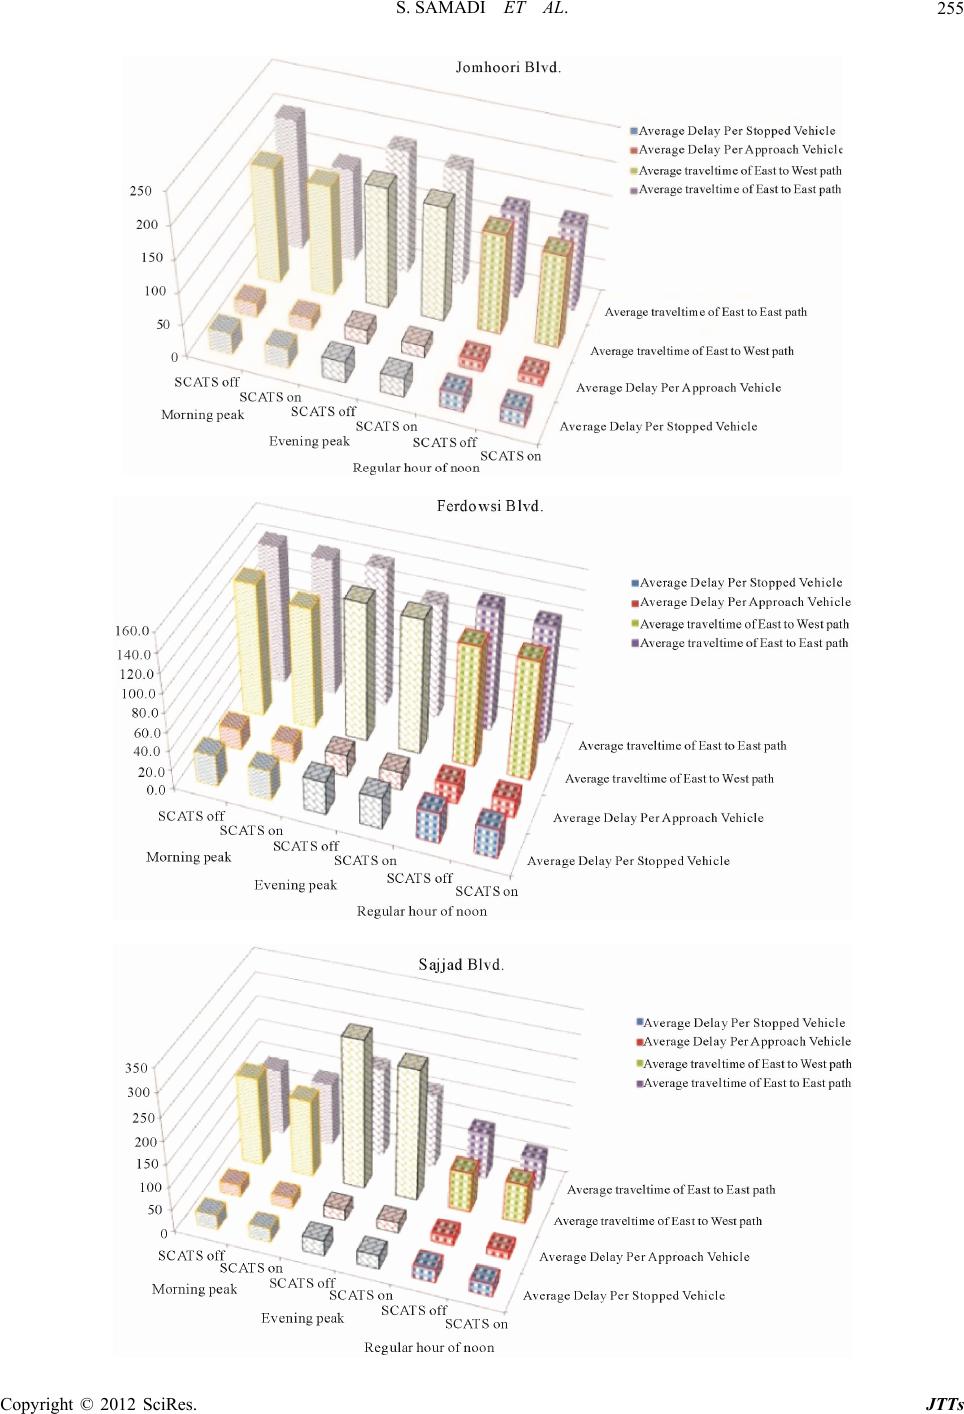 S. SAMADI ET AL. 255 Copyright © 2012 SciRes. JTTs 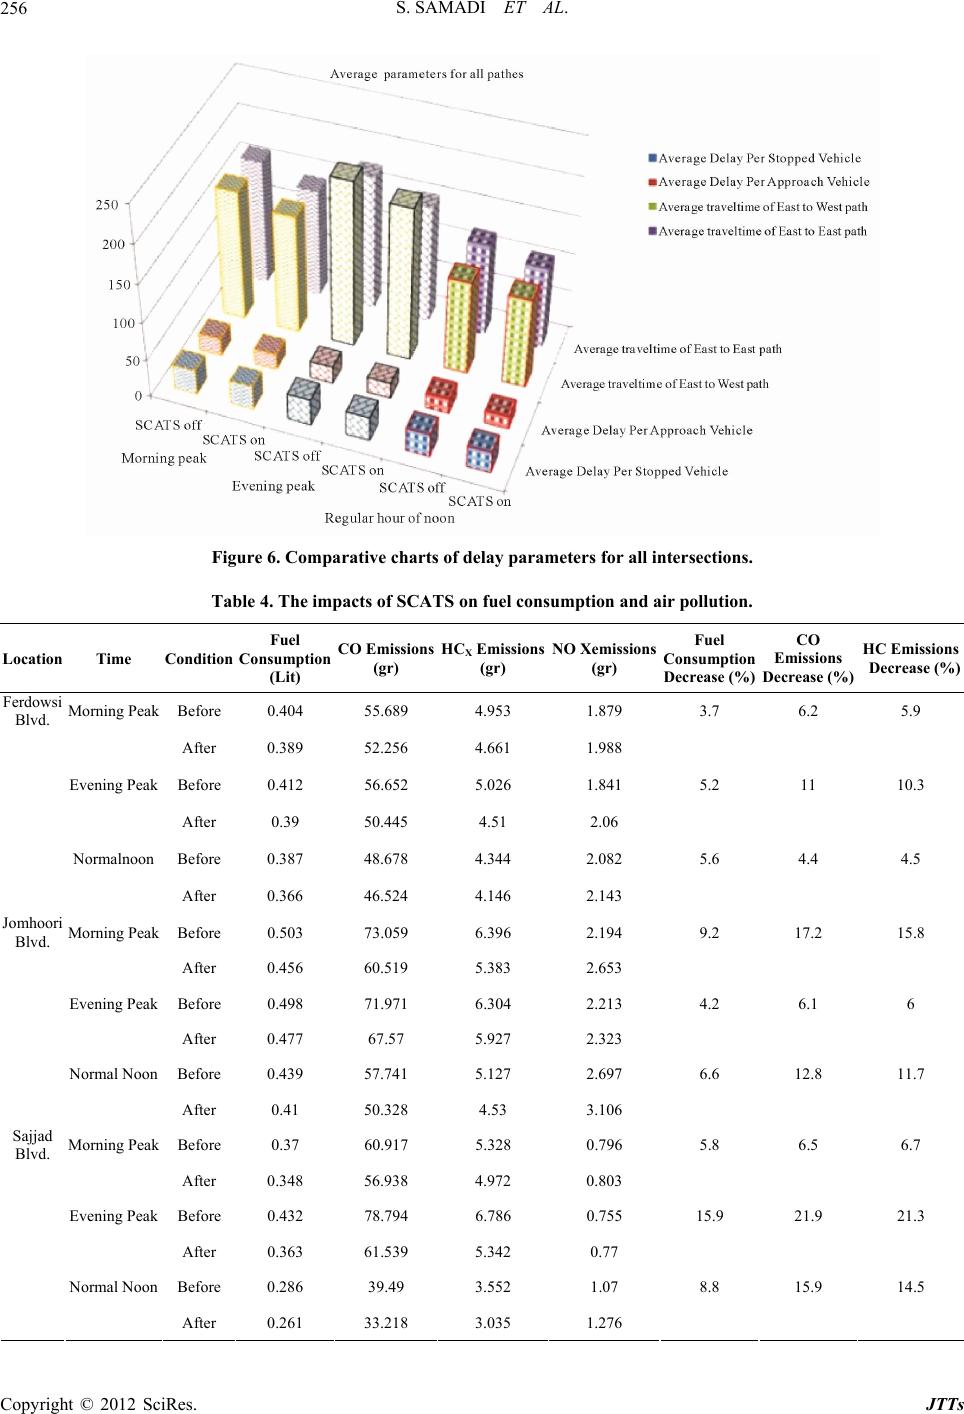 S. SAMADI ET AL. 256 Figure 6. Comparative charts of delay parameters for all intersections. Table 4. The impacts of SCATS on fuel consumption and air pollution. Location Time Condition Fuel Consumption (Lit) CO Emissions (gr) HCX Emissions (gr) NO Xemissions (gr) Fuel Consumption Decrease (%) CO Emissions Decrease (%) HC Emissions Decrease (%) Morning Peak Before 0.404 55.689 4.953 1.879 3.7 6.2 5.9 After 0.389 52.256 4.661 1.988 Evening Peak Before 0.412 56. 652 5.026 1.841 5.2 11 10.3 After 0.39 50.445 4.51 2.06 Normalnoon Before 0.387 48.678 4.344 2.082 5.6 4.4 4.5 Ferdowsi Blvd. After 0.366 46.524 4.146 2.143 Morning Peak Before 0.503 73.059 6.396 2.194 9.2 17.2 15.8 After 0.456 60.519 5.383 2.653 Evening Peak Before 0.498 71. 971 6.304 2.213 4.2 6.1 6 After 0.477 67.57 5.927 2.323 Normal Noon Before 0.439 57. 741 5.127 2.697 6.6 12.8 11.7 Jomhoori Blvd. After 0.41 50.328 4.53 3.106 Morning Peak Before 0.37 60.917 5.328 0.796 5.8 6.5 6.7 After 0.348 56.938 4.972 0.803 Evening Peak Before 0.432 78.794 6.786 0.755 15.9 21.9 21.3 After 0.363 61.539 5.342 0.77 Normal Noon Before 0.286 39.49 3.552 1.07 8.8 15.9 14.5 Sajjad Blvd. After 0.261 33.218 3.035 1.276 Copyright © 2012 SciRes. JTTs 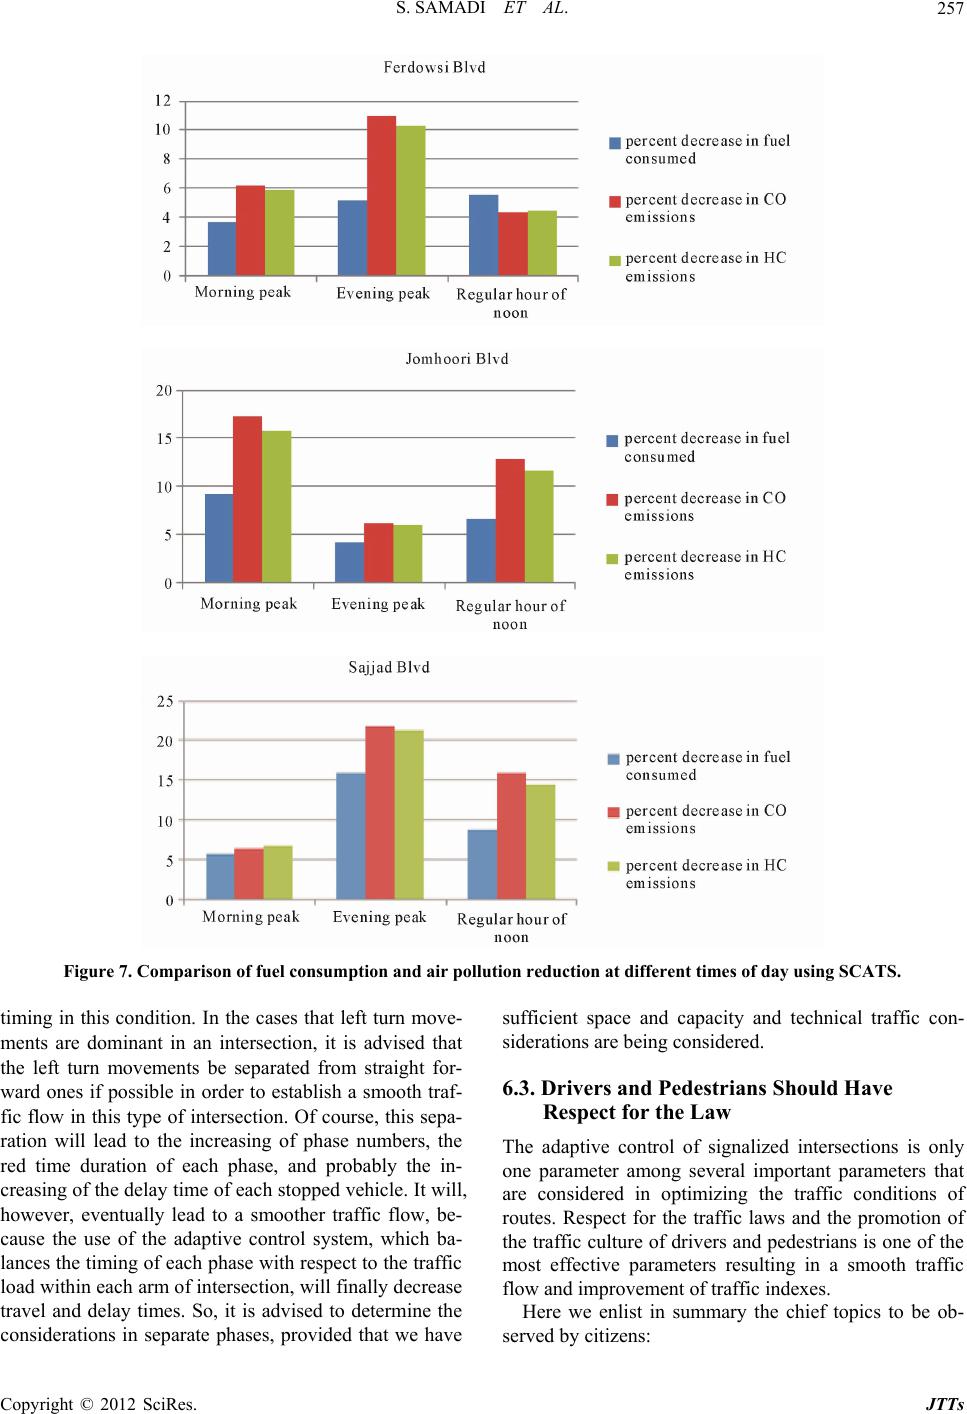 S. SAMADI ET AL. Copyright © 2012 SciRes. JTTs 257 Figure 7. Comparison of fuel consumption and air pollution reduction at different times of day using SCATS. timing in this condition. In the cases that left turn move- ments are dominant in an intersection, it is advised that the left turn movements be separated from straight for- ward ones if possible in order to establish a smooth traf- fic flow in this type of intersection. Of course, this sepa- ration will lead to the increasing of phase numbers, the red time duration of each phase, and probably the in- creasing of the delay time of each stopped vehicle. It will, however, eventually lead to a smoother traffic flow, be- cause the use of the adaptive control system, which ba- lances the timing of each phase with respect to the traffic load within each arm of intersection, will finally decrease travel and delay times. So, it is advised to determine the considerations in separate phases, provided that we have sufficient space and capacity and technical traffic con- siderations are being considered. 6.3. Drivers and Pedestrians Should Have Respect for the Law The adaptive control of signalized intersections is only one parameter among several important parameters that are considered in optimizing the traffic conditions of routes. Respect for the traffic laws and the promotion of the traffic culture of drivers and pedestrians is one of the most effective parameters resulting in a smooth traffic flow and improvement of traffic indexes. Here we enlist in summary the chief topics to be ob- served by citizens:  S. SAMADI ET AL. 258 Drivers should select their appropriate lane before they arrive at intersections. They should observe pedestrians paths and drive in the specified phases for pedestrians with respect to traffic lights. They should not park their cars within the intersec- tion’s limits. Taxi cabs should not take on or let off passengers after and before the intersection’s limits. They should not double park in drive bands. They should pay attention to traffic lights and should drive at safe speed limits. It is necessary to organize marginal auto parks and assign sufficient parking spaces outside signalized intersections and heavy traffic roads. 6.4. The System Parameters Should Be Optimized Continuously SCATS is an intelligent system and adapts itself with traffic flow; however, determining all of its parameters requires presumptions that are determined by the system designer. Predefined factors should be reviewed con- tinuously, such as the minimum and maximum timings, or the programs that set the proper cycle length, or the percentage of each phase in each route. It is possible to know the traffic conditions in pr evious hours and days as well as the volume of data extracted by induced sensors using peripheral software like the SCATS traffic reporter. This kind of software provides other valuable informa- tion like the saturation percentage of each route. These data, along with filed observations carried out with the aim of getting information from traffic officers, can make an appropriate base for optimizing the main parameters for intersection control purposes. 6.5. Drivers Should Be Informed of Traffic Conditions Displaying the traffic conditions of signalized intersec- tions using the information derived from induced sensors is one of the SCATS system’s capabilities. This advan- tage makes it possible to know the traffic conditions of each arm of an intersection as well as the traffic condi- tions of the routes ending at those intersections. There- fore, we could use this advantage and inform drivers of the traffic conditions of routes and enable them to select optimum routes in order to avoid heavy traffic loads on specific routes. Drivers can be informed by the operator via news channels, through the Internet, and via display- ing the traffic map of city, which is presented by the software. 7. Conclusions To summarize the results of this before and after study, it is shown that in most selected routes and intersections the SCATS adaptive system has positive impacts on travel and delay times. However, the effectiveness of this system differs from route to route and depends on the conditions of a given route. In other words, at main routes with a high volume of traffic, lowering the delay and vehicle stoppage time has a higher priority for the intelligent traffic control system. Although, this may temporarily increase the delay in other routes, but re- garding traffic volume of each route it will increase overall performance of the system. The obtained results, however, show that more attention should be paid to the quality of defining the parameters of the adaptive system in the design and maintenance phases. It should be mentioned that this study has been carried out on routes with heavy traffic cond itions. In this type of route, the intersection commanding system and its speci- fied timing are not sufficient for reducing traffic load, and other parameters may play significant role for this purpose. An intersection adaptive control system, as an effective parameter, can significantly improve the traffic indexes of intersections, which in turn will improve the traffic conditions of routes, but this improvement does not solely depend on this parameter. Some helpful suggestions for performance improve- ment of the system are also given at the end of the paper. 8. Acknowledgements This evaluation was funded jointly by Mashhad Traffic and Transportation Organization and Iran Ministry of Science, Research & Technology. REFERENCES [1] L. Figueiredo, et al., “Towards the Development of Intel- ligent Transportation Systems,” IEEE Proceedings of In- telligent Transportation Systems, Oakland, 25-29 August 2001, pp. 1206-1211. [2] N. Gartner, et al., “Development of Advanced Traffic Signal Control Strategies for Intelligent Transportation Systems: Multilevel Design,” Transportation Research Record, No 1494, 1995, pp. 98-105. [3] P. R. Lowrie, “SCATS, Sydney Co-Ordinated Adaptive Traffic System: A Traffic Responsive Method of Control- ling Urban Traffic,” Roads and Traffic Authority NSW, Darlinghurst, 1990. http://library.its.berkeley.edu/ [4] R. Akcelik, M. Besly and E. Chung, “An Evolution of SCATS Master Isolated Control,” Proceedings of the 19th ARRB Transport Research Conference (T ransport 98), 1998, pp. 1-24. [5] C. J. Khisty, “Transportation Engineering: An Introduc- tion,” 2nd editon, Prentice-Hall, Upper Saddle River, 1998. [6] www.scats.com.au [7] R. Ghaman, D. Gettman, L. Head and P. B. Mirchandani, “Adaptive Control Software for Distributed Systems,” Copyright © 2012 SciRes. JTTs  S. SAMADI ET AL. Copyright © 2012 SciRes. JTTs 259 28th Annual Conference of the Industrial Electronics So- ciety, 5-8 November 2002, pp. 3103-3106. [8] H. D. Robertson and J. E. Hummer, “Manual of Trans- portation Engineering Studies,” Prentice-Hall, Upper Sad- dle River, 1994. [9] K. Fehon and R. Chong, “Adaptive Traffic Signal System for Cupertino California,” 4th Asia-Pacific Transporta- tion Development Conference, April 18-20, 2003. [10] F. Zhu, G. Li, Zh. Li, C. Chen and D. Wen, “A Case Study of Evaluating Traffic Signal Control Systems Us- ing Computational Experiments,” IEEE Transaction on Intelligent Transportation Systems, Vol. 12, No. 4, 2011, pp. 1220-1226. doi:10.1109/TITS.2011.2157691 [11] F. Hu, et al., “Field Evaluation of SCATS Control System in Las Vegas,” Proceedings of the 11th International Con f erence of Chinese Transportation Profess i on a l s, 2011, pp. 3963-3973. doi:10.1061/41186(421)397 [12] M. Kergaye, et al., “Comparison of before-after versus off-on Adaptive Traffic Control Evaluations: Park City,” Case Study, 2006. [13] “MUTS: Manual on Uniform Traffic Studies,” 2000. [14] P. F. Everall, “The Effects of Road and Traffic Condi- tions on Fuel Consumption,” Road Research Laboratory, 1983.
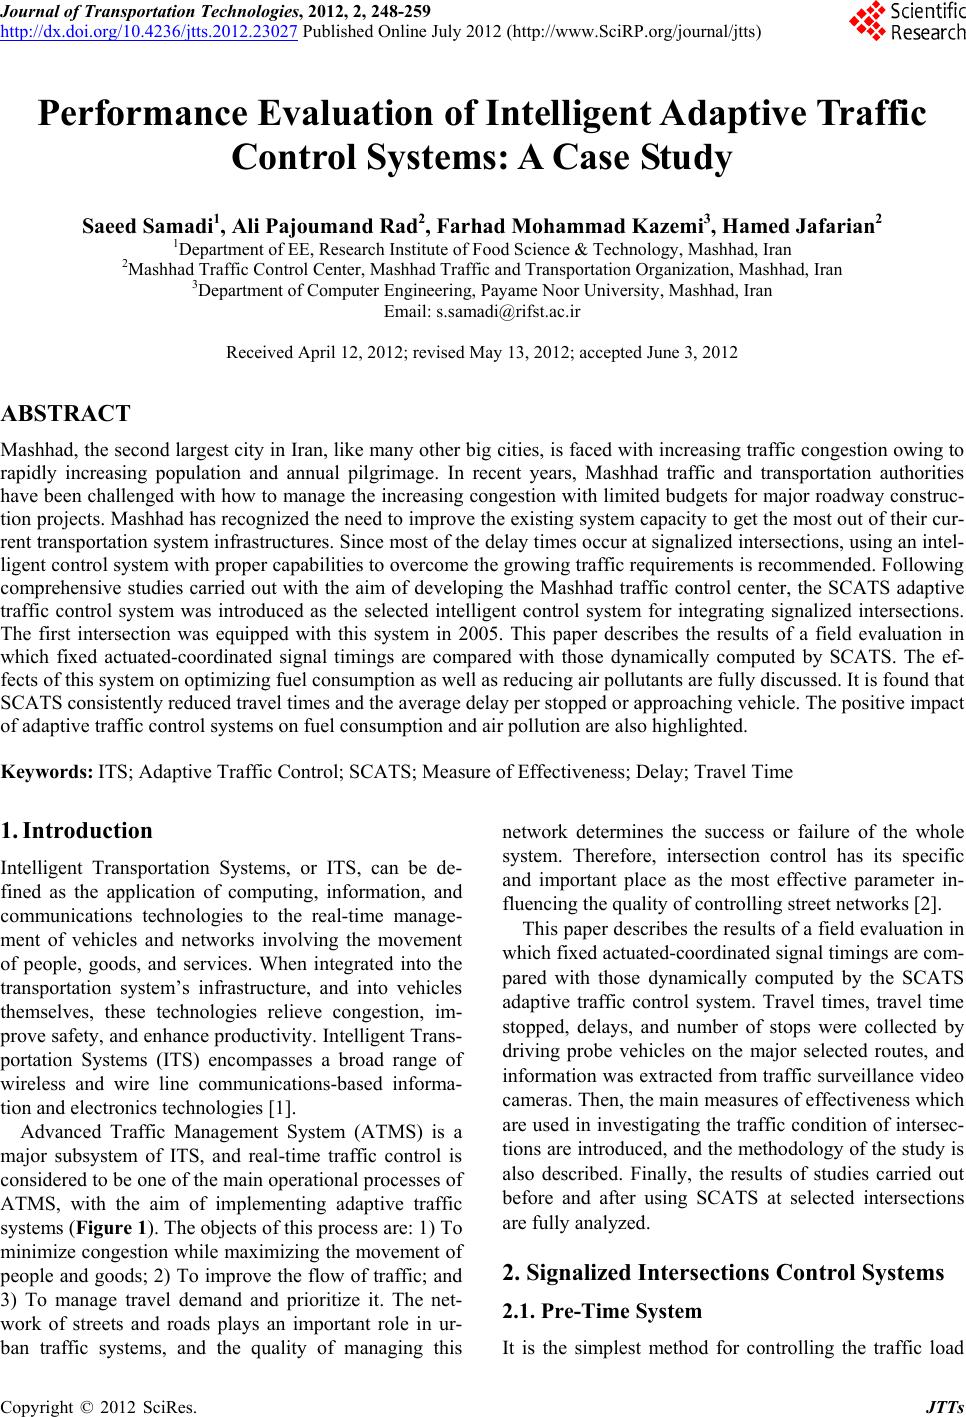
|