Paper Menu >>
Journal Menu >>
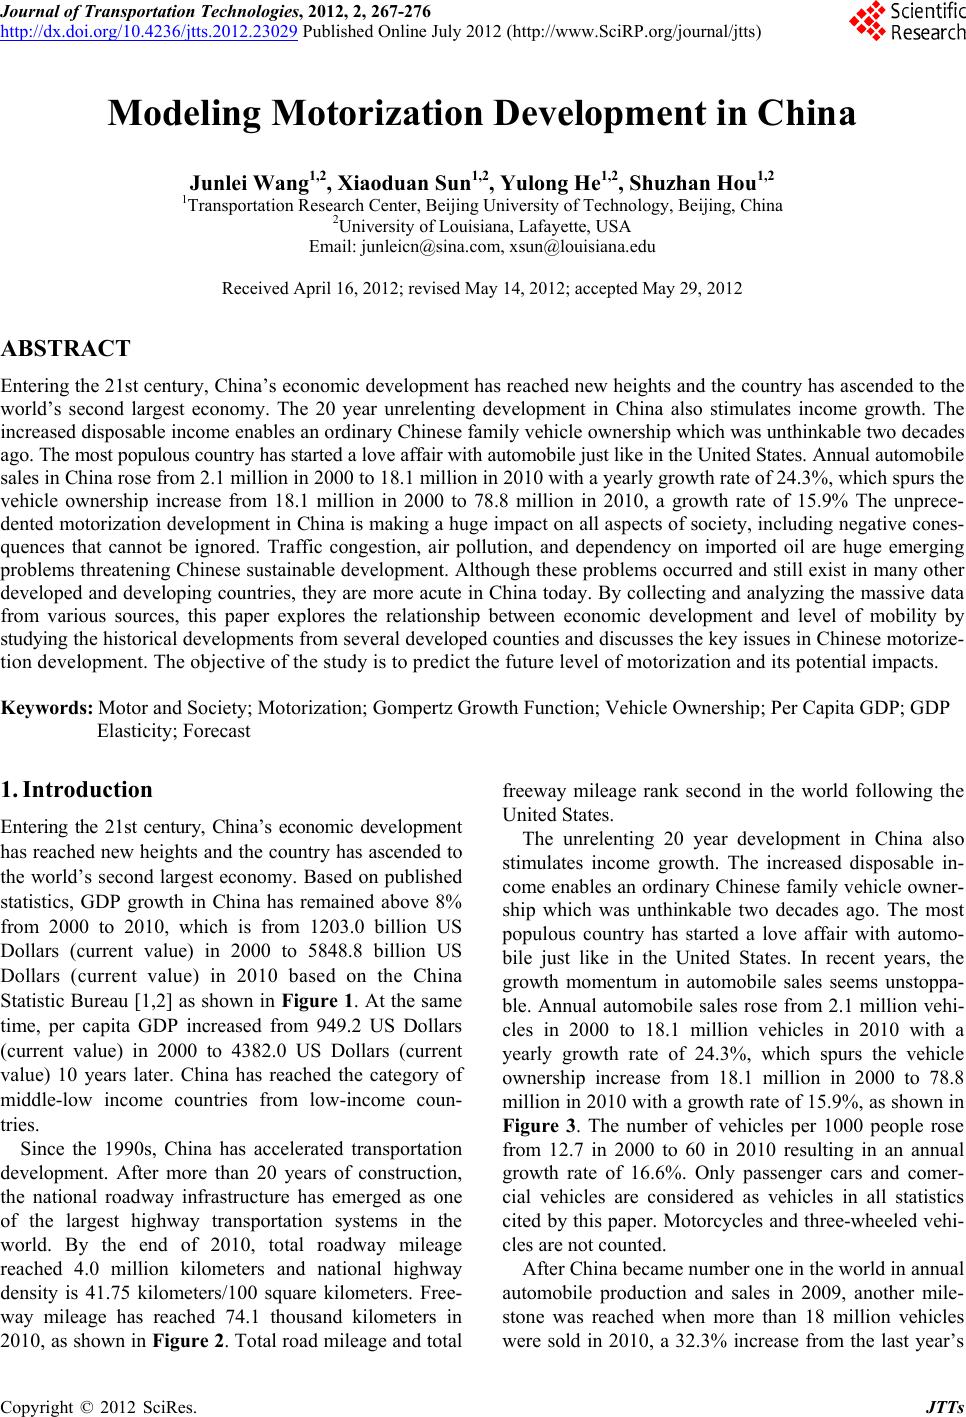 Journal of Transportation Technologies, 2012, 2, 267-276 http://dx.doi.org/10.4236/jtts.2012.23029 Published Online July 2012 (http://www.SciRP.org/journal/jtts) Modeling Motorization Development in China Junlei Wang1,2, Xiaoduan Sun1,2, Yulong He1,2, Shuzhan Hou1,2 1Transportation Research Center, Beijing University of Technology, Beijing, China 2University of Louisiana, Lafayette, USA Email: junleicn@sina.com, xsun@louisiana.edu Received April 16, 2012; revised May 14, 2012; accepted May 29, 2012 ABSTRACT Entering the 21st century, China’s economic development has reached new heights and the country has ascended to the world’s second largest economy. The 20 year unrelenting development in China also stimulates income growth. The increased disposable income enables an ordinary Chinese family vehicle ownership which was unthinkable two decades ago. The most populous country has started a love affair with automobile just like in the United States. Annual automobi l e sales in China rose from 2.1 millio n in 2000 to 18.1 millio n in 2010 w ith a year ly growth rate of 24.3%, wh ich sp urs the vehicle ownership increase from 18.1 million in 2000 to 78.8 million in 2010, a growth rate of 15.9% The unprece- dented motorization development in China is making a huge impact on all aspects of society, including negative cones- quences that cannot be ignored. Traffic congestion, air pollution, and dependency on imported oil are huge emerging problems threatening Chinese sustainable development. Although these problems occurred and still exist in many other developed and developing countries, they are more acute in China today. By collecting and analyzing the massive data from various sources, this paper explores the relationship between economic development and level of mobility by studying the historical developments from several developed counties and discusses the key issues in Chinese motorize- tion development. The objective of the study is to predict the future level of motorization and its potential impacts. Keywords: Motor and Society; Motorization; Gompertz Growth Function; Vehicle Ownership; Per Capita GDP; GDP Elasticity; Forecast 1. Introduction Entering the 21st century, China’s economic development has reached new heights and the country has ascended to the world’s second largest economy. Based on published statistics, GDP growth in China has remained above 8% from 2000 to 2010, which is from 1203.0 billion US Dollars (current value) in 2000 to 5848.8 billion US Dollars (current value) in 2010 based on the China Statistic Bureau [1,2] as shown in Figure 1. At the same time, per capita GDP increased from 949.2 US Dollars (current value) in 2000 to 4382.0 US Dollars (current value) 10 years later. China has reached the category of middle-low income countries from low-income coun- tries. Since the 1990s, China has accelerated transportation development. After more than 20 years of construction, the national roadway infrastructure has emerged as one of the largest highway transportation systems in the world. By the end of 2010, total roadway mileage reached 4.0 million kilometers and national highway density is 41.75 kilometers/100 square kilometers. Free- way mileage has reached 74.1 thousand kilometers in 2010, as shown in Figure 2. Total road mileage and total freeway mileage rank second in the world following the United States. The unrelenting 20 year development in China also stimulates income growth. The increased disposable in- come enables an ordinary Chinese family vehicle owner- ship which was unthinkable two decades ago. The most populous country has started a love affair with automo- bile just like in the United States. In recent years, the growth momentum in automobile sales seems unstoppa- ble. Annual automobile sales rose from 2.1 million vehi- cles in 2000 to 18.1 million vehicles in 2010 with a yearly growth rate of 24.3%, which spurs the vehicle ownership increase from 18.1 million in 2000 to 78.8 million in 2010 with a grow th rate of 15 .9%, as shown in Figure 3. The number of vehicles per 1000 people rose from 12.7 in 2000 to 60 in 2010 resulting in an annual growth rate of 16.6%. Only passenger cars and comer- cial vehicles are considered as vehicles in all statistics cited by this paper. Motorcycles and three-wheeled vehi- cles are not counted. After China became number one in the world in annual automobile production and sales in 2009, another mile- stone was reached when more than 18 million vehicles were sold in 2010, a 32.3% increase from the last year’s C opyright © 2012 SciRes. JTTs 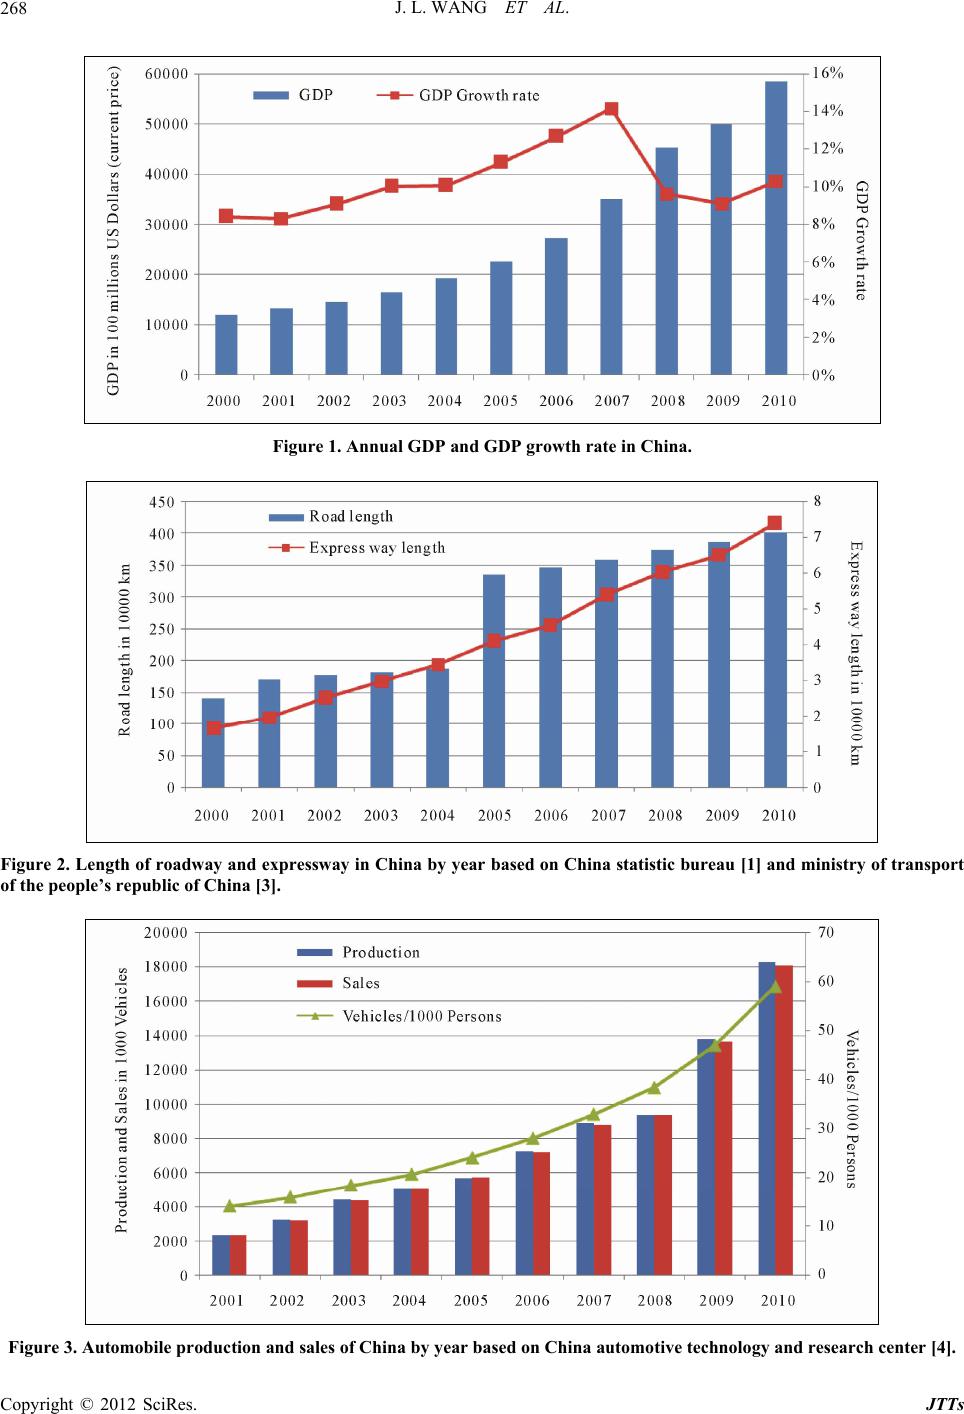 J. L. WANG ET AL. 268 Figure 1. Annual GDP and GDP growth rate in China. Figure 2. Length of roadway and expressway in China by year based on China statistic bureau [1] and ministry of transport of the people’s republic of China [3]. Figure 3. Automobile production and sales of China by year based on China automotive technology and research center [4]. Copyright © 2012 SciRes. JTTs 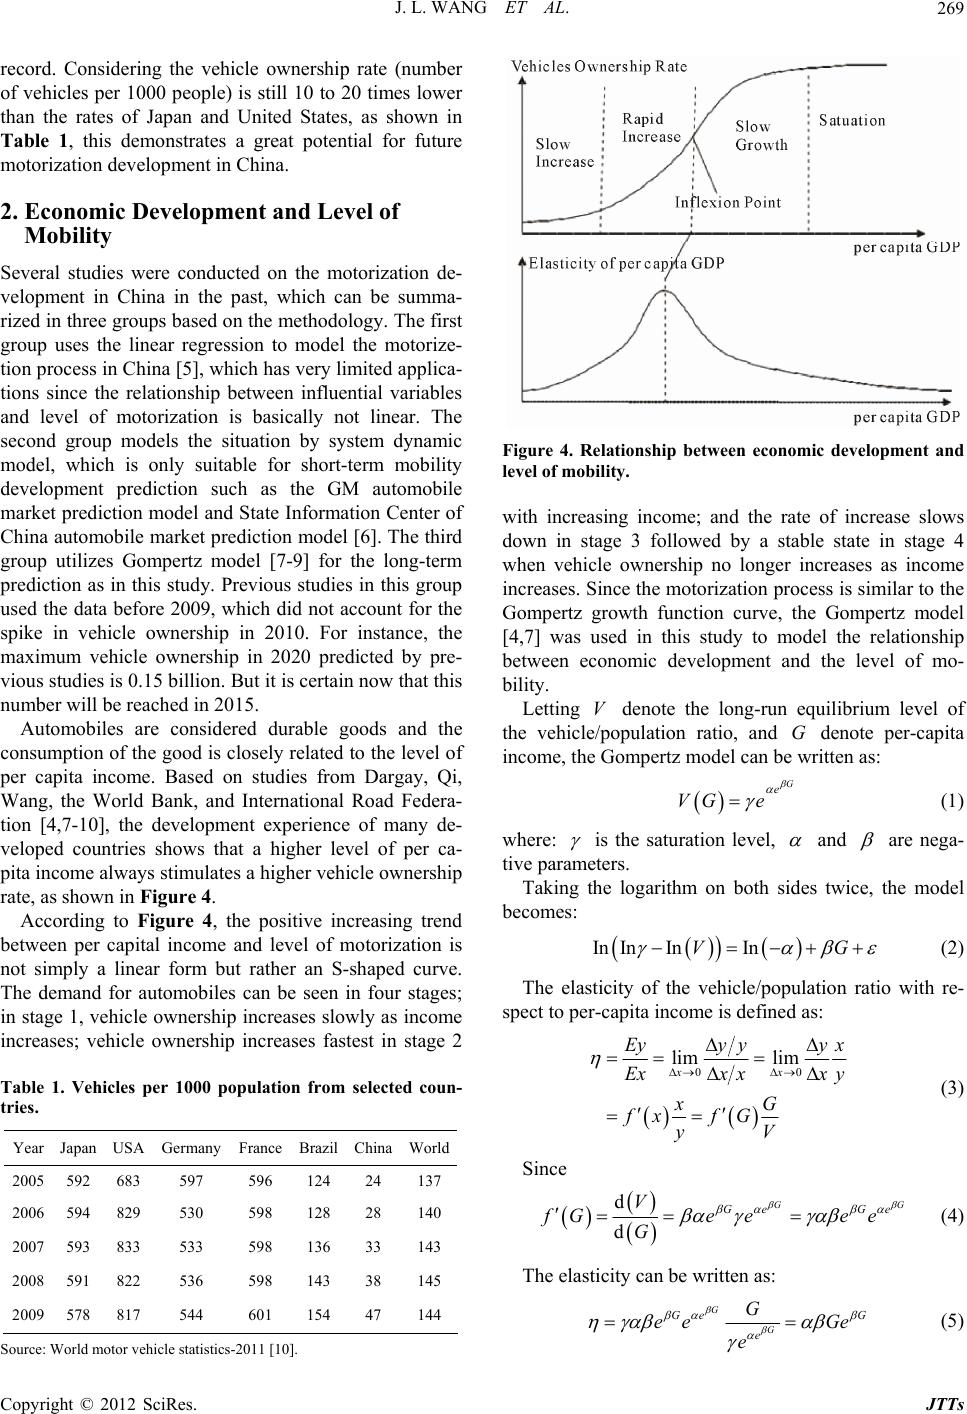 J. L. WANG ET AL. 269 record. Considering the vehicle ownership rate (number Se were conducted on the motorization de- Japan USA Germany France Brazil ChinaWorld of vehicles per 1000 people) is still 10 to 20 times lower than the rates of Japan and United States, as shown in Table 1, this demonstrates a great potential for future motorization development in Chin a. 2. Economic Development and Level of Mobility veral studies velopment in China in the past, which can be summa- rized in three groups based on the methodology. The first group uses the linear regression to model the motorize- tion process in China [5], which has very limited applica- tions since the relationship between influential variables and level of motorization is basically not linear. The second group models the situation by system dynamic model, which is only suitable for short-term mobility development prediction such as the GM automobile market prediction model and State Information Center of China automobile market prediction model [6]. The th ird group utilizes Gompertz model [7-9] for the long-term prediction as in this study. Previous studies in this group used the data before 2009, which did not account for the spike in vehicle ownership in 2010. For instance, the maximum vehicle ownership in 2020 predicted by pre- vious studies is 0.15 billion. But it is certain now that this number will be reached in 2015. Automobiles are considered durable goods and the consumption of the good is closely related to the level of per capita income. Based on studies from Dargay, Qi, Wang, the World Bank, and International Road Federa- tion [4,7-10], the development experience of many de- veloped countries shows that a higher level of per ca- pita income always stimulates a higher vehicle ownership rate, as shown in Figure 4. According to Figure 4, the positive increasing trend between per capital income and level of motorization is not simply a linear form but rather an S-shaped curve. The demand for automobiles can be seen in four stages; in stage 1, vehicle ownership increases slowly as income increases; vehicle ownership increases fastest in stage 2 able 1. Vehicles per 1000 population from selected coun- T tries. Year 2005 592 683 597 596 124 24 137 2006 594 829 530 598 128 28 140 2007 593 833 533 598 136 33 143 2008 591 822 536 598 143 38 145 2009 578 817 544 601 154 47 144 Figure 4. Relationship between economic development and level of mobility. with increasing income; and the rate of increase slow nership no longer increases as income creases. Since the motorization process is similar to the s down in stage 3 followed by a stable state in stage 4 when vehicle ow in Gompertz growth function curve, the Gompertz model [4,7] was used in this study to model the relationship between economic development and the level of mo- bility. Letting V denote the long-run equilibrium level of the vehicle/population ratio, and G denote per-capita income, the Gompertz model can be written as: G e VG e (1) where: is the saturation level, and are nega- tive parameters. Taking the logarithm on both sid becomes: es twice, the model In InInInVG (2) The elasticity of the vehicle/population ratio with re- spect to per-capita income is defined as: 00xx Exx xx y xG fx fG (3) lim lim Ey yy yx yV Since d d GG Ge Ge V fGe eee G (4) be written as: The elasticity can G G Ge G e G ee Ge e (5) Source: World motor vehicle statistics-2011 [10]. Copyright © 2012 SciRes. JTTs 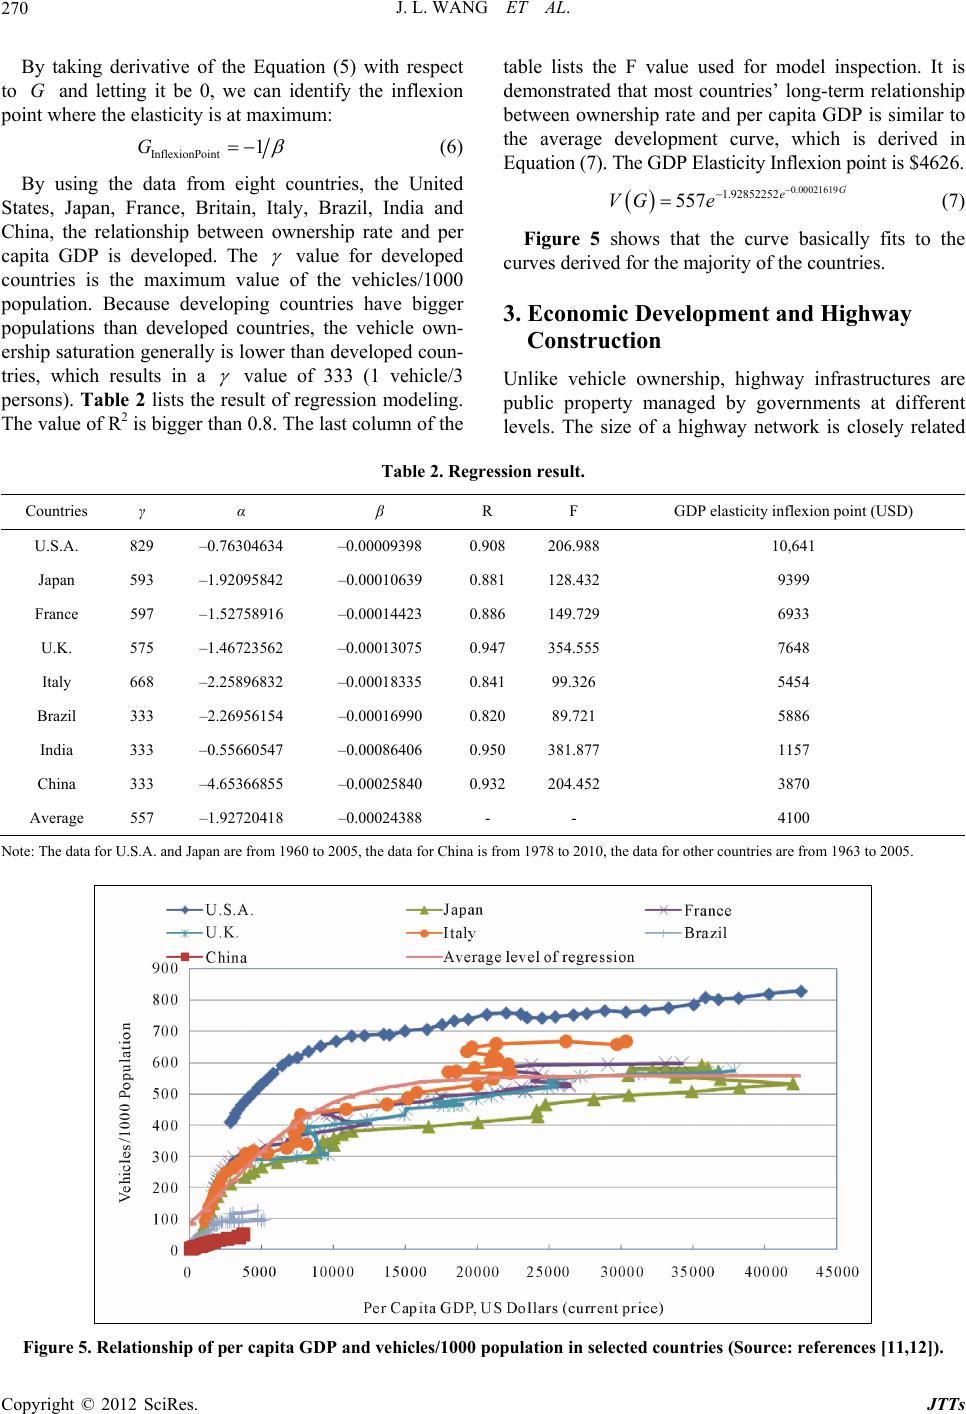 J. L. WANG ET AL. 270 By taking derivative of the Equation (5) with respect to and letting it be 0, we can identify the inflexion point where the elasticity is at maximum: G InflexionPoint 1G (6) y capita GDP is developed. The B using the data from eight countries, the United States, Japan, France, Britain, Italy, Brazil, India and China, the relationship between ownership rate and per value for developed countries is the maximum value of the vehicles/1000 population. Because developing countries have bigger populations than developed countries, the vehicle own- ership saturation generally is lower than developed coun- tries, which results in a value of 333 (1 vehicle/3 persons). Table 2 lists the result of regression modeling. The va lu e of R2 is bigg er th an 0.8. Th e last column of the Table 2. Reg Countries γ α β table lists the F value used for model inspection. It is demonstrated that most countries’ long-term relationship between ownership rate and per capita GDP is similar to the average development curve, which is derived in Equation (7). The GDP Elasticity Inflexion point is $4626. 0.00021619 1.92852252 557 G e VG e (7) Figure 5 shows that the curve basically fits to the curves derived for the majority of the countries. 3. Economic Development and Highway Construction Unlike vehicle ownership, highway infrastructures are public property managed by governments at different levels. The size of a highway network is closely related ression result. R F GDP elasticity inflexion point (USD) U.S.A. 829 –0.76304634 –0.00009398 0.908 206.988 10,641 Japan 593 –1.92095842 –0.0009399 5 –1.52916 –0.00423 0. 149 A 10639 0.881 128.432 France 977580148869.726933 U.K. 575 –1.46723562 –0.00013075 0.947 354.555 7648 Italy 668 –2.25896832 –0.00018335 0.841 99.326 5454 Brazil 333 –2.26956154 –0.00016990 0.820 89.721 5886 India 333 –0.55660547 –0.00086406 0.950 381.877 1157 China 333 –4.65366855 –0.00025840 0.932 204.452 3870 verage 557 –1.92720418 –0.00024388 - - 4100 Note: for Uand Ja60 to 2 Chin 197 d ata for other countries 1963 to 2005. The data.S.A. pan are from 19005, the data fora is from8 to 2010, the are from Figure 5. Relationship of per capita GDP and vehicles/1000 population in selected countries (Source: references [11,12]). Copyright © 2012 SciRes. JTTs 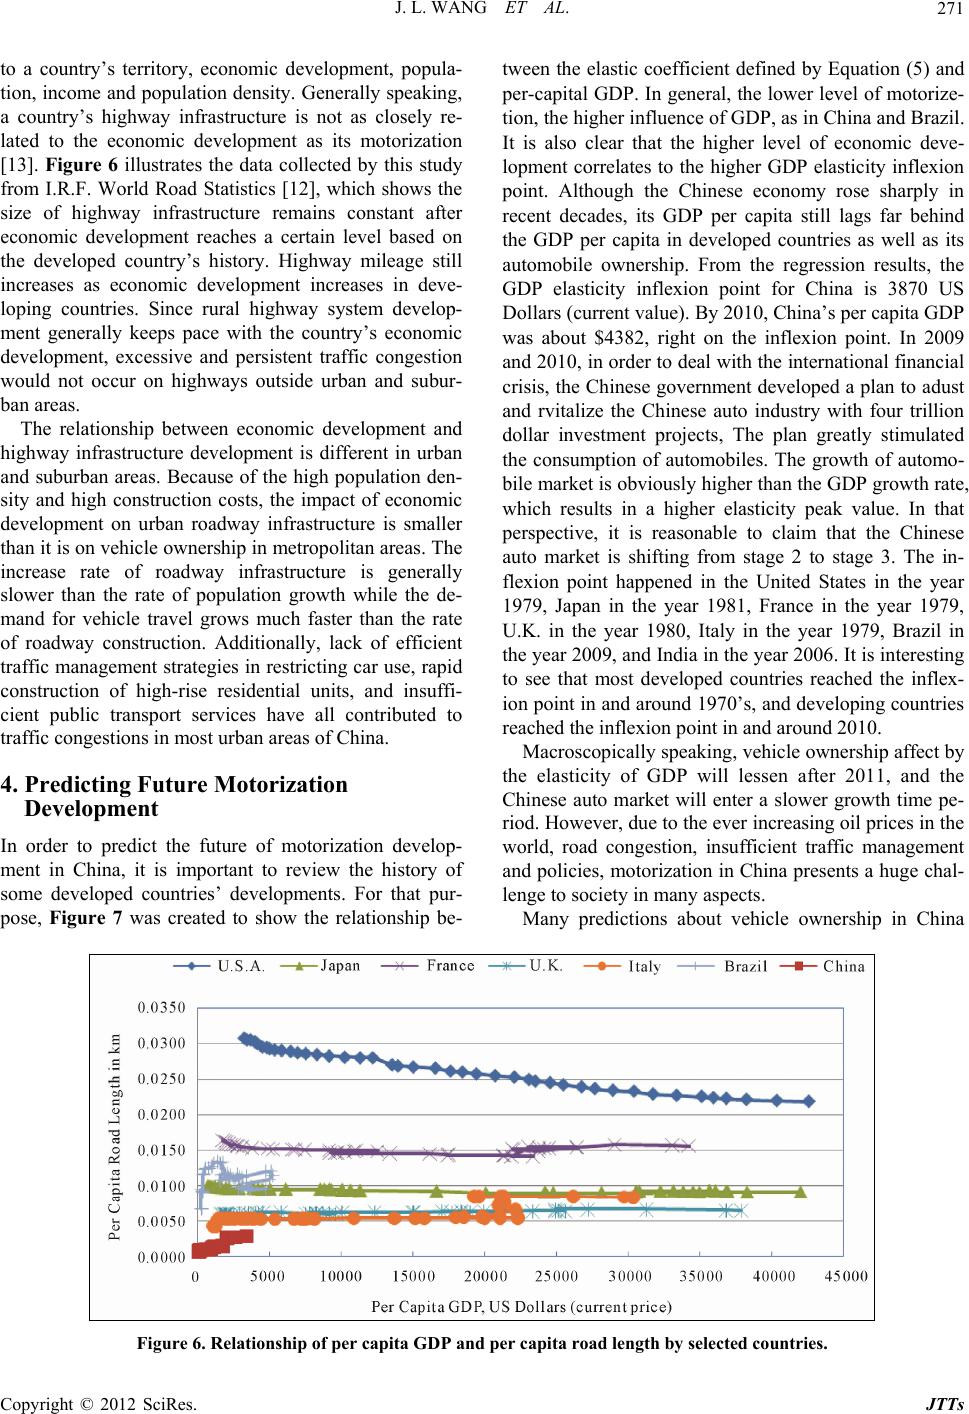 J. L. WANG ET AL. 271 to a country’s territory, economic development, popula- tion, income and population density. Generally speaking, a country’s highway infrastructure is not as closely re- lated to the economic development as its motorization [13]. Figure 6 illustrates the data collected by this study from I.R.F. World Road Statistics [12], which shows the size of highway infrastructure remains constant after economic development reaches a certain level based on the developed country’s history. Highway mileage still increases as economic development increases in deve- loping countries. Since rural highway system develop- ment generally keeps pace with the country’s economic development, excessive and persistent traffic congestion would not occur on highways outside urban and subur- ban areas. The relationship between economic development and highway infrastructure development is different in urban and suburban areas. Because of the high population den- sity and high construction costs, the impact of economic e tween the elastic coefficient defined by Equation (5) and per-capital GDP. In general, the lower level of motorize- tion, the higher influence of GDP, as in China and Brazil. It is also clear that the higher level of economic deve- lopment correlates to the higher GDP elasticity inflexion point. Although the Chinese economy rose sharply in recent decades, its GDP per capita still lags far behind the GDP per capita in developed countries as well as its automobile ownership. From the regression results, the GDP elasticity inflexion point for China is 3870 US Dollars (current value). By 2010, China’s per capita GDP was about $4382, right on the inflexion point. In 2009 and 2010, in order to deal with the international financial crisis, the Chinese government developed a plan to adust and rvitalize the Chinese auto industry with four trillion dollar investment projects, The plan greatly stimulated the consumption of automobiles. The growth of automo- bile market is obviously higher than the GDP growth rate, t 1979, Japan in the year 1981, France in the year 1979, U.K. in the year 1980, Italy in the year 1979, Brazil in the year 2009, and India in the year 2006. I t is interesting to see that most developed countries reached the inflex- ion point in and around 1970’s, and developing countries reached the inflexion point in and around 2010. Macroscopically speaking, vehicle ownership affect by the elasticity of GDP will lessen after 2011, and the Chinese auto market will enter a slower growth time pe- riod. How ever , due to th e ev er increasing oil prices in the world, road congestion, insufficient traffic management and policies, motorization in China presents a huge chal- lenge to society in many aspects. Many predictions about vehicle ownership in China d velopment on urban roadway infrastructure is smaller which results in a higher elasticity peak value. In tha than it is on vehicle ownership in metropolitan areas. The increase rate of roadway infrastructure is generally slower than the rate of population growth while the de- mand for vehicle travel grows much faster than the rate of roadway construction. Additionally, lack of efficient traffic management strategies in restricting car use, rapid construction of high-rise residential units, and insuffi- cient public transport services have all contributed to traffic congestions in most urban areas of China. 4. Predicting Future Motorization Development In order to predict the future of motorization develop- ment in China, it is important to review the history of some developed countries’ developments. For that pur- pose, Figure 7 was created to show the relationship be- perspective, it is reasonable to claim that the Chinese auto market is shifting from stage 2 to stage 3. The in- flexion point happened in the United States in the year Figure 6. Relationship of per capita GDP and per capita road length by selected countries. Copyright © 2012 SciRes. JTTs 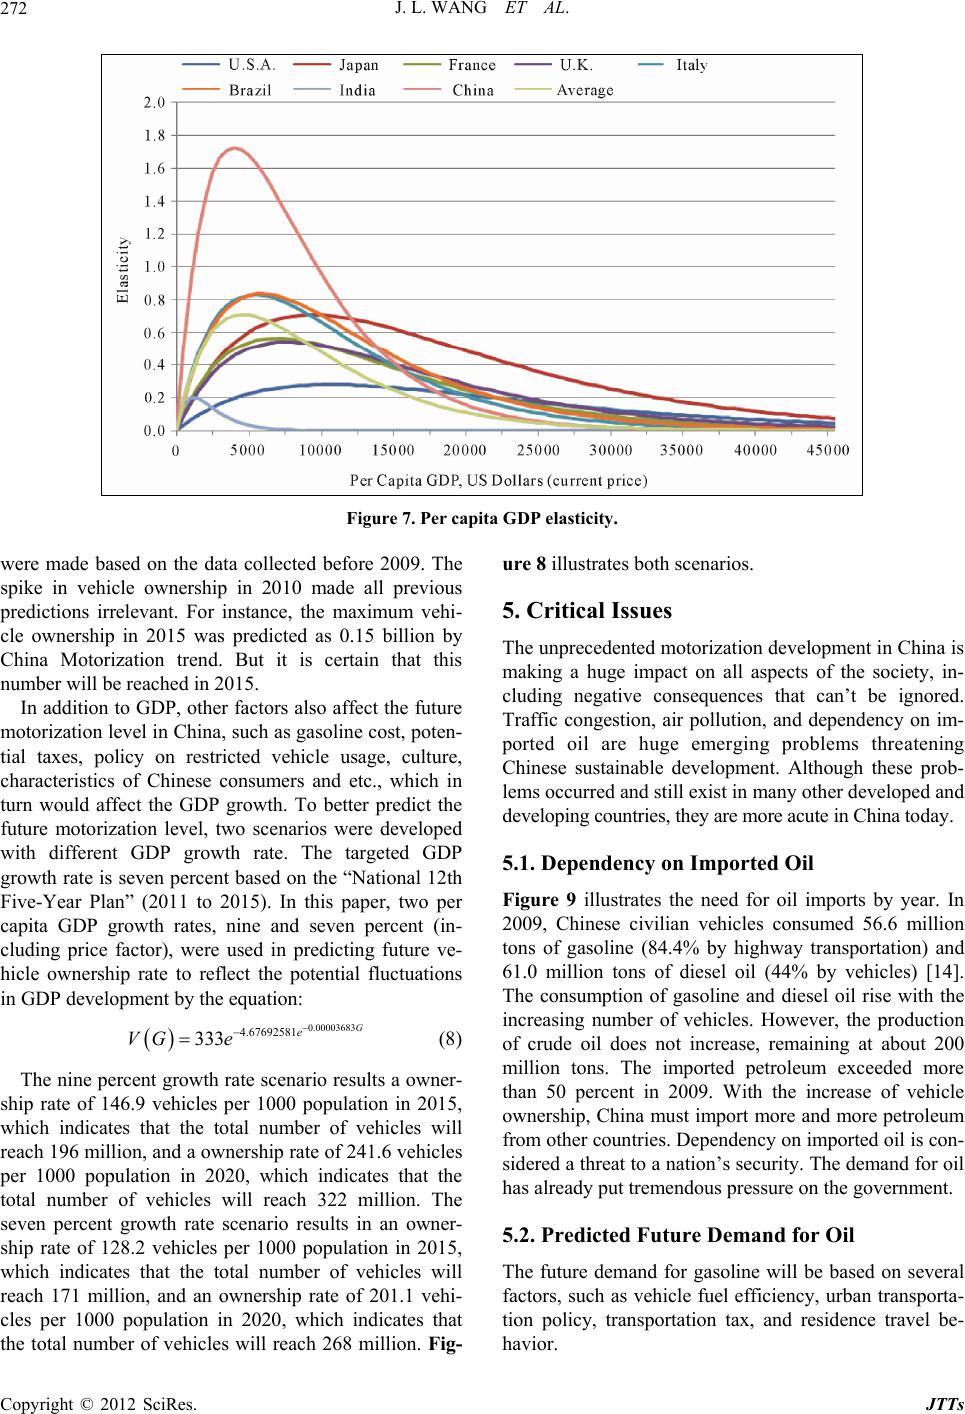 J. L. WANG ET AL. 272 Figure 7. Per capita GDP elasticity. were made based on the data collected before 2009. The spike in vehicle ownership in 2010 made all previous predictions irrelevant. For instance, the maximum vehi- cle ownership in 2015 was predicted as 0.15 billion by China Motorization trend. But it is certain that this number will be reached in 2015. In addition to GDP, other factors also affect the future motorization level in China, such as gasoline cost, poten- tial taxes, policy on restricted vehicle usage, culture, characteristics of Chinese consumers and etc., which in turn would affect the GDP growth. To better predict the future motorization level, two scenarios were developed with different GDP growth rate. The targeted GDP growth rate is seven percent based on the “National 12th Five-Year Plan” capita GDP growth rates, nine and seven percent (in- cluding price factor), were used in predicting future ve- hicle ownership rate to reflect the potential fluctuations in GDP development by the equation: (8) The nine percent growth rate scenario results a owner- ship rate of 146.9 vehicles per 1000 population in 2015, which indicates that the total number of vehicles will reach 196 million, and a ownership rate of 241.6 vehicles per 1000 population in 2020, which indicates that the total number of vehicles will reach 322 million. The seven percent growth rate scenario results in an owner- ship rate of 128.2 vehicles per 1000 population in 2015, which indicates that the total number of vehicles will reach 171 million, and an ownership rate of 201.1 vehi- cles per 1000 population in 2020, which indicates that the total number of vehicles will reach 268 million. Fig- ure 8 illustrates both scenarios. 5. Critical Issues The unprecedented motorization development in China is making a huge impact on all aspects of the society, in- cluding negative consequences that can’t be ignored. Traffic congestion, air pollution, and dependency on im- ported oil are huge emerging problems threatening Chinese sustainable development. Although these prob- lems occurred and still exist in many other developed and developing countries, they are more acute in China today. 5.1. Dependency on Imported Oil orts by year. In ed 56.6 million tons of gasoline (84.4% by highway transportation) and 61.0 million tons of diesel oil (44% by vehicles) [14]. The consumption of gasoline and diesel oil rise with the increasing number of vehicles. However, the production of crude oil does not increase, remaining at about 200 million tons. The imported petroleum exceeded more than 50 percent in 2009. With the increase of vehicle ownership, China must import more and more petroleum from other countries. Dependency on imported oil is con- sidered a threat to a nation’s security. The demand for oil has already put tremendous pr ess ur e on the g overnm en t. 5.2. Predicted Future Demand for Oil The future demand for gasoline will be based on several factors, such as vehicle fuel efficiency, urban transporta- tion policy, transportation tax, and residence travel be- havior. (2011 to 2015). In this paper, two per Figure 9 illustrates the need for oil imp 2009, Chinese civilian vehicles consum 0.00003683 4.67692581 333 G e VG e Copyright © 2012 SciRes. JTTs  J. L. WANG ET AL. 273 Figure 8. Predicting the vehicle ownershi p in China (Indicate curve by 9% and 7%). Figure 9. Annually oil consumption and production in Chin ferences [15,16]; Note: one ton of c a and the contries expported oil to China in 2010 (Source: re- rude oil ≈ 7 barrels of crude oil). In 2009 the 73% of vehicles using gasoline consumed about 1.17 tons gas per vehicle per year. Considering future demand of private vehicles that use gasoline, gasoline consumption vehicles will increase to 78% in 2015 and 83% in 2020 . Th e an nual g aso lin e consumption per vehicle will be reduced because of several reasons. First, the government has requested the consumption of gasoline for 100 kilometers must be decreased from the current 8 liters to 5.9 liters for all new vehicles, resulting a 26% improvement in fuel economy. The government promoting public transit polices also encourages more commuters to choose mass transporta- tion options during rush hours, which reduces the use of private vehicles. Increased taxes on gasoline and parking fees along with res eekdays (by vehic duce vehicle use. Another factor contributing to the lower usage of vehicles is that the majority of vehicles are sold to private citizens, not to companies or govern- ment agencies; private vehicles are driven less than business owned vehicles. Because of the above stated factors, it is predicted that the average vehicle gasoline consumption per 100 kilometers will decrease about 26% by 2015. It is predicted that technology improvement in fuel economy will result in a 5% decrease annually in gasoline consumption, and reduced vehicle travel would result in a 2% decrease in gasoline consumption. Similar to vehicles using gasoline, the annual average diesel consumption will also decrease significantly for vehicles using diesel oil because: 1) the proportion of higher fuel efficiency heavy trucks will increase; 2) mileage; and 3) . It is predicted the average diesel oil consumption per vehicle will drop 30% trictions on the use of vehicles during le’s license plate number) would also technology improvement increase gas lighter trucks reduce fuel consumptionw re Copyright © 2012 SciRes. JTTs  J. L. WANG ET AL. 274 in 2015 from the 2009 level. The predicted fuel consumptions are summarized in Table 3, which shows that the percentage of fuel con- sumption increase will be smaller than the increase in vehicles. With 90% of total gasoline consumption for automo- biles and 45% of total diesel consumption for diesel ve- hicles, the demand for crude oil with the 9% growth rate scenario will be 0.70 billion tons in 2015 and 0.79 billion tons in 2020. The demand for crude oil with the 7% growth rate scenario will be 0.61 billion tons in 2015 and 0.66 billion tons in 2020. If crude oil production in China will only increase by 20 million tons each year, the total production of domestic crude oil will be 0.22 billion tons in 2015 and 0.24 billion tons in 2020, which makes China heavily reliant on imported oil. China will need 68.6% of oil imported from other countries in 2015 and 015 and 63.4% in 2020 with the 7% growth rate sce- na pollution. The speed of economic development is much faster in large cities that attract an influx of laborers to cities, which worsens the traffic situation. Based on the data from four large cities administrated directly by the na- tional government, the roadway mileage per person is either status-quo or decreases while the vehicle owner- ship increases rapidly, as shown in Figures 10 and 11. This trend will continue for the near future in China. 5.4. Traffic Safety According to statistics from Ministry of Public Security, in 2010 there were 3,906,164 recorded roadway traffic accidents, up 35.9% from the last year, and 65,225 traffic fatalities, down 3.7% from the last year. At present, China is number one in recorded traffic fatalities. The oped countries, as shown in Figure 11 [17] . ment will expectedly in- as 4.8 million tons, and particulate . Most pollutants are emitted 69.5% in 2020 with the 9% growth rate scenario. China will need 64.1% of oil imported from other countries in 2rio. It is clear that the motorization development forces China heavily depend on imported oil, which puts the country in a very vulnerable and uneasy position. 5.3. Traffic Congestion At the present time, severe traffic congestion has already become a way of life in most urban areas throughout China. Because of the income gap between urban and rural, regional income gaps are very big, most vehicles are running in big cities where population densities are high. Roadway construction in urban areas is far behind the vehicle growth rate; meanwhile, Chinese city plan- ning, transportation planning and traffic management lack forward-thinking and long-term planning. Most of the plans have underestimated automobile growth, which partly explains why traffic congestion is so bad in the cities. Traffic congestion greatly extends travel time, in- creases travel cost, pollutes air quality, and induces noise Table 3. Predicted fuel consumption in 2015 and 2020. Year Vehicles 10,000 Gasoline vehicles 10,000 Gasoline consumption 10,000 tons Diesel vehicles 10,000 Diesel consumption 10,000 ton 2009 6281 4617 5400 1663 5822 The first scenario 2015 19603 15290 9727 4313 10567 2020 32241 26760 11907 5481 11415 The second scenario 2015 17110 13346 8490 3764 9223 2020 26836 22275 9911 4562 9502 fatality rate in terms of number of fatalities per 10,000 vehicles is three to five times higher than the rates of devel Rapid motorization develop crease traffic accident frequency in China although the accident rate may be reduced with massive government highway safety improvement projects. The challenges in highway safety come from not only the rapid motorize- tion development, but also poor safety awareness, over- loaded trucks, and so metimes insufficient road way d esig n standards. If the current fatality rate is used to predict future ac- cident frequencies, the situation is very worrisome. The fever for automobile ownership is shifting from major cities, such as Beijing and Shanghai, to other medium (population is between 10 and 15 million) and small ur- ban areas (population less than five million). Safety awareness is much weaker in these cities along with weak safety education programs and other roadway de- sign and traffic control problems. Accidents on rural highways crossing the country are also increasing in number in recent years. 5.5. Environmental Protection In 2009, pollution by motor exhaust was 51.4 million tons, in which CO was 40.1 million tons, HC w million tons, NOx was 5.8 matter was 0.6 million tons by automobiles. In many cities, especially large and me- dium-sized cities, air pollution presents a characteristic that the combined pollution of coal smoke and automo- bile exhaust makes it very difficult to control atmos- pheric pollution. Meanwhile, some areas of China often experience atmospheric pollution problems, such as acid rain, gray haze and light chemicals, with one area ex- periencing more than 200 days of gray haze weather. These problems are directly related to vehicle emissions Copyright © 2012 SciRes. JTTs 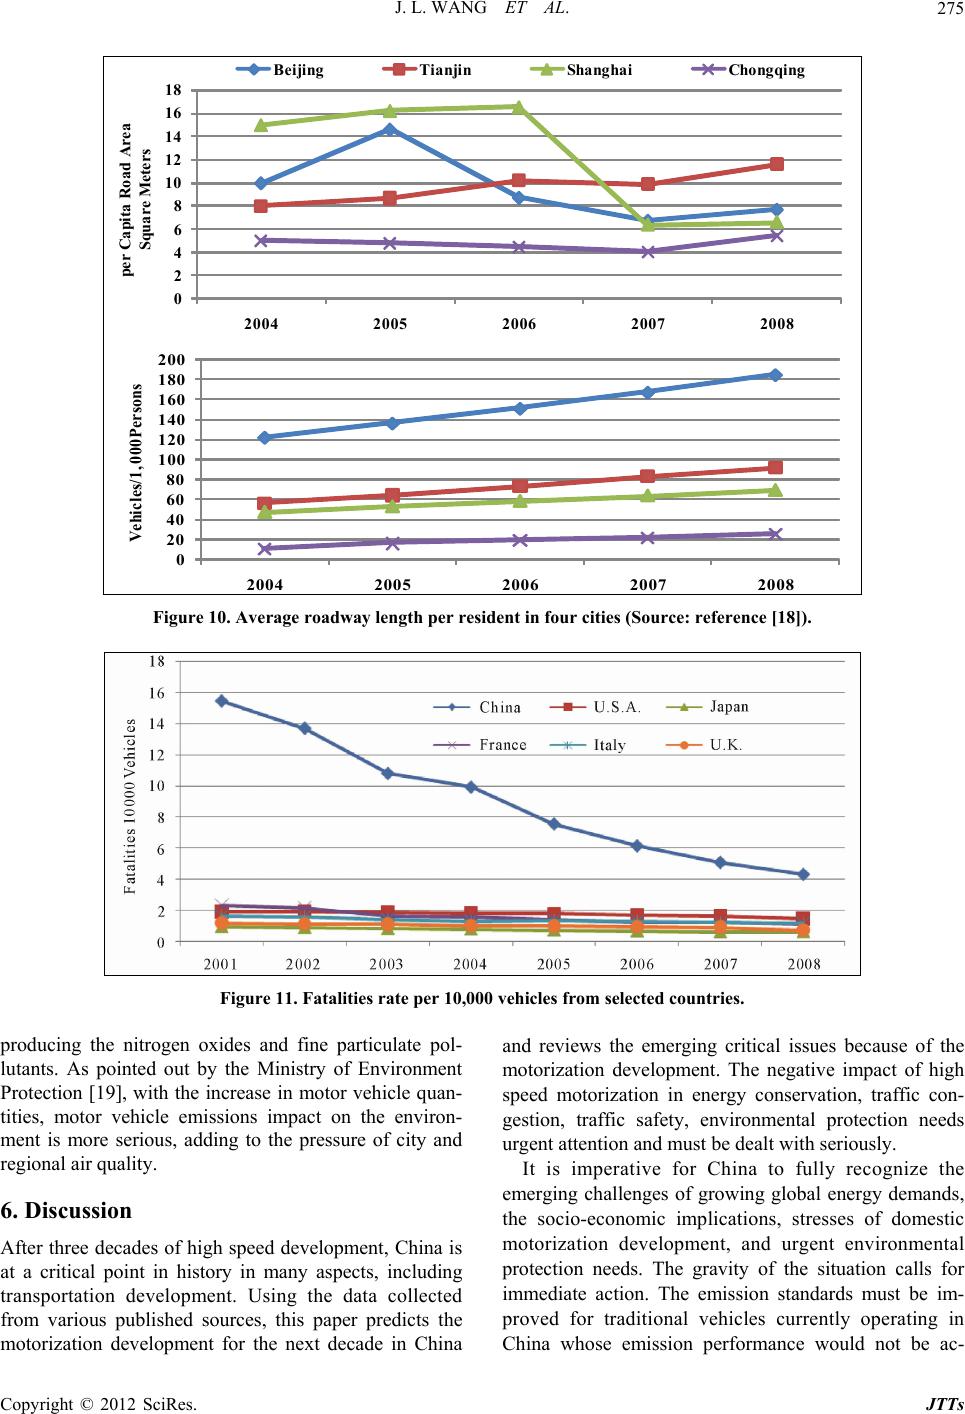 J. L. WANG ET AL. Copyright © 2012 SciRes. JTTs 275 0 2 4 Sq 6 10 20 ap o u 8 ita R are M 12 14 16 18 ad Area eters 200405 20062007 2008 per C Beijing Tianjin ShanghaiCho n gqin g 0 2004 2005 20 100 120 200 Vehicles/1, ersons 40 60 80 140 160 180 000P 2006 2007 2008 idFigure 10. Average roadway length per res ent in four cities (Source: reference [18]). Figure 11. Fatalities rate per 10,000 vehicles from selected countries. producing the nitrogen oxides and fine particulate pol- lutants. As pointed out by the Ministry of Environment Protection [19], with the increase in motor vehicle quan- tities, motor vehicle emissions impact on the environ- ment is more serious, adding to the pressure of city and regional air quality. 6. Discussion After three decades of high speed development, China is at a critical point in history in many aspects, including transportation development. Using the data collected from various published sources, this paper predicts the motorization development for the next decade in China and reviews the emerging critical issues because of the motorization development. The negative impact of high speed motorization in energy conservation, traffic con- gestion, traffic safety, environmental protection needs urgent attention and must be dealt with seriously. It is imperative for China to fully recognize the emerging challenges of growing global energy demands, the socio-economic implications, stresses of domestic motorization development, and urgent environmental protection needs. The gravity of the situation calls for immediate action. The emission standards must be im- proved for traditional vehicles currently operating in China whose emission performance would not be ac- 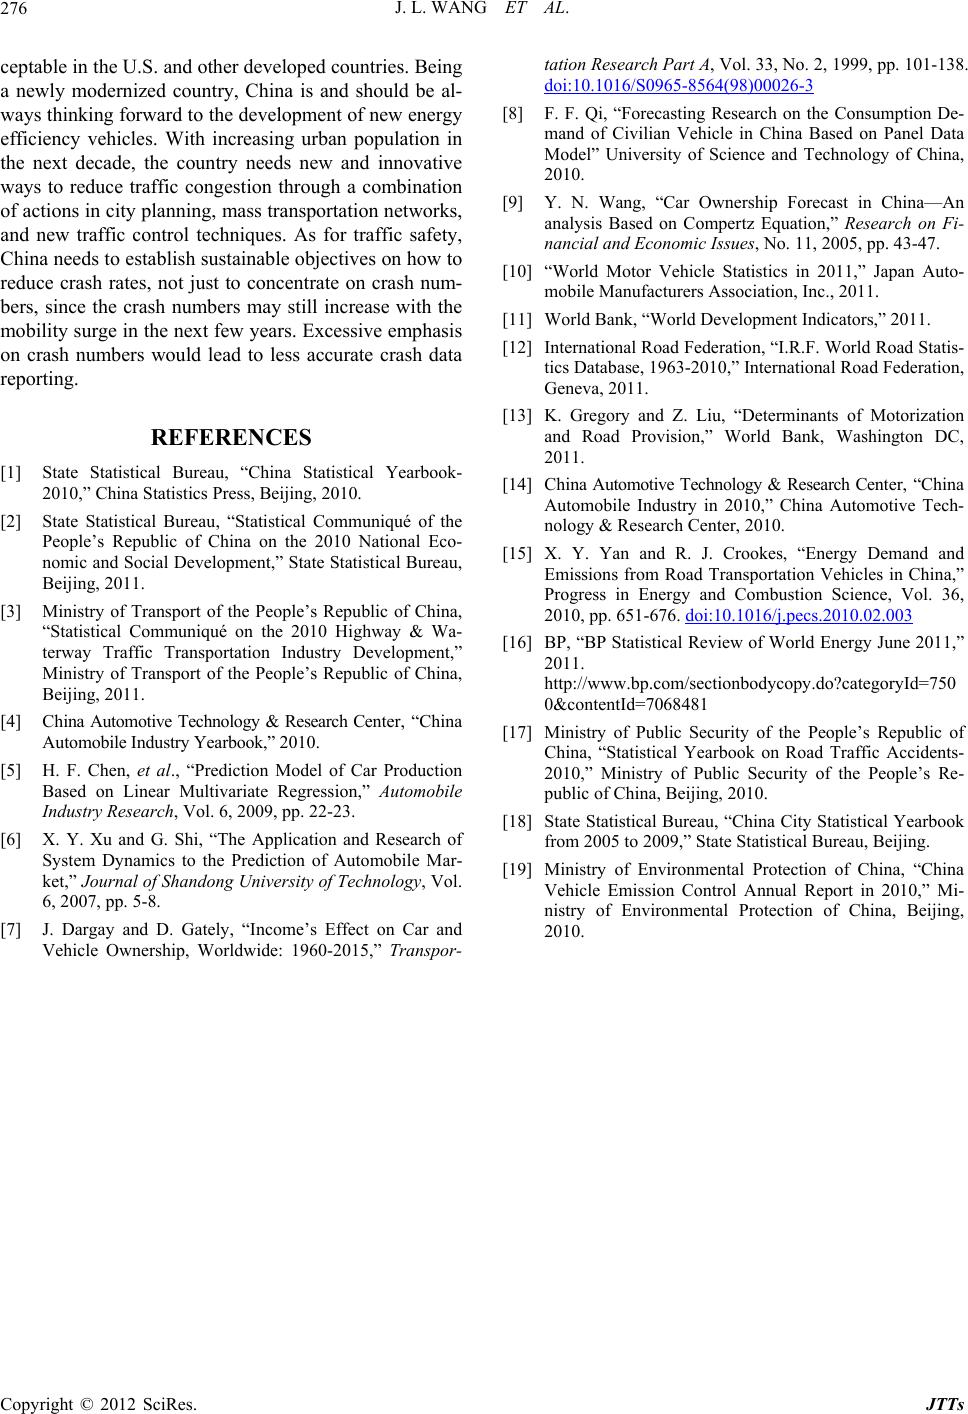 J. L. WANG ET AL. 276 ceptable in the U.S. and other developed countries. Being a newly modernized country, China is and should be al- ways thinking forward to the development of new energy efficiency vehicles. With increasing urban population in the next decade, the country needs new and innovative ways to reduce traffic congestion through a combination of actions in city planning, mass transportation networks, and new traffic control techniques. As for traffic safety, China needs to establish sustainable objectives on how to reduce crash rates, not just to concentrate on crash num- bers, since the crash numbers may still increase with the mobility surge in the next few years. Excessive emphasis on crash numbers would lead to less accurate crash data reporting. REFERENCES [1] State Statistical Bureau, “China Statistical Yearbook- 2010,” China Statistics Press, Beijing, 2010. [2] State Statistical Bureau, “Statistical Communiqué of the People’s Republic of China on the 2010 National Eco- nomic and Social Development,” Stat e Statistical Bureau, Beijing, 2011. [3] Ministry of Transport of the People’s Republic of China, “Statistical Communiqué on the 2010 Highway & Wa- terway Traffic Ministry of Transport of the People’s Republic of China, Beijing, 2011. [4] China Automotive Technology & Research Center, “China Automobile Industry Yearbook,” 2010. [5] H. F. Chen, et al., “Prediction Model of Car Production Based on Linear Multivariate Regression,” Automobile Industry Research, Vol. 6, 2009, pp. 22-23. [6] X. Y. Xu and G. Shi, “The Application and Research of System Dynamics to the Prediction of Automobile Mar- ket,” Journal of Shandong University of Technology, Vol. 6, 2007, pp. 5-8. [7] J. Dargay and D. Gately, “Income’s Effect on Car and Vehicle Ownership, Worldwide: 1960-2015,” Transpor- tation Research Part A, Vol. 33, No. 2, 1999, pp. 101-138. doi:10.1016/S0965-8564(98)00026-3 [8] F. F. Qi, “Forecasting Research on the Consumption De- mand of Civilian Vehicle in China Based on Panel Data Model” University of Science and Technology of China, 2010. [9] Y. N. Wang, “Car Ownership Forecast in China—An analysis Based on Compertz Equation,” Research on Fi- nancial and Economic Issues, No. 11, 2005, pp. 43-47. [10] “World Motor Vehicle Statistics in 2011,” Japan Auto- mobile Manufacturers Association, Inc., 2011. [11] World Bank, “World Development Indicators,” 2011. [12] International Road Federation, “I.R.F. World Road Statis- tics Database, 1963-2010,” International Road Federation, Geneva, 2011. [13] K. Gregory and Z. Liu, “Determinants of Motorization and Road Provision,” World Bank, Washington DC, 2011. [14] Ch ina Automotive Technology & Research Center , “Ch ina Automobile Industry in 2010,” China Automotive Tech- nology & Research Center, 2010. [15] X. Y. Yan and R. J. Crookes, “Energy Demand and Emissions from Road Transportation Vehicles in China,” Progress in Energy and Combustion Science, Vol. 36, 2010, pp. 651-676. doi:10.1016/j.pecs.2010.02.003 Transportation Industry Development,” Energy June 2011,” http://www.bp.com/sectionbodycopy.do?categoryId=750 0&contentId=7068481 [17] Ministry of Public Security of the People’s Republic of China, “Statistical Yearbook on Road Traffic Accidents- 2010,” Ministry of Public Security of the People’s Re- public of China, Beijing, 2010. [18] State Statistical Bureau, “China City Statistical Yearbook from 2005 to 2009,” State Statistical Bureau, Beijing. [19] Ministry of Environmental Protection of China, “China Vehicle Emission Control Annual Report in 2010,” Mi- nistry of Environmental Protection of China, Beijing, 2010. [16] BP, “BP Statistical Review of World 2011. Copyright © 2012 SciRes. JTTs |