D. CHIMBA ET AL.
218
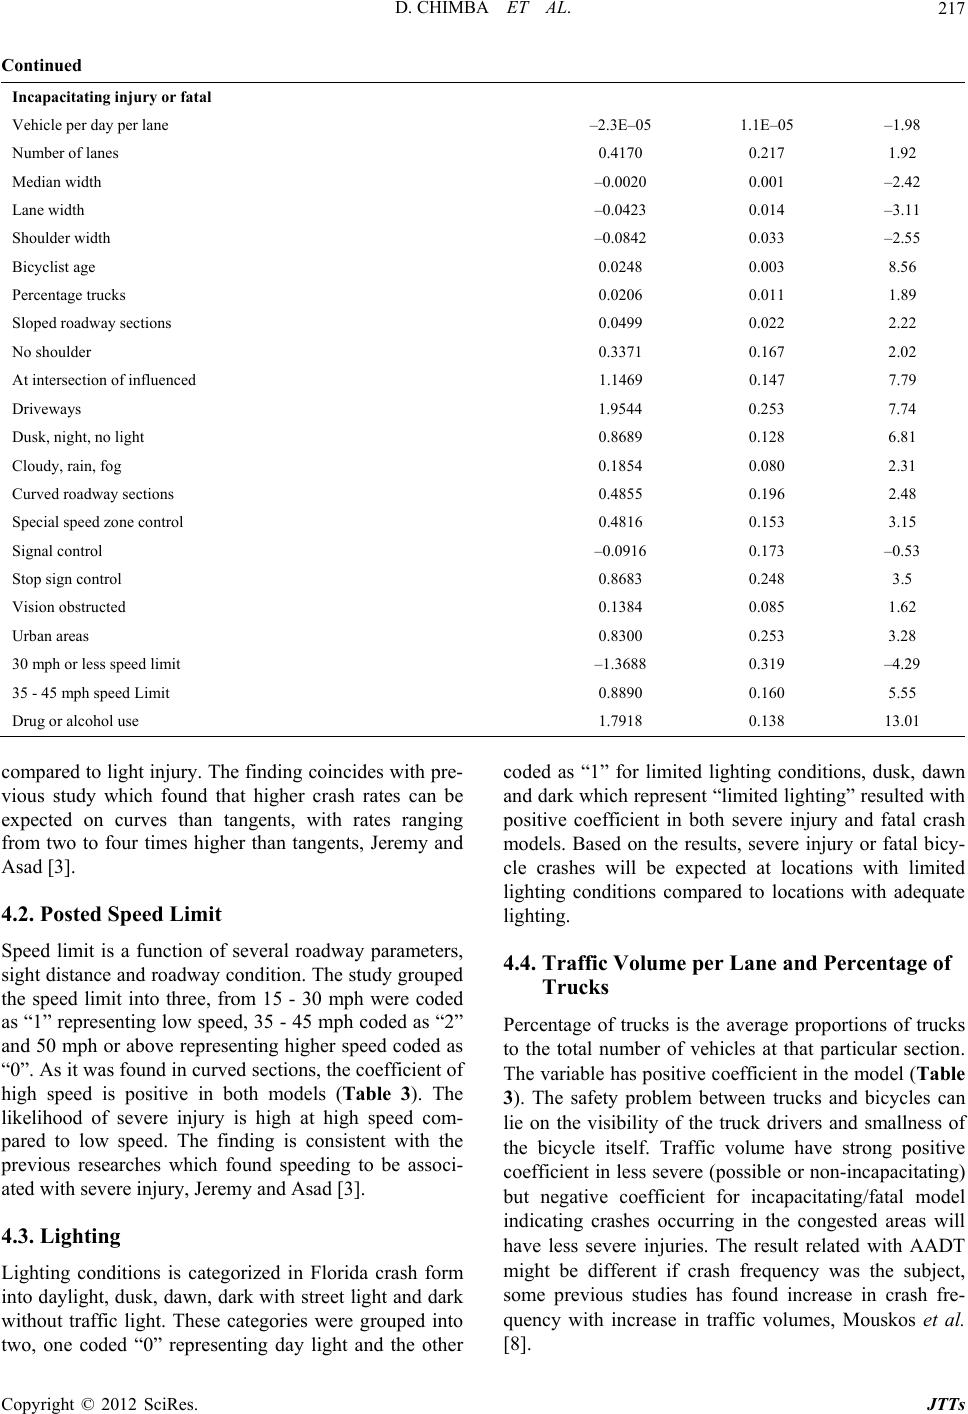
4.5. Location
Crash location refers to location on the roadway where
the crash occurred. The location can be at the intersection,
driveways, ramps, railroad, bridges, parking lots, toll
booth and public bus stops. In modeling, the factors were
grouped into 3 categories with code “0” representing
non-intersection related crashes, “1” representing at in-
tersection or intersection influenced crashes, “2” for
driveways and “3” representing other remaining location
categories. Result shows bicycle crashes occurring at
driveways and intersections are likely to result in either
non-incapacitating, incapacitating injury, or fatal (Table
3).
4.6. Age
Older bicyclists seem to be more vulnerable to fatal in-
jury than younger ones. The models show positive, sig-
nificant coefficient in the fatal injury category in both
models (Table 3). This finding is consistent with the
previous research which found increase in age to be as-
sociated with likelihood of severe injury crash (Shankar
and Mannering [5]).
4.7. Number of Lanes, Lane Width, Shoulder
Width and Median Width
As expected, number of lanes showed positive coeffi-
cients to injury severity, the finding which is consistent
with findings from previous studies that evaluated crashes
involving bicycle and all other vehicle types, Theodore et
al., Miao and Lump, Miao, Garber and Ehrhart [9-12]. In
multilane segments, as the number of vehicles per lane
increases, there become fewer gaps to allow lane chang-
ing, turning movements, or merging, which eventually
increases the likelihood of crashes. Median width is sig-
nificant with a n egative co efficient, indicating likeliho od
of bicycle crash injuries severity level decreases as me-
dian width increases. This is consistent with many pre-
vious studies, Milton and Mannering, Abdel-Aty and
Radwan and Lee and Mannering [13-15]. The results
show that wider lanes reduce the probability of severe
injury. Wider lanes can be used by a bicyclist as a room
for correcting errors in the situation of near crash occur-
rence. Wider shoulders have negative coefficient show-
ing its important role in reducing bicycle crash injury
severities. From a highway safety point of view, a
shoulder can be used by a bicyclist to stop in case of an
emergency or during an incident, and drivers can take
advantage of wider shoulders to avoid hitting roadside
objects. In addi tion, bicycli sts can veer to w ider shoulders
to avoid a crash.
5. Conclusion
The model results indicate that there are significant fac-
tors that influence bicycle injury severities on the high-
ways. Significance of these factors to the occurrence of
crashes varies depending on human judgment, contribut-
ing causes, environmental conditions, traffic characteris-
tics, geometrics and location on highways. The multino-
mial Logit (MNL) model was used for analysis as it al-
lows the use of one injury severity as a reference cate-
gory while analyzing others. The results showed that,
increase in number of lanes, alcohol and drug use, high
posted speed limit links, curved areas, turning move-
ments, intersection and driveways, and driving with no
adequate daylight have strong significance effects on
intensifying injury severity. In addition, the higher the
percentage of trucks and the older the bicyclist means the
more severe the injury. Regarding traffic volumes, the
study found that under congestion condition few severe
incidents occur though higher crash frequencies can be
expected. Limited lighting locations was found to be as-
sociated with incapacitating injury and fatal crashes, in-
dicating that insufficient visibility can potentially lead to
severe crashes.
REFERENCES
[1] NHTSA’s National Center for Statistics and Analysis,
“NHTSA Traffic Safety Facts, 2008, Data,” 2008.
http://www-nrd.nhtsa.dot.gov/pubs/811156.pdf
[2] A. Cheryl, D. Janice and D. Sunil, “Logistic Model for
Rating Urban Bicycle Route Safety,” Transportation Re-
search Record, Vol. 1878, 2004, pp. 107-115.
[3] R. K. Jeremy and J. K. Asad, “Factors Influencing Bicy-
cle Crash Severity on Two-Lane, Undivided Roadways in
North Carolina,” Transportation Research Record, Vol.
1674, 1999, pp. 99-1109.
[4] K. Karl and L. Lei, “Modeling Fault among Bicyclists
and Drivers Involved in Collisions in Hawaii, 1986-
1991,” Transportation Research Record, Vol. 1539, 1996,
pp. 75-80.
[5] V. Shankar and F. Mannering, “An Exploratory Multi-
nomial Logit Analysis of Single-Vehicle Motorcycle Ac-
cide nt Seve rity ,” Journal of Safety Research, Vol. 27, No.
3, 1996, pp. 183-194. doi:10.1016/0022-4375(96)00010-2
[6] M. A. Quddus, R. B. Noland and H. C. Chin, “An Analy-
sis of Motorcycle Injury and Vehicle Damage Severity
Using Ordered Probit Models,” Journal of Safety Re-
search, Vol. 33, No. 4, 2002, pp. 445-462.
doi:10.1016/S0022-4375(02)00051-8
[7] S. P. Washington, M. G. Karlaftis and F. L. Mannering,
“Statistical and Econometric Methods for Transportation
Data Analysis,” Chapman & Hall/CRC, Boca Raton,
2002.
[8] K. C. Mouskos, W. Sun and T. Qu, “Impact of Access
Driveways on Accident Rates at Multilane Highways,”
National Center for Transportation and Industrial Produc-
tivity, New Jersey Institute of Technology, 1999.
[9] A. P. Theodore, W. L. Bruce, F. H. Herman and C. Sri-
Copyright © 2012 SciRes. JTTs