Paper Menu >>
Journal Menu >>
 Journal of Minera ls & Materials Ch ar ac teri zatio n & Engineeri ng, Vol. 11, No.6, pp.631-639, 2012 jmmce.org Printed in the USA. All rights reserved 631 Growth, Structural, Spectral and Optical Studies on Pure and L-Alanine Mixed Bisthiourea Cadmium Bromide (LABTCB) Crystals M.Senthilkumar and C.Ramachandraraja* Department of Physics, Govt. Arts College (Autonomous), Kumbakonam 612 001, India. *Corresponding author: crraja_phy@yahoo.com ABSTRACT Pure bisthiourea cadmium bromide (BTCB) and 1 mole % L-alanine mixed bisthiourea cadmium bromide (LABTCB) single crystals have been grown by slow evaporation method. The grown crystals have been characterized by single crystal XRD analysis, powder XRD analysis, FTIR analysis, UV-Vis-NIR analysis and SHG studies. XRD analysis confirms the crystalline nature of the materials. The addition of L-alanine changes the crystal structure from orthorhombic to tetragonal. The presence of various functional groups present in the pure BTCB and LABTCB crystals have been confirmed by FTIR analysis. The UV-Vis-NIR spectrum shows the transmission characteristics of the crystals. The SHG study depicts the nonlinear optical efficiency of the crystals. Keywords: Crystal growth; Slow evaporation method; X-ray diffraction; FT-IR, UV-Vis-NIR; Second harmonic generation. 1. INTRODUCTION Nonlinear optical (NLO) materials play a vital role in optical modulation, fiber optic communication and optoelectronics since they are capable of producing higher values of original frequency. A continuous effort is on in growing organic, inorganic and semiorganic materials with high damage threshold, wide transparency range and high nonlinear coefficient which make them suitable for device fabrication. Bisthiourea cadmium bromide is one semi organic material which exhibits both. Semiorganic materials possess better thermal stability property of inorganic materials and higher nonlinear coefficient property of organic materials [1-5]. As we do doping in semiconductor to improve its conductivity, we dope the semi organic material with an organic material which may yield better nonlinear optical properties.They are identified as useful crystals for nonlinear optical applications in optical communication, optical switching, optical data storage, optical information processing,  632 M. Senthilkumar and C. Ramachandraraja Vol.11, No.6 frequency conversion and electro-optical modulation[6-11]. The authors in the present work have tried to dope bisthiourea cadmium bromide with 1 mole % of L- alanine. 2. EXPERIMENTAL DETAILS BTCB crystal is synthesized by dissolving AR grade thiourea and AR grade cadmium bromide in the molar ratio 2:1 in distilled water. The saturated solution of cadmium bromide was slowly added to the saturated solution of thiourea. This was stirred well to get a clear solution. Pure BTCB crystal was synthesized according to the reaction: 2[CS (NH2)2] + CdBr2 → Cd [CS (NH2)2]2 Br2 The solution was purified by repeated filtration. The saturated solution was kept in a beaker covered with polythene paper. For slow evaporation 6 or 7 holes were made in the polythene paper. Then the solution was left undisturbed in a constant temperature bath (CTB) kept at a temperature of 35 °C with an accuracy of ± 0.1° C. As a result of slow evaporation, after 75 days colorless and transparent pure BTCB crystals were obtained. The same procedure was followed to grow 1 mole % L-alanine mixed BTCB crystals. 3. RESULT AND DISCUSSION 3.1. Single Crystal XRD Analysis The single crystal XRD analysis of pure BTCB and 1 mole % L-alanine mixed BTCB crystals were carried out using ENRAF NONIUS CAD 4 single crystal X-ray diffractometer with MoKα (λ=0.071073 Å) radiation. From the XRD data, it was observed that the crystal system of pure BTCB crystal is orthorhombic. The observed unit cell parameters are in agreement with the reported literature values. BTCB mixed with 1 mole % L-alanine belongs to tetragonal crystal system. The determined unit cell parameters and the observed crystal system are presented in Table 1. The increase in cell volume is due to the incorporation L-alanine in the grown crystals. Table 1: Unit cell parameters of BTCB and LABTCB crystals S. No. Crystal name Axial lengths of unit cell (a, b and c) Inter axial angles (α, β and γ) Volume Crystal system 1 Pure BTCB a = 5.6949 Å b = 6.6051 Å c = 7.5937 Å α=β= γ=90° 285.6399(4) Å3 Orthorhombic 2 LABTCB a = 9.234 Å b = 13.747 Å c = 13.75 Å α=β= γ=90° 1746.7(9) Å3 Tetragonal 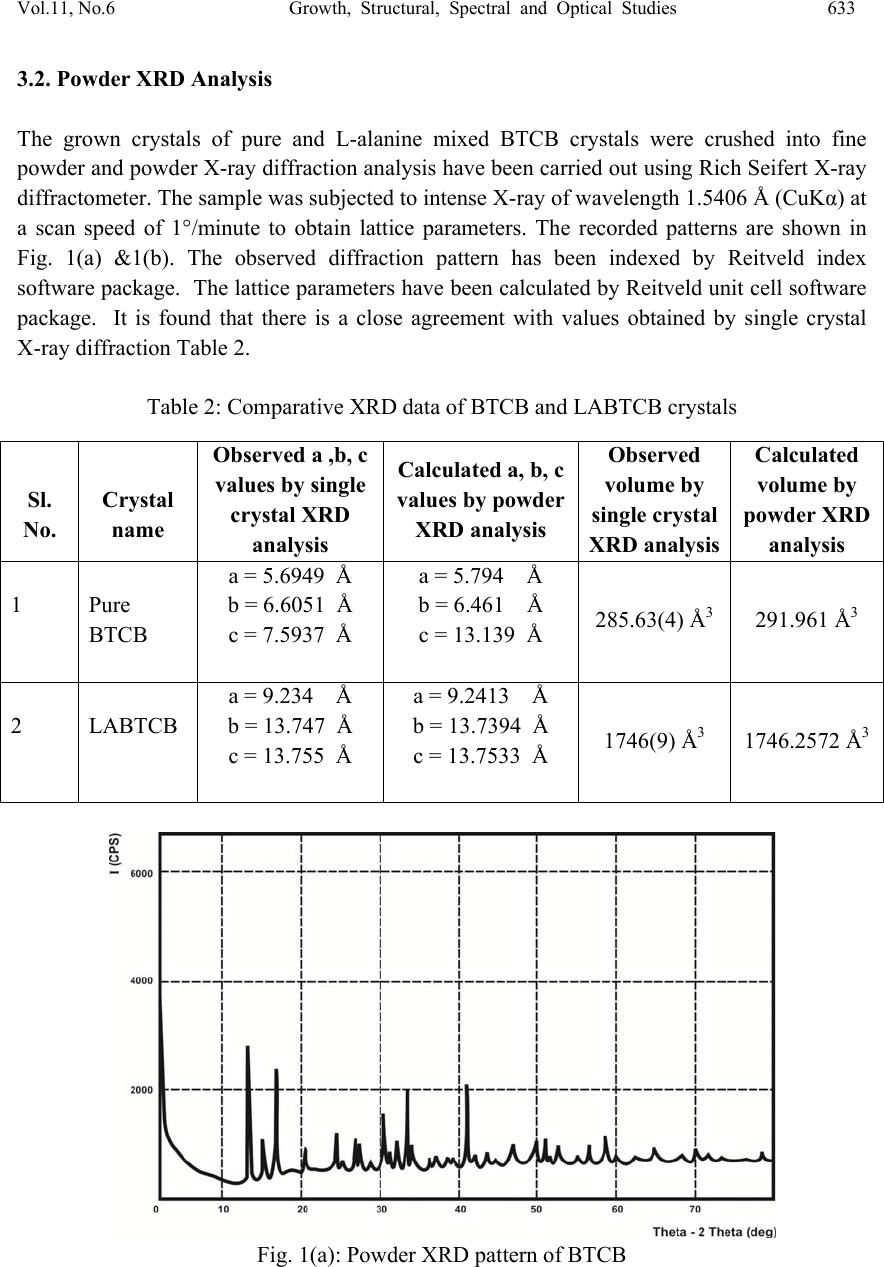 Vol.11, No.6 Growth, Structural, Spectral and Optical Studies 633 3.2. Powder XRD Analysis The grown crystals of pure and L-alanine mixed BTCB crystals were crushed into fine powder and powder X-ray diffraction analysis have been carried out using Rich Seifert X-ray diffractometer. The sample was subjected to intense X-ray of wavelength 1.5406 Å (CuKα) at a scan speed of 1°/minute to obtain lattice parameters. The recorded patterns are shown in Fig. 1(a) &1(b). The observed diffraction pattern has been indexed by Reitveld index software package. The lattice parameters have been calculated by Reitveld unit cell software package. It is found that there is a close agreement with values obtained by single crystal X-ray diffraction Table 2. Table 2: Comparative XRD data of BTCB and LABTCB crystals Fig. 1(a): Powder XRD pattern of BTCB Sl. No. Crystal name Observed a ,b, c values by single crystal XRD analysis Calculated a, b, c values by powder XRD analysis Observed volume by single crystal XRD analysis Calculated volume by powder XRD analysis 1 Pure BTCB a = 5.6949 Å b = 6.6051 Å c = 7.5937 Å a = 5.794 Å b = 6.461 Å c = 13.139 Å 285.63(4) Å3 291.961 Å3 2 LABTCB a = 9.234 Å b = 13.747 Å c = 13.755 Å a = 9.2413 Å b = 13.7394 Å c = 13.7533 Å 1746(9) Å3 1746.2572 Å3 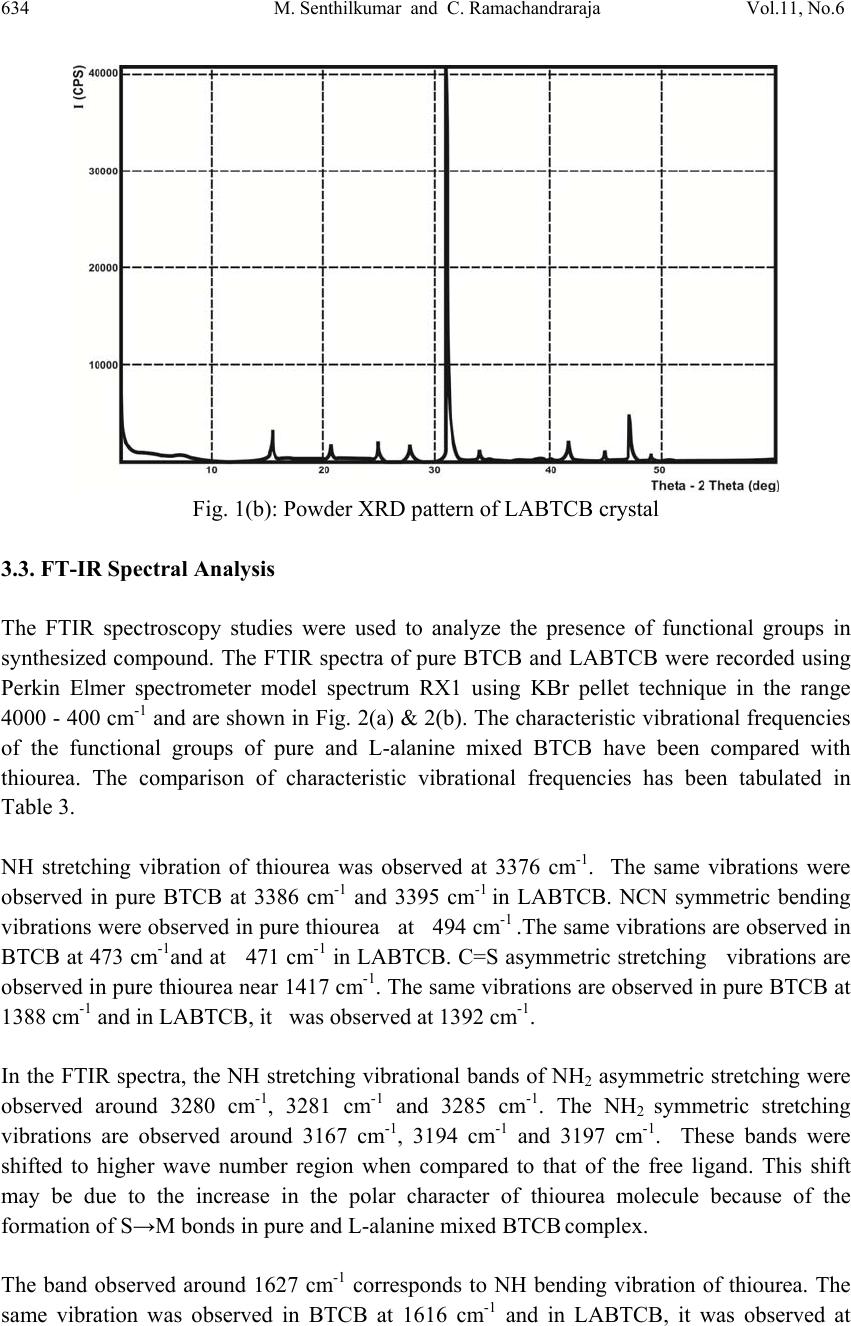 634 M. Senthilkumar and C. Ramachandraraja Vol.11, No.6 Fig. 1(b): Powder XRD pattern of LABTCB crystal 3.3. FT-IR Spectral Analysis The FTIR spectroscopy studies were used to analyze the presence of functional groups in synthesized compound. The FTIR spectra of pure BTCB and LABTCB were recorded using Perkin Elmer spectrometer model spectrum RX1 using KBr pellet technique in the range 4000 - 400 cm-1 and are shown in Fig. 2(a) & 2(b). The characteristic vibrational frequencies of the functional groups of pure and L-alanine mixed BTCB have been compared with thiourea. The comparison of characteristic vibrational frequencies has been tabulated in Table 3. NH stretching vibration of thiourea was observed at 3376 cm-1. The same vibrations were observed in pure BTCB at 3386 cm-1 and 3395 cm-1 in LABTCB. NCN symmetric bending vibrations were observed in pure thiourea at 494 cm-1 .The same vibrations are observed in BTCB at 473 cm-1and at 471 cm-1 in LABTCB. C=S asymmetric stretching vibrations are observed in pure thiourea near 1417 cm-1. The same vibrations are observed in pure BTCB at 1388 cm-1 and in LABTCB, it was observed at 1392 cm-1. In the FTIR spectra, the NH stretching vibrational bands of NH2 asymmetric stretching were observed around 3280 cm-1, 3281 cm-1 and 3285 cm-1. The NH2 symmetric stretching vibrations are observed around 3167 cm-1, 3194 cm-1 and 3197 cm-1. These bands were shifted to higher wave number region when compared to that of the free ligand. This shift may be due to the increase in the polar character of thiourea molecule because of the formation of S→M bonds in pure and L-alanine mixed BTCB complex. The band observed around 1627 cm-1 corresponds to NH bending vibration of thiourea. The same vibration was observed in BTCB at 1616 cm-1 and in LABTCB, it was observed at 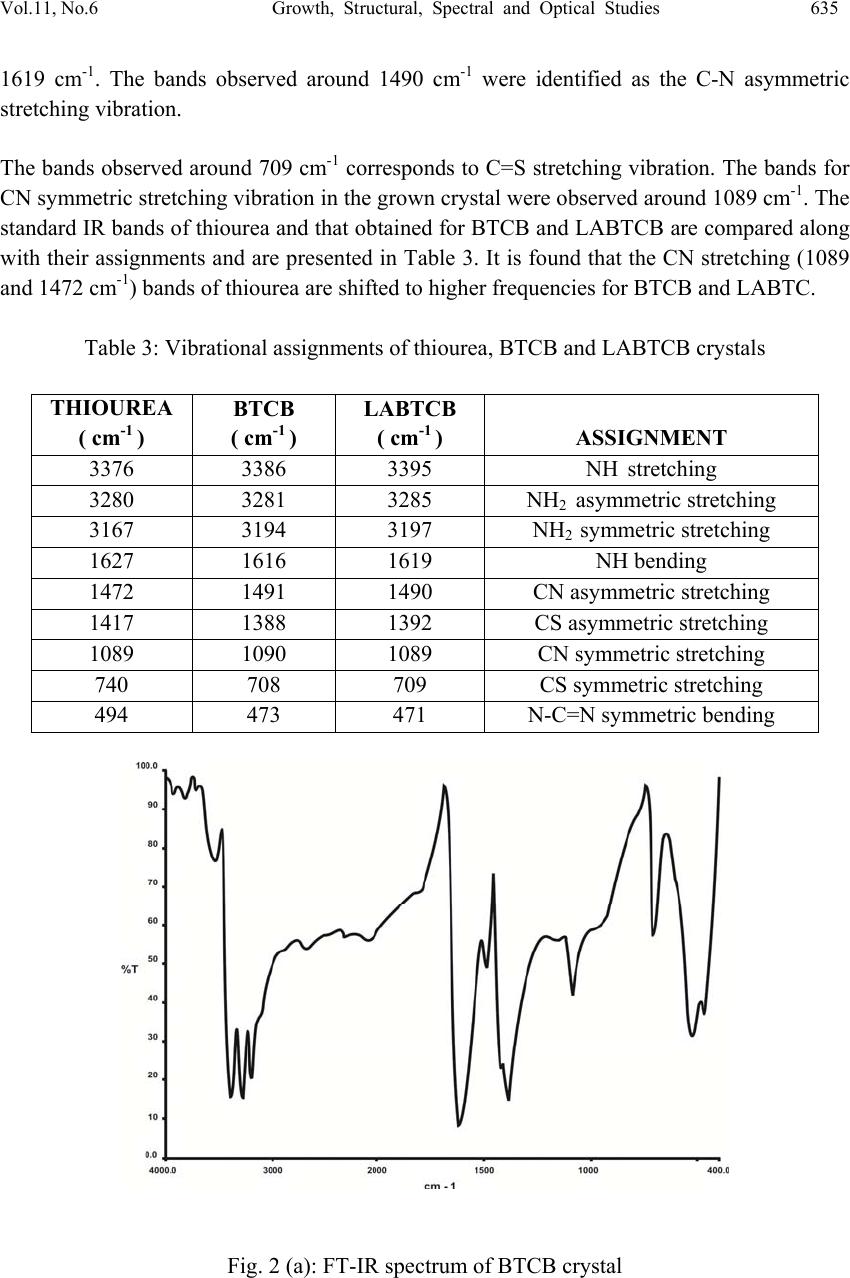 Vol.11, No.6 Growth, Structural, Spectral and Optical Studies 635 1619 cm-1. The bands observed around 1490 cm-1 were identified as the C-N asymmetric stretching vibration. The bands observed around 709 cm-1 corresponds to C=S stretching vibration. The bands for CN symmetric stretching vibration in the grown crystal were observed around 1089 cm-1. The standard IR bands of thiourea and that obtained for BTCB and LABTCB are compared along with their assignments and are presented in Table 3. It is found that the CN stretching (1089 and 1472 cm-1) bands of thiourea are shifted to higher frequencies for BTCB and LABTC. Table 3: Vibrational assignments of thiourea, BTCB and LABTCB crystals THIOUREA ( cm-1 ) BTCB ( cm-1 ) LABTCB ( cm-1 ) ASSIGNMENT 3376 3386 3395 NH stretching 3280 3281 3285 NH2 asymmetric stretching 3167 3194 3197 NH2 symmetric stretching 1627 1616 1619 NH bending 1472 1491 1490 CN asymmetric stretching 1417 1388 1392 CS asymmetric stretching 1089 1090 1089 CN symmetric stretching 740 708 709 CS symmetric stretching 494 473 471 N-C=N symmetric bending Fig. 2 (a): FT-IR spectrum of BTCB crystal 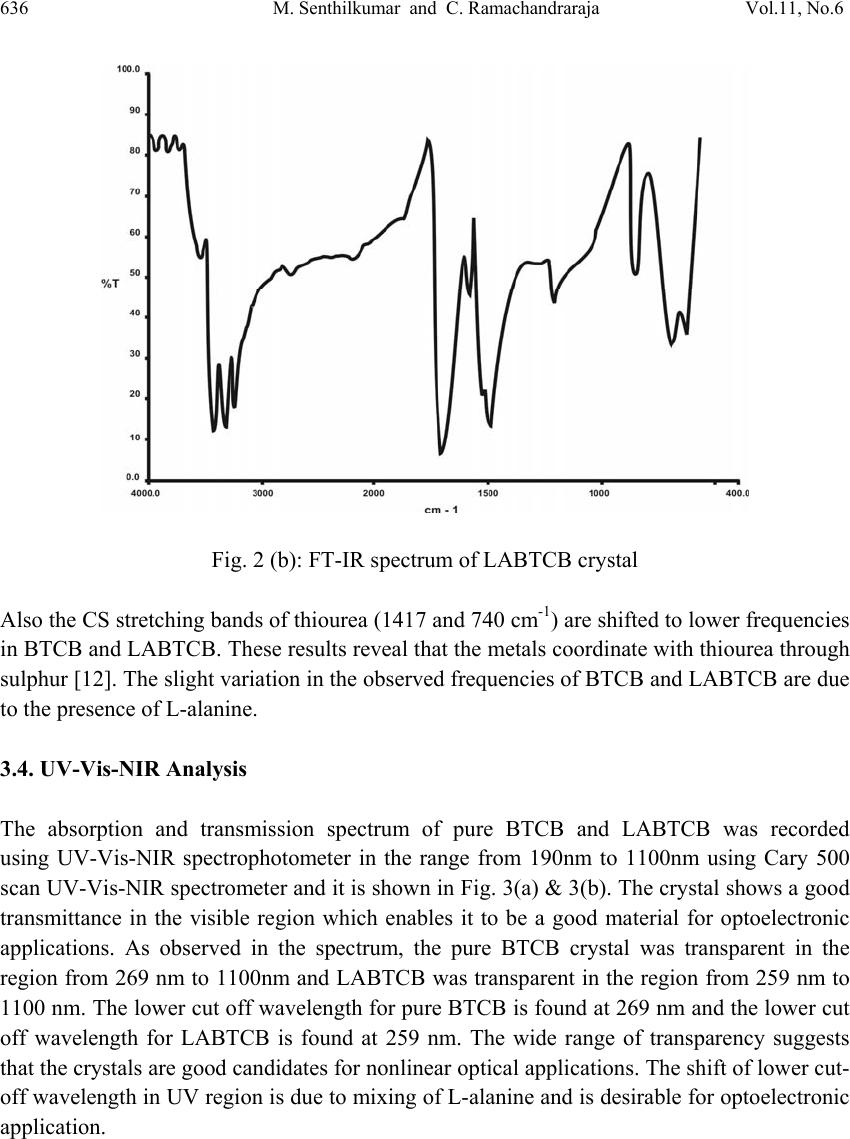 636 M. Senthilkumar and C. Ramachandraraja Vol.11, No.6 Fig. 2 (b): FT-IR spectrum of LABTCB crystal Also the CS stretching bands of thiourea (1417 and 740 cm-1) are shifted to lower frequencies in BTCB and LABTCB. These results reveal that the metals coordinate with thiourea through sulphur [12]. The slight variation in the observed frequencies of BTCB and LABTCB are due to the presence of L-alanine. 3.4. UV-Vis-NIR Analysis The absorption and transmission spectrum of pure BTCB and LABTCB was recorded using UV-Vis-NIR spectrophotometer in the range from 190nm to 1100nm using Cary 500 scan UV-Vis-NIR spectrometer and it is shown in Fig. 3(a) & 3(b). The crystal shows a good transmittance in the visible region which enables it to be a good material for optoelectronic applications. As observed in the spectrum, the pure BTCB crystal was transparent in the region from 269 nm to 1100nm and LABTCB was transparent in the region from 259 nm to 1100 nm. The lower cut off wavelength for pure BTCB is found at 269 nm and the lower cut off wavelength for LABTCB is found at 259 nm. The wide range of transparency suggests that the crystals are good candidates for nonlinear optical applications. The shift of lower cut- off wavelength in UV region is due to mixing of L-alanine and is desirable for optoelectronic application. 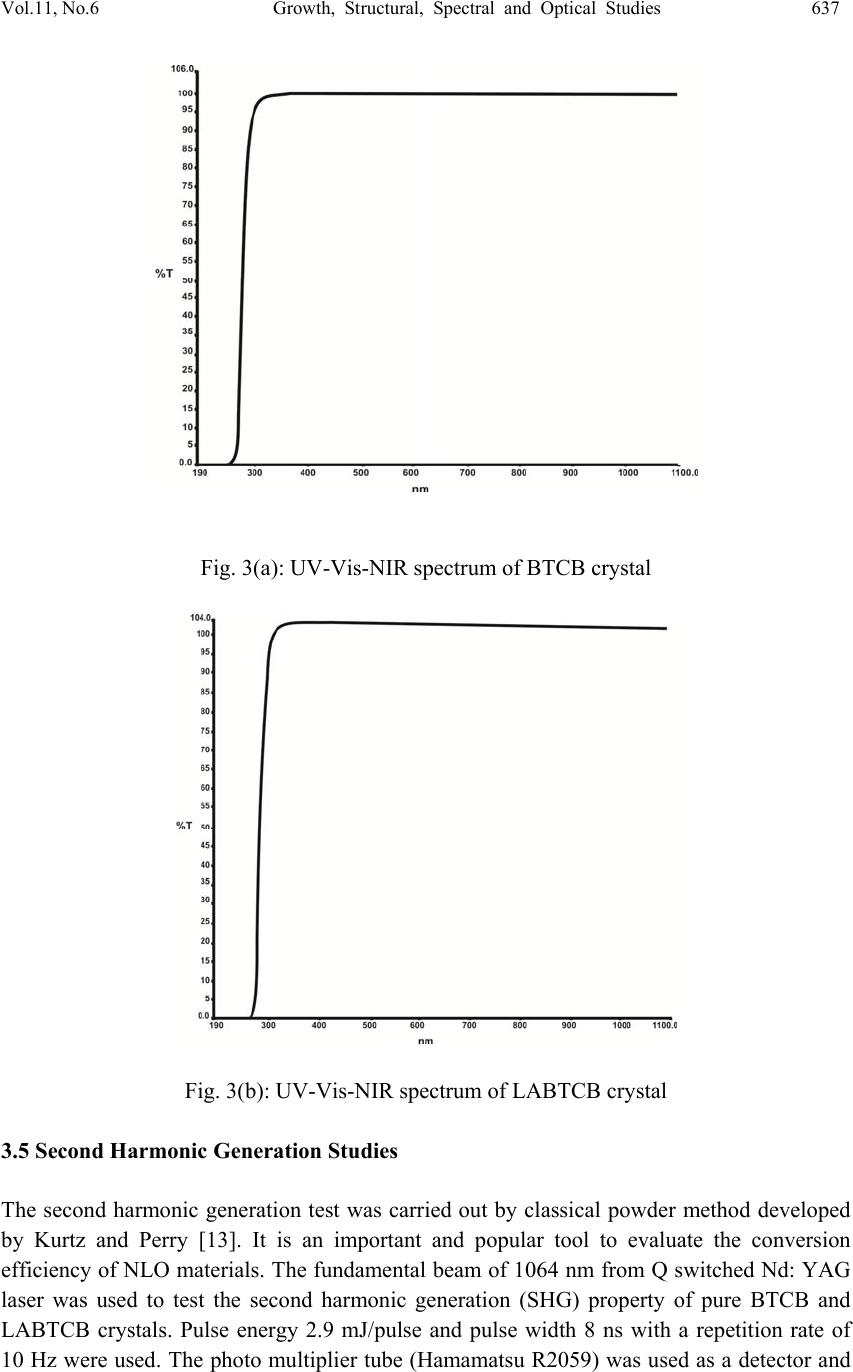 Vol.11, No.6 Growth, Structural, Spectral and Optical Studies 637 Fig. 3(a): UV-Vis-NIR spectrum of BTCB crystal Fig. 3(b): UV-Vis-NIR spectrum of LABTCB crystal 3.5 Second Harmonic Generation Studies The second harmonic generation test was carried out by classical powder method developed by Kurtz and Perry [13]. It is an important and popular tool to evaluate the conversion efficiency of NLO materials. The fundamental beam of 1064 nm from Q switched Nd: YAG laser was used to test the second harmonic generation (SHG) property of pure BTCB and LABTCB crystals. Pulse energy 2.9 mJ/pulse and pulse width 8 ns with a repetition rate of 10 Hz were used. The photo multiplier tube (Hamamatsu R2059) was used as a detector and 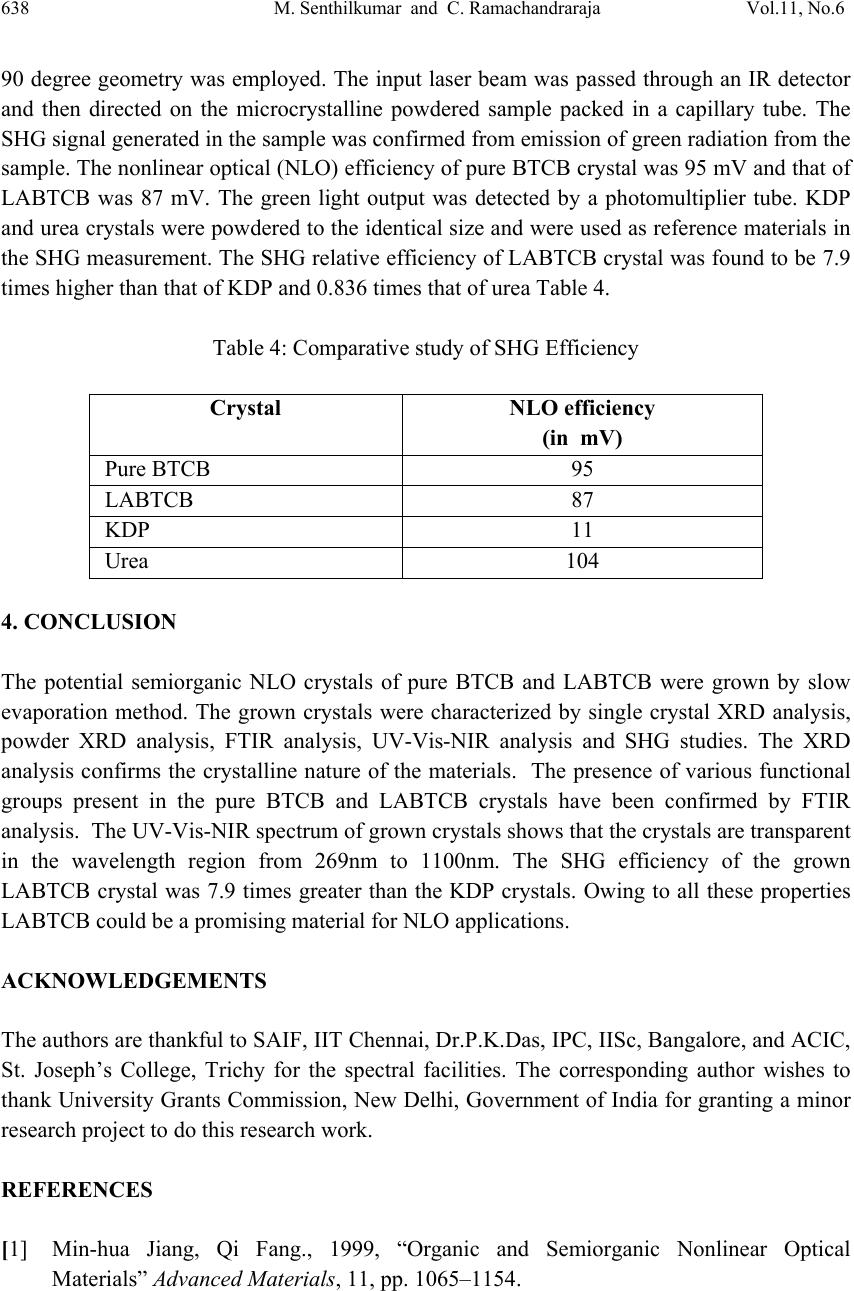 638 M. Senthilkumar and C. Ramachandraraja Vol.11, No.6 90 degree geometry was employed. The input laser beam was passed through an IR detector and then directed on the microcrystalline powdered sample packed in a capillary tube. The SHG signal generated in the sample was confirmed from emission of green radiation from the sample. The nonlinear optical (NLO) efficiency of pure BTCB crystal was 95 mV and that of LABTCB was 87 mV. The green light output was detected by a photomultiplier tube. KDP and urea crystals were powdered to the identical size and were used as reference materials in the SHG measurement. The SHG relative efficiency of LABTCB crystal was found to be 7.9 times higher than that of KDP and 0.836 times that of urea Table 4. Table 4: Comparative study of SHG Efficiency Crystal NLO efficiency (in mV) Pure BTCB 95 LABTCB 87 KDP 11 Urea 104 4. CONCLUSION The potential semiorganic NLO crystals of pure BTCB and LABTCB were grown by slow evaporation method. The grown crystals were characterized by single crystal XRD analysis, powder XRD analysis, FTIR analysis, UV-Vis-NIR analysis and SHG studies. The XRD analysis confirms the crystalline nature of the materials. The presence of various functional groups present in the pure BTCB and LABTCB crystals have been confirmed by FTIR analysis. The UV-Vis-NIR spectrum of grown crystals shows that the crystals are transparent in the wavelength region from 269nm to 1100nm. The SHG efficiency of the grown LABTCB crystal was 7.9 times greater than the KDP crystals. Owing to all these properties LABTCB could be a promising material for NLO applications. ACKNOWLEDGEMENTS The authors are thankful to SAIF, IIT Chennai, Dr.P.K.Das, IPC, IISc, Bangalore, and ACIC, St. Joseph’s College, Trichy for the spectral facilities. The corresponding author wishes to thank University Grants Commission, New Delhi, Government of India for granting a minor research project to do this research work. REFERENCES [1] Min-hua Jiang, Qi Fang., 1999, “Organic and Semiorganic Nonlinear Optical Materials” Advanced Materials, 11, pp. 1065–1154.  Vol.11, No.6 Growth, Structural, Spectral and Optical Studies 639 [2] Ramajothi, J., Dhanuskodi, S., Nagarajan. K., 2004, “Crystal growth, thermal, optical and microhardness studies of tris (thiourea) zinc sulphate - a semiorganic NLO material” Crystal Research and Technology. 39, pp. 414–420. [3] Ariponnammal, S., Radhika, S., Selva, R., Victor Jeya, N., 2005 “High pressure electrical resistivity study on nonlinear single crystal Zinc thiourea sulphate (ZTS).” Crystal Research and Technology. 40, pp. 786–788. [4] Rosker, M.J., et al., 1996, “Salt-based approach for frequency conversion materials” Pure Appl. Opt. 5, pp. 667-680. [5] Selvaraju, K., Valluvan, R., Kirubavathi, K., Kumararaman, S.,2007,“L-Cystine hydrochloride: A novel semi-organic nonlinear optical material for optical devices” Optics Communications, 269, pp. 230-234. [6] Chenthamarai, S., Jayaraman, D., Subramanian, C., Ramasamy., P.2001, “Mechanical and optical studies on pure and nitro doped4-hydroxyacetophenone ”. Materials Letters, 47, pp. 247-251. [7] Ambujam, K., et al., 2006,“Growth and characterization of a novel NLO crystal bis- glycine hydrogen chloride (BGHC)” J. Cryst. Growth, 286, pp. 440-444. [8] S. S. Hussaini., et al., 2007, “ Growth and high frequency dielectric study of pure and thiourea doped KDP crystals” Crystal Research and Technology, 42, pp. 1110–1116. [9] S.S.Hussaini, et al., 2008, “Effect of glycine on the optical properties of Zinc Thiourea Chloride (ZTC) single crystal” Opto electronics and Advanced Materials-Rapid communication, 2, pp.108-112. [10] Kannan, V. Rajesh, N. P., Bairava Ganesh, R., Ramasamy, P., 2004,“Growth and characterization of Bisthiourea-zinc Acetate, a new nonlinear optical material" Journal of Crystal Growth, 269, pp.565-569. [11] Meera, K., et al., 2004, “Growth of nonlinear optical material: L-arginine hydrochloride and its characterization.” Crystal Research and Technology, 263, pp. 510-516. [12] Selvasekarapandian, S., Vivekanandan, K., Kolandaivel, P., Gundurao. T.K., 1997, “Vibrational Studies of Bis(thiourea) Cadmium Chloride and Tris(thiourea) Zinc Sulphate Semiorganic Non-linear Optical Crystals” Crystal Research and Technology.2, pp. 299–309 [13] Kurtz, S. K. Perry, T. T.,1968,“A Powder Technique for the Evaluation of Nonlinear Optical Materials” J. Appl. phys. 39, pp. 3798-4013. |