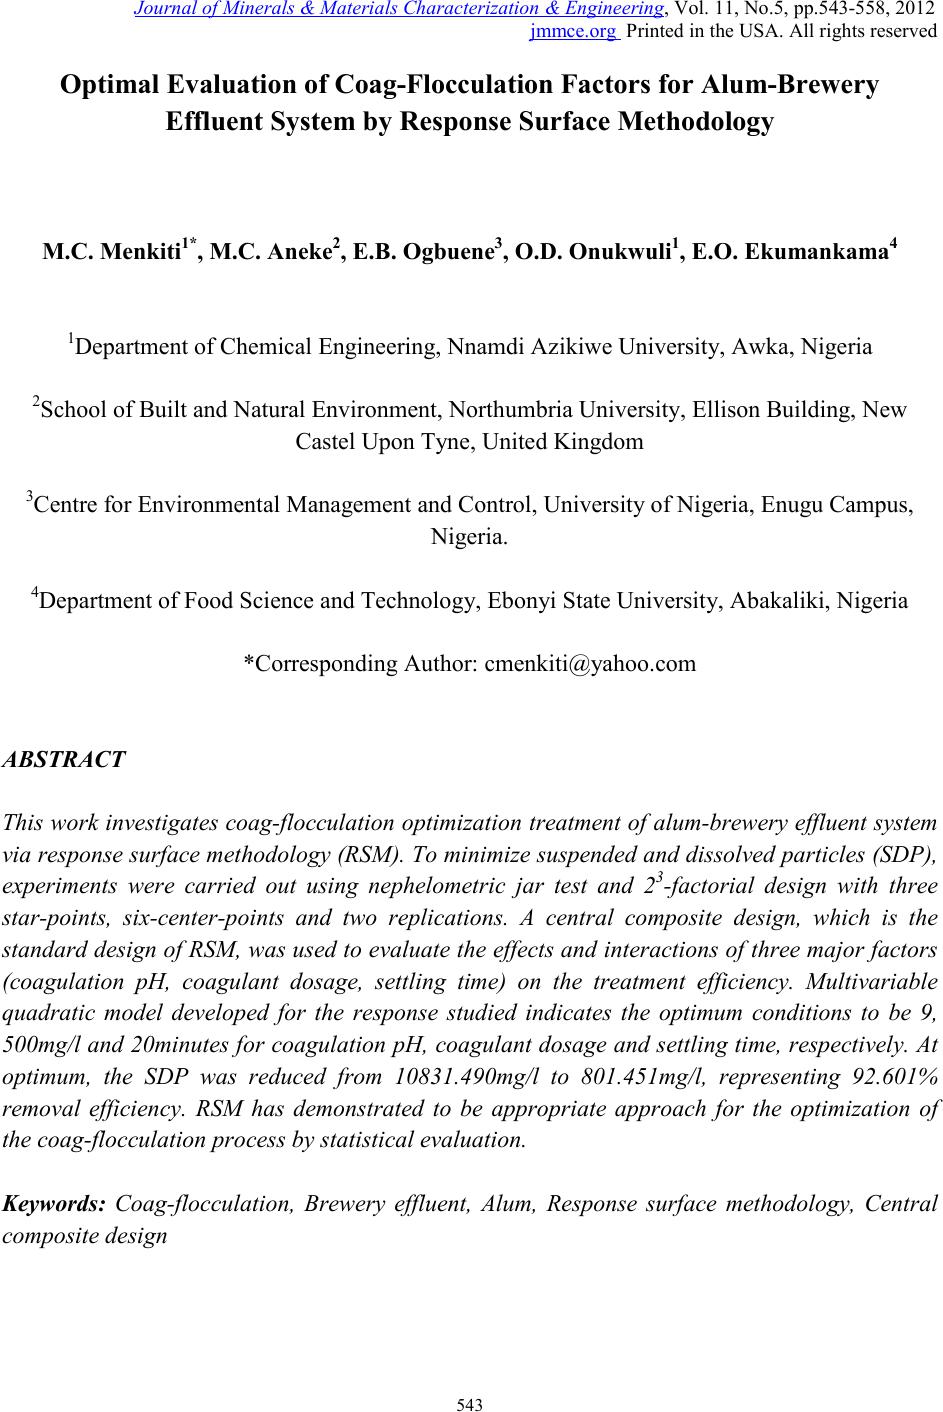
 Journal of Minerals & Materials Characterization & Engineering, Vol. 11, No.5, pp.543-558, 2012 jmmce.org Printed in the USA. All rights reserved 543 Optimal Evaluation of Coag-Flocculation Factors for Alum-Brewery Effluent Syst em by Response Surface Methodology M.C. Menkiti1*, M.C. Aneke2, E.B. Ogbuene3, O.D. Onukwuli1, E.O. Ekumankama4 1Department of Chemical Engineering, Nnamdi Azikiwe University, Awka, Nigeria 2School of Built and Natural Environment, Northumbria University, Ellison Building, New Castel Upon Tyne, United Kingdom 3Centre for Environmental Management and Control, University of Nigeria, Enugu Campus, Nigeria. 4Department of Food Science and Technology, Ebonyi State University, Abakaliki, Nigeria *Corresponding Author: cmenkiti@yahoo.com ABSTRACT This work investigates coag-flocculation optimization treatment of alum-brew ery effluent s ystem via response surface methodology (RSM). To minimize suspended and dissolved particles (SDP), experiments were carried out using nephelometric jar test and 23-factorial design with three star-points, six-center-points and two replications. A central composite design, which is the standard design of RSM, was used to evaluate the effects and interactions of three major factors (coagulation pH, coagulant dosage, settling time) on the treatment efficiency. Multivariable quadratic model developed for the response studied indicates the optimum conditions to be 9, 500mg/l and 20minutes for coagulation pH, coagulant dosage and settling time, respectively. At optimum, the SDP was reduced from 10831.490mg/l to 801.451mg/l, representing 92.601% removal efficiency. RSM has demonstrated to be appropriate approach for the optimization of the coag-flocculation process by statistical evaluation. Keywords: Coag-flocculation, Brewery effluent, Alum, Response surface methodology, Central composite design  544 M.C.Menkiti, M.C.Aneke, E.B. Ogbuene Vol.11, No.5 1. INTRODUCTION Brewer y effluent (BRE), a major waste product from lager production, is a notorious pollutant deleterious to the aquifers of brewery bearing communities in Nigeria. The characteristics of the BRE is a major determinant for the most suitable technique and remedial implementation options available for the treatment of the effluent [1,2,3]. Depending on the process route, the quality and characteristics of BRE fluctuate significantly. The organic components of BRE consist of sugars, soluble starch, ethanol, volatile fatty acids and solids which are mainly spent grains, yeast and trub [4,5]. Typically, untreated BRE contains suspended solids (100-1500mg/l), chemical oxygen demand (300-800mg/l), nitrogen (30-100mg/l) and phosphorus (10-30) [6]. Physiochemical treatment processes are effective in the purification of young and freshly produced BRE. Coag-flocculation is a widely applied and relatively simple physiochemical technique commonly used for water and wastewater treatment. The removal mechanisms of this process mainly consists of charge neutralization of negatively charged colloids by cationic hydrolysis product, followed by incorporation of impurities in an amorphous hydroxide precipitate through flocculation. The aggregated particles form visible flocs that settle out under gravity [7-12]. Inorganic salts such as ferrous sulfate, ferric chloride, ferric chloro-sulfate and aluminium sulfate (alum) are generally used in coag-flocculation. Among these inorganic coagulants, alum is most widely used in our locality, having proven to be very efficient in operation. It has been reported based on conventional experiments that alum optimally remove 80-90% of suspended and dissolved particles (SDP) from BRE [3,13]. Though these limited documented results are encouraging, there are associated disadvantages in the conventional method (one factor at a time, OFAT) usually applied in the search for the operational optimal variables. The major disadvantage is the individual optimization of variables through the single-dimensional search which are time consuming and incapable of reaching the true optimum as interaction among variables is not taken into consideration [7,14,15]. As a solution, the statistical method of response surface methodology (RSM) has been proposed to include the influence of individual factors as well as their interactive influences. RSM, which is a technique for designing experiment helps researchers to build models, evaluate the effects of several factors and achieve the optimum conditions for desirable responses in addition to reducing the number of experiments [7,16,]. Analysis of variance (ANOVA) provides the statistical results and diagnostic checking test which provide the means to evaluate the adequacy of the models. In this present study, central composite design (CCD) and RSM was used to design the experiments, build models and determine the optimum conditions. It monitored how SDP  Vol.11, No.5 Optimal evaluatio n of coag-flocculation factors 545 removal (as response) were affected by changes in the levels of alum dose, coagulation pH and settling time (as factors). Quantitative measurement of efficiency and speed of the coag- flocculation were also determined. 2. MATERIALS AND METHODS 2.1 Effluent Sampling and Characterization Effluent sample was taken from brewery site in Enugu, Nigeria. Sample collection, preservation and characterization were done in accordance with the standard method for the examination of water [17]. Characterization was carried out immediately after sample arrived in the laboratory. Table 1 shows the characteristics of BRE sampled. Table 1: Characteristics of Brewery Effluent Paramet er s Values BOD3 1021.011 2.2 Coag-Flocculation In this present work, alum (a metal salt) was used as a coagulant. The alum used in this study was in powder form with chemical formula, Al2(SO4)3.18H2O (M=666.42g/mol, 51-59% Al2(SO4)3,, pH 2.5-4). Coagulant sample was sourced from the staple of Merck, Germany. In order to carry out the study, jar tests were used to perform the coagulation-flocculati on (coa g- flocculation) process. The experiments were carried out using 2L square jars, with six paddle stirrers, manufactured by Phipps and Birds, VA USA. The coag-flocculation pH was adjusted using 0.1M H2SO4 or 0.1MNaOH just before dosing of the coagulant. The time and speed for rapid and slow mixing were set with an automatic controller as follow: Rapid mixing at 250rpm(G=550 sec-1) for 1 minutes after alum addition, followed by slow mixing at 30  546 M.C.Menkiti, M.C.Aneke, E.B. Ogbuene Vol.11, No.5 rpm(G=22 sec-1 ) for 30 minutes, and then settling for 3- 30 minutes range. During settling, samples were withdrawn using pipette from 2cm depth and analyzed for optimization with SDP(mg/l) removal as a response. 2.3 Experimental Design and Data Analysis In this study, CCD and RSM were applied to optimize three important operating variables: pH, coagulant dosage and settling time. Experiments were initiated as a preliminary study for determining a narrower range of pH, coagulant dosage and settling time prior to designing the experimental runs. Accordingly, pH from 1-12 were tried and the increment continued until appreciable reductions were observed in the process response(SDP). Likewise, a wide dosage and time range of 100-1000mg/l and 5-50 minutes, respectively were examined to search for a narrower and more effe ctive range. The prelimin ary search ran ge of settling time was pegged at 5-50minutes. As a result, the study ranges and levels displayed in table 2 were chosen. Table 3 shows the CCD in the form of a 32 full factorial design with three star points, six center points and two replications to generate 34 runs and responses. The cente r-points replicates verify changes in the midd le of the plan and measures o f the degree of precision property, while star-points verify the non-linear suspected curvature. In order to obtain the optimum pH, dosage and settling time, SDP reduction response was studied and interpreted by MATLAB 7.0. The behavior of the system is explained by the generic multivariable polynomial equation 1 below [18]: ∑∑ ∑∑=<= ++++= m jjjj ji jiijj m jjXbXXbXbbY 1 2 1 0 (1) With respect to this current particular study, equation 1 transforms to generic equation 2 for the 23-CCD of the system under consideration. Y=b0+b1X1+b2X2+b3X3+b12X1X2+b13X1X3+b23X2X3+b11X21+b22X22+b33X23 (2) Where Y is the predicted response, b0, bj and bjj are constants coefficients; Xi and Xj are the coded independent factors; ε is the random error. X1, X 2, and X 3 are coagulation pH, coagulant dosage and settling time, respectively. The polynomial coefficients are determined by the following relationships expressed below(equations 3-6): ∑ ∑∑ = == += M j N iuju N u XPYuab 1 2 1 0 (3) (4) 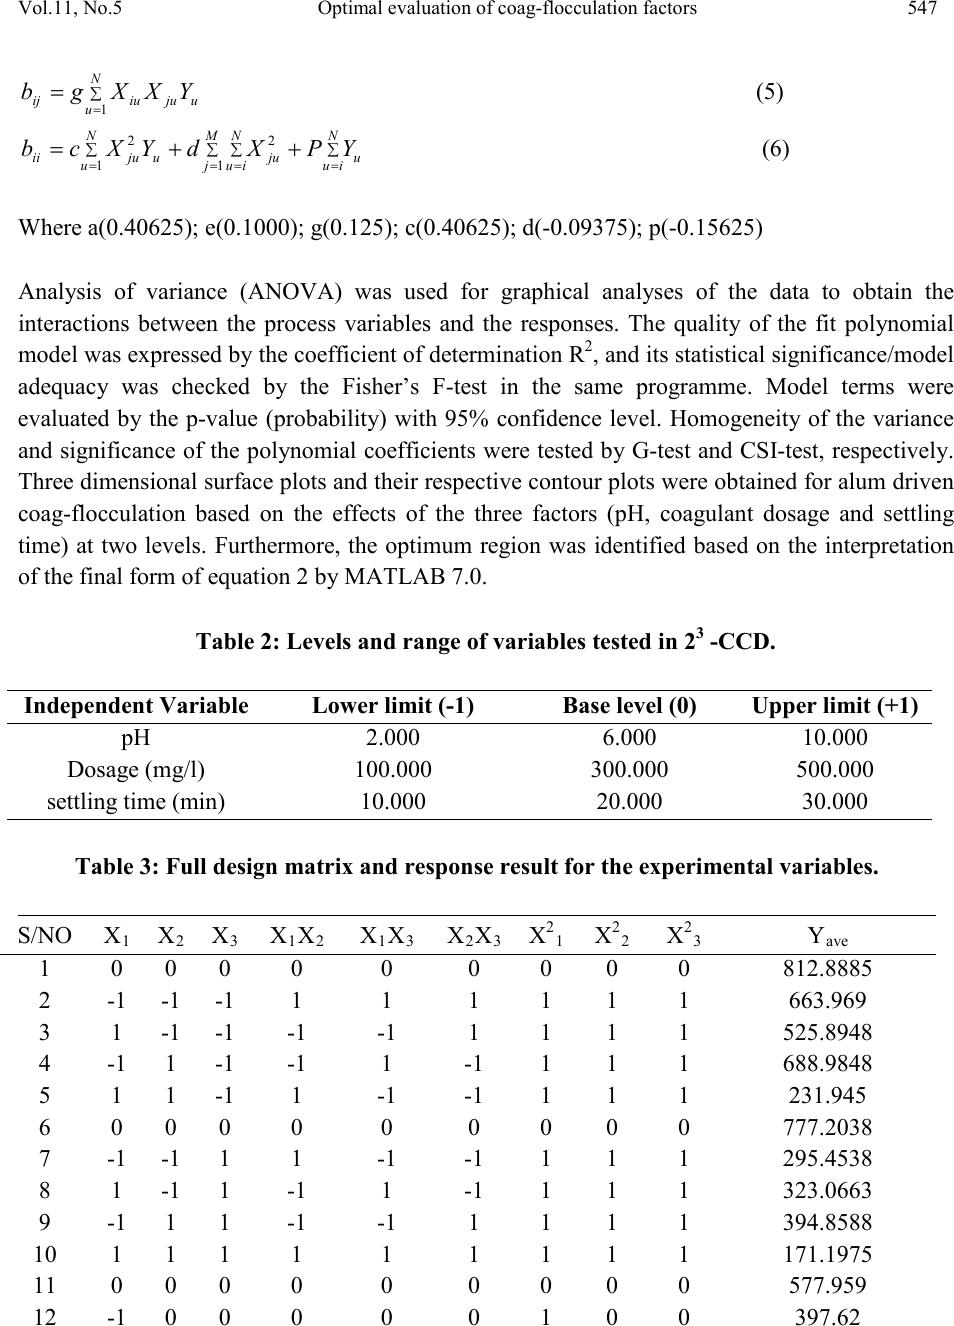 Vol.11, No.5 Optimal evaluatio n of coag-flocculation factors 547 (5) ∑ ∑∑∑= === ++= M j N iu N iuuju N uujuii YPXdYXcb 1 2 1 2 (6) Where a(0.40625); e(0.1000); g(0.125); c(0.40625); d(-0.09375); p(-0.15625) Analysis of variance (ANOVA) was used for graphical analyses of the data to obtain the interactions between the process variables and the responses. The quality of the fit polynomial model w as express ed by the coefficien t o f det erminat io n R2, and its statistical significance/model adequacy was checked by the Fisher’s F-test in the same programme. Model terms were evaluated by the p-value (probability) with 95% confidence level. Homogeneity of the variance and significance of the polynomial coefficients were tested by G-test and CSI-test, respectively. Three dimensional surface plots and their respective contour plots were obtained for alum driven coag-flocculation based on the effects of the three factors (pH, coagulant dosage and settling time) at two levels. Furthermore, the optimum region was identified based on the interpretation of the final form of equation 2 by MATLAB 7.0. Table 2: Levels and range of variables tested in 23 -CCD. Table 3: Full design matrix and response result for the experimental variables. S/NO X1 X2 X3 X1X2 X1X3 X2X3 X 1 X 2 X 3 Yave 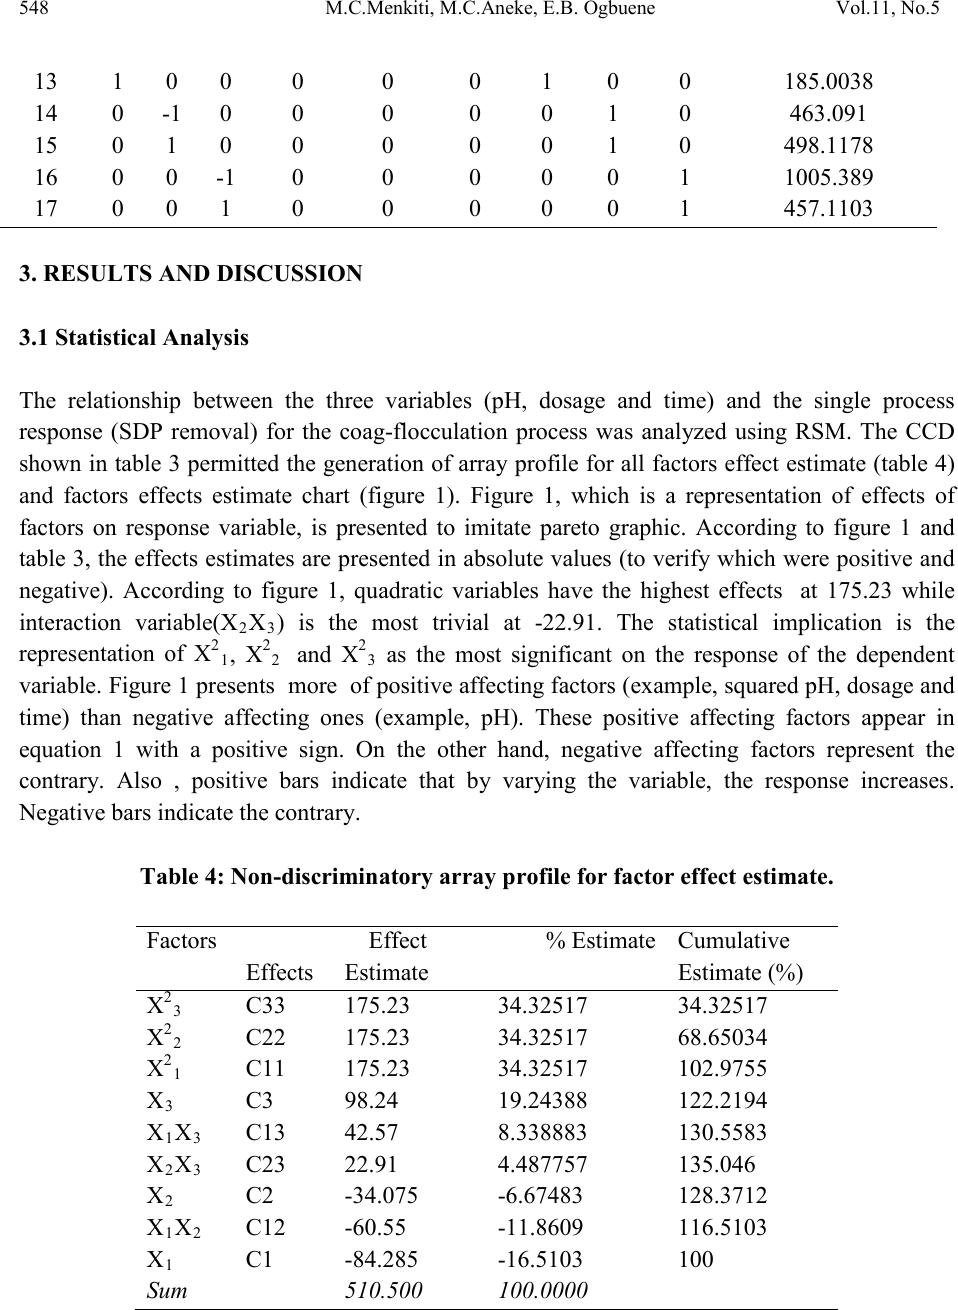 548 M.C.Menkiti, M.C.Aneke, E.B. Ogbuene Vol.11, No.5 3. RESULTS AND DISCUSSION 3.1 Statistical Analysis The relationship between the three variables (pH, dosage and time) and the single process response (SDP removal) for the coag-flocculation process was analyzed using RSM. The CCD shown in table 3 permitted the generation of array profile for all factors effect estimate (table 4) and factors effects estimate chart (figure 1). Figure 1, which is a representation of effects of factors on response variable, is presented to imitate pareto graphic. According to figure 1 and table 3, the effects estimates are presented in absolute values (to verify which were positive and negative). According to figure 1, quadratic variables have the highest effects at 175.23 while interaction variable(X2X3) is the most trivial at -22.91. The statistical implication is the repres entation of X21, X22 and X23 as the most significant on the response of the dependent variable. Figure 1 presents more of positive affecting factors (example, squared pH, dosage and time) than negative affecting ones (example, pH). These positive affecting factors appear in equation 1 with a positive sign. On the other hand, negative affecting factors represent the contrary. Also , positive bars indicate that by varying the variable, the response increases. Negative bars indicate the contrary. Table 4: Non-discriminatory array profile for factor effect estimate. Effects Estimate Estimate (%) 3 2 1 3 1 3 2 1 2 1 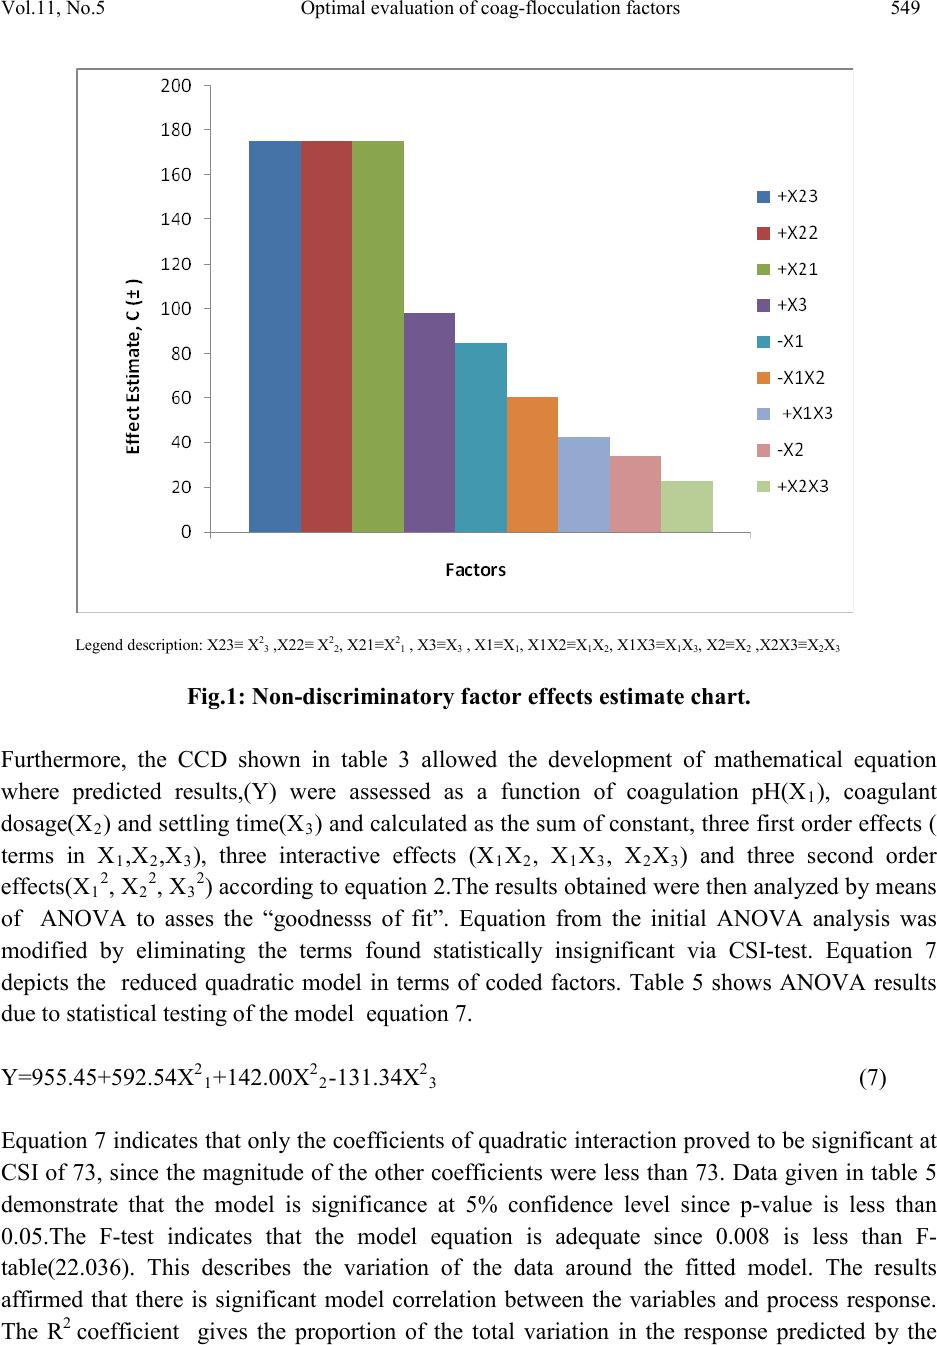 Vol.11, No.5 Optimal evaluatio n of coag-flocculation factors 549 Legend description: X23≡ X23 ,X22≡ X22, X21≡X21 , X3≡X3 , X1≡X1, X1X2≡X1X2, X1X3≡X1X3, X2≡X2 ,X2X3≡X2X3 Fig.1: Non-discriminatory factor effects estimate chart. Furthermore, the CCD shown in table 3 allowed the development of mathematical equation where predicted results,(Y) were assessed as a function of coagulation pH(X1), coagulant dosage(X2) and settling time(X3) and cal culat ed as the su m of con stant , thr ee firs t ord er eff ects ( terms in X1,X2,X3), three interactive effects (X1X2, X1X3, X2X3) and three second order effects(X12, X22, X32) according to equation 2.The results obtained were then analyzed b y means of ANOVA to asses the “goodnesss of fit”. Equation from the initial ANOVA analysis was modified by eliminating the terms found statistically insignificant via CSI-test. Equation 7 depicts the reduced quadratic model in terms of coded factors. Table 5 shows ANOVA results due to statistical testing of the model equation 7. Y=955.45+592.54X21+142.00X22-131.34X23 (7) Equation 7 indicates that only the coefficients of quadratic interaction proved to be significant at CSI of 73, since the magnitude of the other coefficients were less than 73. Data given in table 5 demonstrate that the model is significance at 5% confidence level since p-value is less than 0.05.The F-test indicates that the model equation is adequate since 0.008 is less than F- table(22.036). This describes the variation of the data around the fitted model. The results affirmed that there is significant model correlation between the variables and process response. The R2 coefficient gives the proportion of the total variation in the response predicted by the 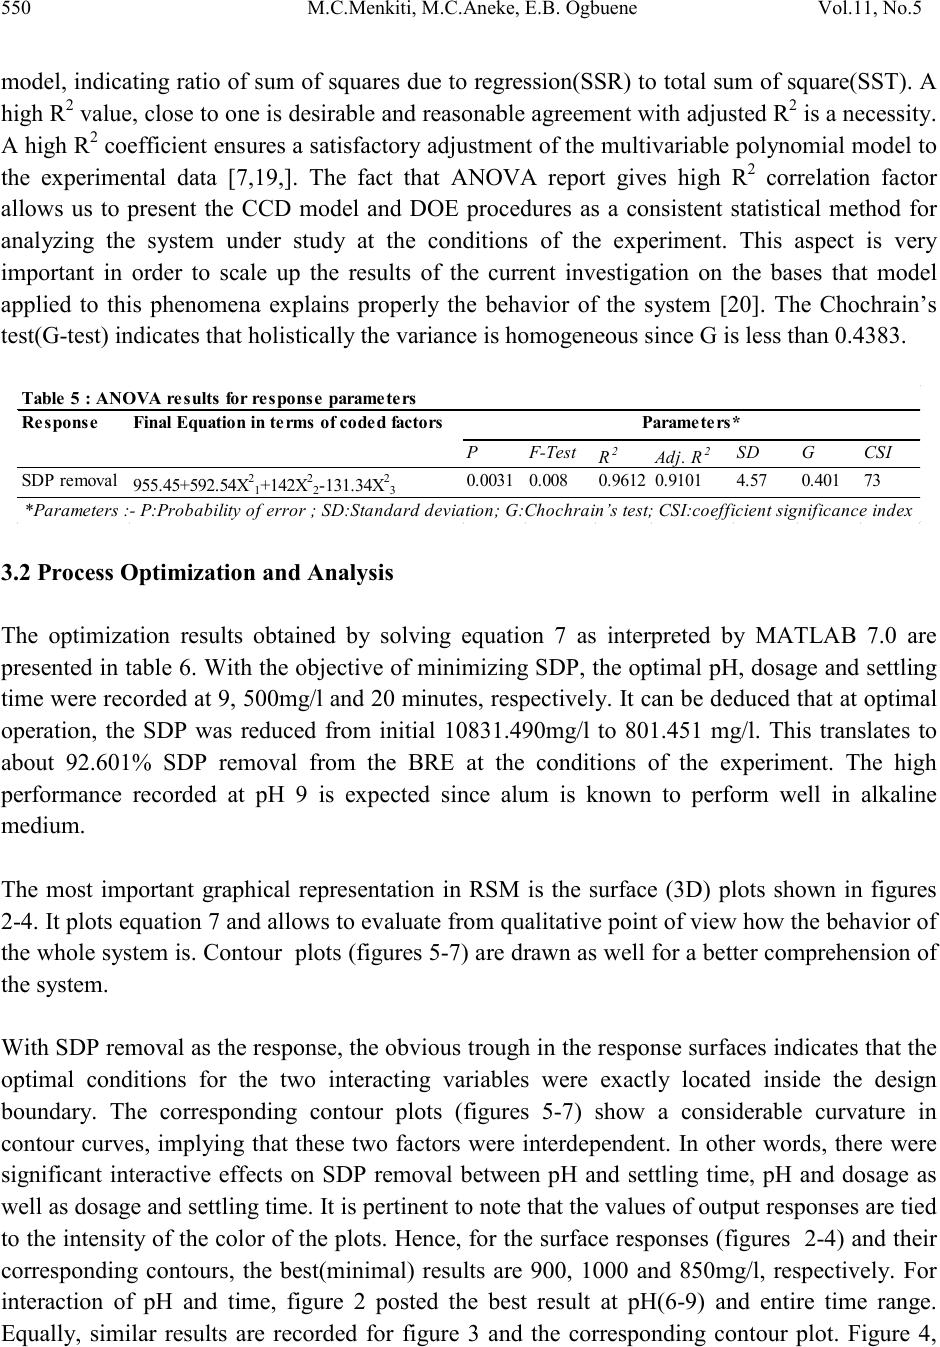 550 M.C.Menkiti, M.C.Aneke, E.B. Ogbuene Vol.11, No.5 model, indicating ratio of sum of squares due to regression(SSR) to total sum of square(SST). A high R2 value, close to one is desirable and reasonable agre ement with adjusted R2 is a ne ces si ty. A hi gh R 2 coefficient ens ures a satisfactory adjustment of the multivariable polynomial model to the experimental data [7,19,]. The fact that ANOVA report gives high R2 correlation factor allows us to present the CCD model and DOE procedures as a consistent statistical method for analyzing the system under study at the conditions of the experiment. This aspect is very important in order to scale up the results of the current investigation on the bases that model applied to this phenomena explains properly the behavior of the system [20]. The Chochrain’s test(G-test) indicates that holistically the variance is homogeneous since G is less than 0.4383. Response F inal Equat i on in terms of coded fact ors 2 2 SDP remova l955.45+592.54X 2 2 2 30.00310.0080.9612 0.91014.570.40173 Table 5 : ANOVA results for response parameters *Parameters :- P:Probability of error ; SD:Standard deviation; G:Chochrain’s test; CSI:coeff icient signif icance index 3.2 Process Optimization and Analysis The optimization results obtained by solving equation 7 as interpreted by MATLAB 7.0 are presented in table 6. W ith the objective of minimiz ing SDP, the optimal pH, dosage and settling time were recorded at 9, 500mg/l and 20 minutes, respectively. It can be deduced that at optimal operation, the SDP was reduced from initial 10831.490mg/l to 801.451 mg/l. This translates to about 92.601% SDP removal from the BRE at the conditions of the experiment. The high performance recorded at pH 9 is expected since alum is known to perform well in alkaline medium. The most important graphical representation in RSM is the surface (3D) plots shown in figures 2-4. It plots equation 7 and allows to evaluate from qualitative point of vie w how the beh avior of the whole system is. Contour plots (figures 5-7) are drawn as well for a better comprehension of the system. With SDP removal as the response, the obvious trough in the response surfaces indicates that the optimal conditions for the two interacting variables were exactly located inside the design boundary. The corresponding contour plots (figures 5-7) show a considerable curvature in contour curves, implying that these two factors were interdependent. In other words, there were significant interactive effects on SDP removal between pH and settling time, pH and dosage as well as dosage and settling time. It is pertinent to note that the values of output responses are tied to the intensity of the color of the plots. Hence, for the surface responses (figures 2-4) and their corresponding contours, the best(minimal) results are 900, 1000 and 850mg/l, respectively. For interaction of pH and time, figure 2 posted the best result at pH(6-9) and entire time range. Equally, similar results are recorded for figure 3 and the corresponding contour plot. Figure 4,  Vol.11, No.5 Optimal evaluatio n of coag-flocculation factors 551 indicating the interaction between dosage and settling time, shows that at the conditions of the experiment, the minimal SDP removal is achieved at pH( 6-10) and settling time(10-20). Another area of good performance is recorded at pH(6-10) and time(30min). These areas of l ocal minima are in agreement with the optimization results. Like earlier observed, the saddle contours (figures 5 and 7) and symmetrical sunken contour (figure7) show that the pairs of the interacting variables have substantial influence on the minimization of the SDP, in additi on to obtaining the minimization at optimal region. In general, the 3-D plots provide routine avenue to observe the surface areas of the plot within which the process performs at optimal level based on the effects of the interactions of the variables under consideration. The significan ce o f th ese i nt era cti on effe ct s bet ween th e va ri abl es would have been lost if the experiments were carried out by traditional (OFAT) method of study. Table 6: Process optimization results for SDP removal. Sample X1(pH) X2(Dosage) X3(Settling time) removal)(mg/l) *Coded Value **Real value Fig. 2: Surface graph of SDP removal showing interaction of pH and Settling time 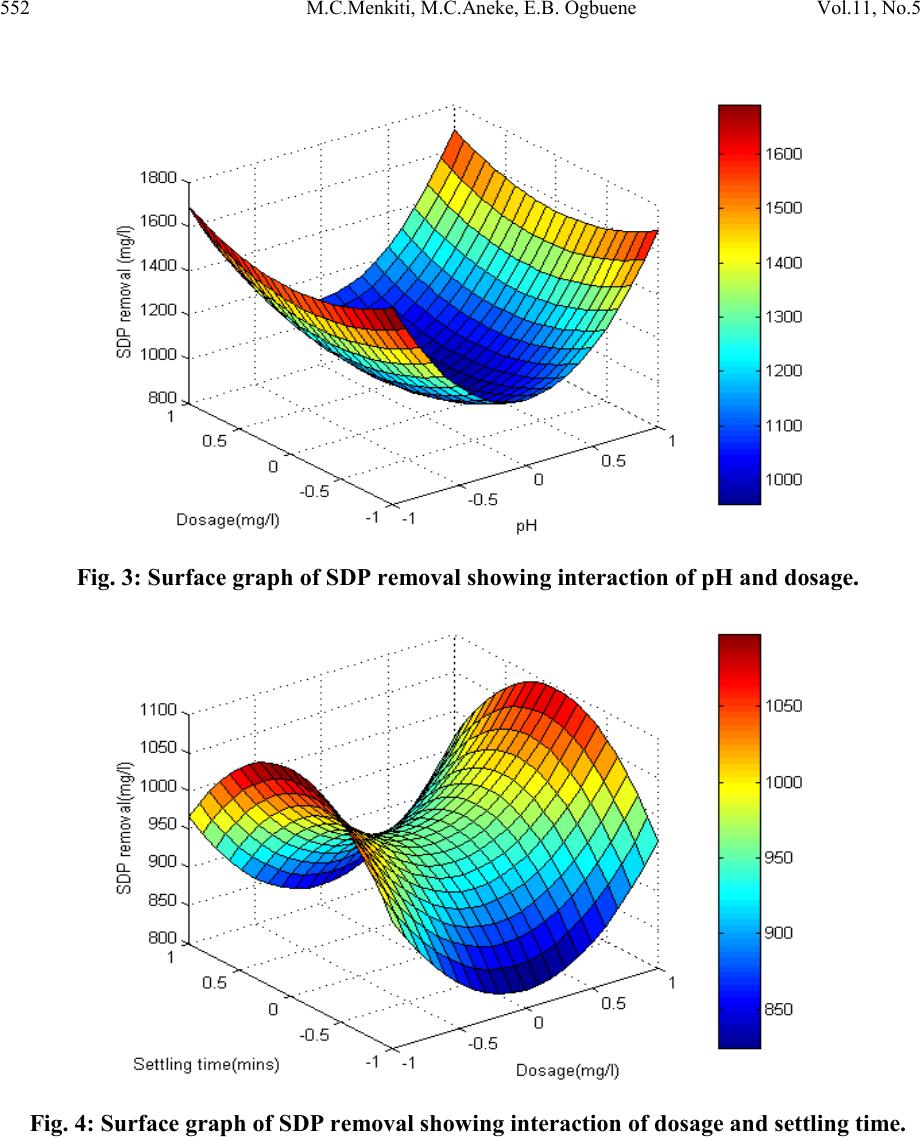 552 M.C.Menkiti, M.C.Aneke, E.B. Ogbuene Vol.11, No.5 Fig. 3: Surface graph of SDP removal showing interaction of pH and dosage. Fig. 4: Surface graph of SDP removal showing interaction of dosage and settling time. 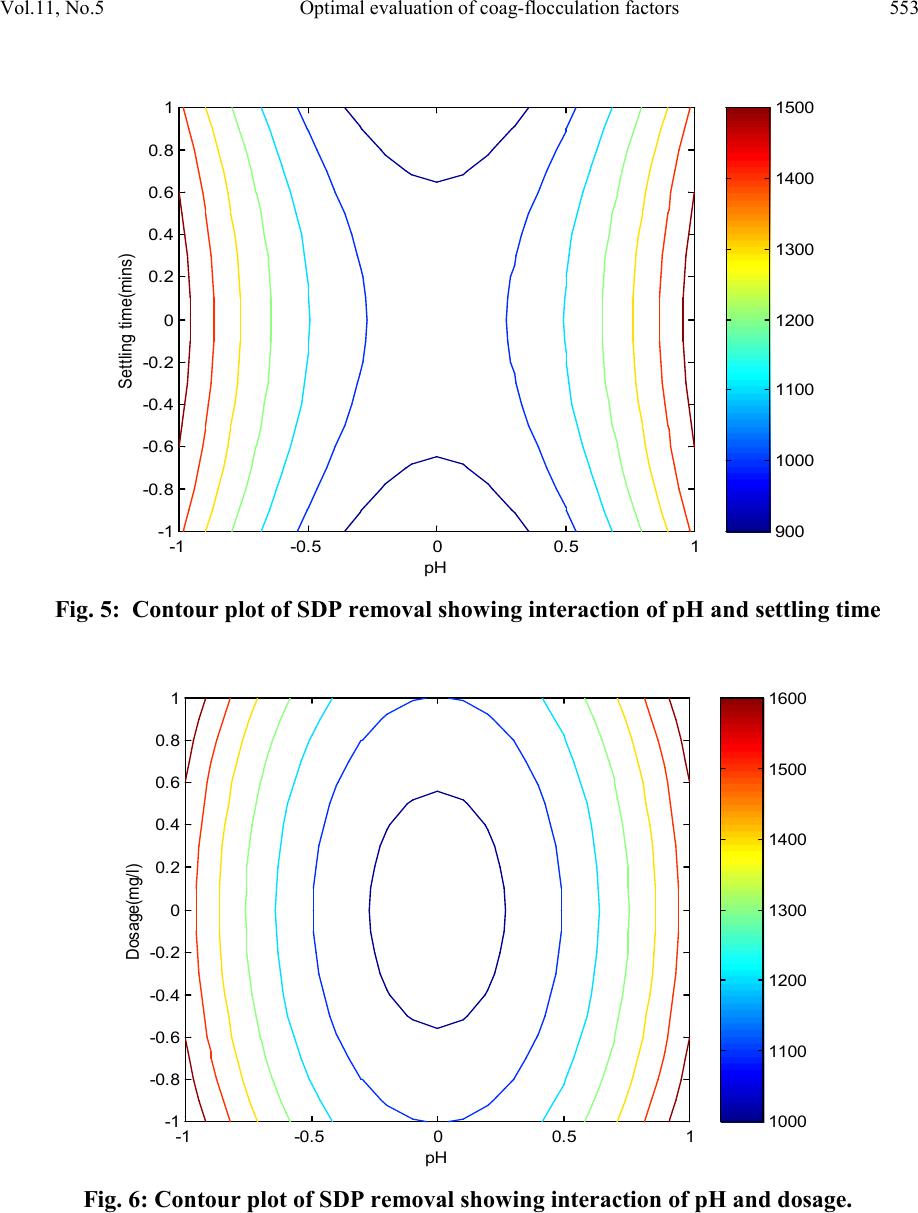 Vol.11, No.5 Optimal evaluatio n of coag-flocculation factors 553 900 1000 1100 1200 1300 1400 1500 -1 -0.500.5 1 -1 -0.8 -0.6 -0.4 -0.2 0 0.2 0.4 0.6 0.8 1 pH S ett li ng tim e(m i ns) Fig. 5: Contour plot of SDP removal showing interaction of pH and settling time 1000 1100 1200 1300 1400 1500 1600 -1 -0.5 00.5 1 -1 -0.8 -0.6 -0.4 -0.2 0 0.2 0.4 0.6 0.8 1 pH Dosage(mg/l) Fig. 6: Contour plot of SDP removal showing interaction of pH and dosage. 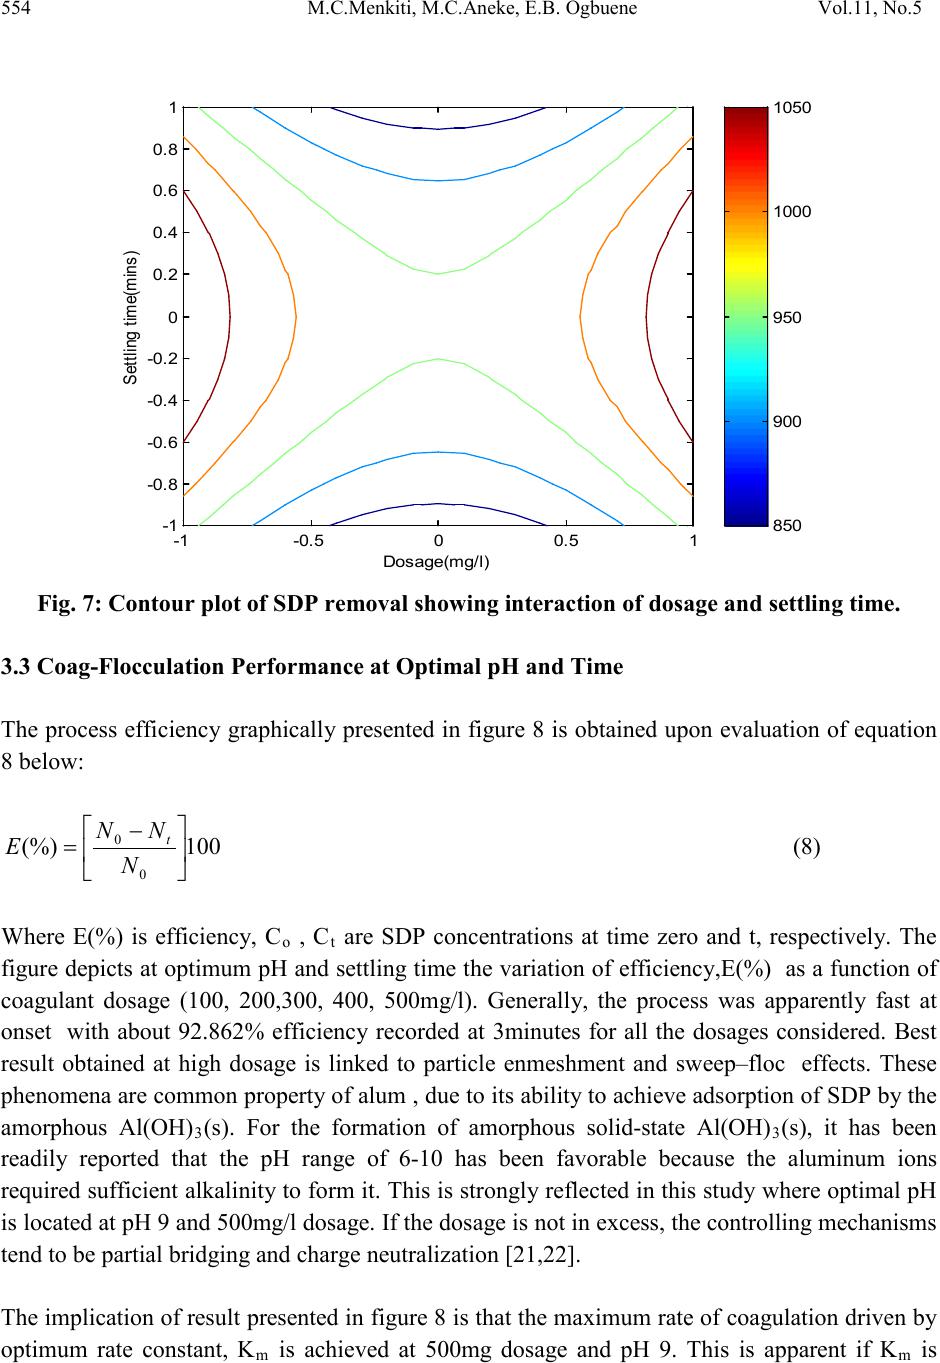 554 M.C.Menkiti, M.C.Aneke, E.B. Ogbuene Vol.11, No.5 850 900 950 1000 1050 -1 -0.500.5 1 -1 -0.8 -0.6 -0.4 -0.2 0 0.2 0.4 0.6 0.8 1 Dosage(m g/l) S ett li ng tim e(m i ns) Fig. 7: Contour plot of SDP removal showing interaction of dosage and settling time. 3.3 Coag-Flocculation Performance at Optimal pH and Time The process efficiency graphically presented in figure 8 is obtained upon evaluation of equation 8 below: (8) Where E(%) is efficiency, C o , Ct are SDP concentrations at time zero and t, respectively. The figure depicts at optimum pH and settling time the variation of efficiency,E(%) as a function of coagulant dosage (100, 200,300, 400, 500mg/l). Generally, the process was apparently fast at onset with about 92.862% efficiency recorded at 3minutes for all the dosages considered. Best result obtained at high dosage is linked to particle enmeshment and sweep–floc effects. These phenomena are common propert y of alum , due to its ability to achieve adsorption of SDP b y the amorphous Al(OH)3(s). For the formation of amorphous solid-state Al(OH)3(s), it has been readily reported that the pH range of 6-10 has been favorable because the aluminum ions required sufficient alkalinity to form it. This is strongly reflected in this study where optimal pH is located at pH 9 and 500mg/l dosage. If the dosage is not in excess, the controlling mechanisms tend to be partial bridging and charge neutralization [21,22]. The implication of result presented in figure 8 is that the maximum rate of coagulation driven by optimum rate constant, Km is achieved at 500mg dosage and pH 9. This is apparent if Km is 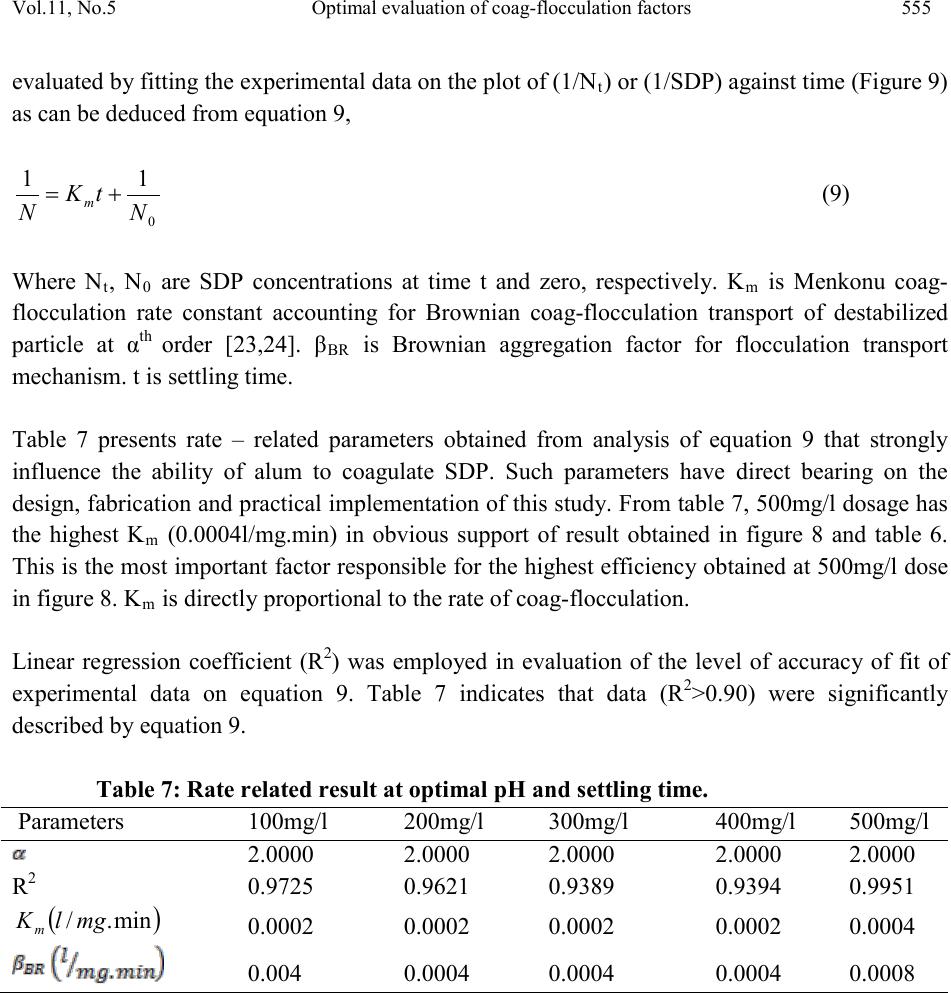 Vol.11, No.5 Optimal evaluatio n of coag-flocculation factors 555 evaluated by fitting the experimental data on the plot of (1/Nt) or (1/SDP) against time (Figure 9) as can be deduced from equation 9, (9) Where Nt, N0 are SDP concentrations at time t and zero, respectively. Km is Menkonu coag- flocculation rate constant accounting for Brownian coag-flocculation transport of destabilized particle at αth order [23,24]. βBR is Brownian aggregation factor for flocculation transport mechanism. t is settling time. Table 7 presents rate – related parameters obtained from analysis of equation 9 that strongly influence the ability of alum to coagulate SDP. Such parameters have direct bearing on the design, fabrication and practical implementation of this study. From table 7, 500mg/l dosage has the highest Km (0.0004l/mg.min) in obvious support of result obtained in figure 8 and table 6. This is the most important factor responsible for the highest efficienc y obtained at 500mg/l dose in figure 8. Km is directly proportional to the rate of coag-flocculation. Linear regression coefficient (R2) was employed in evaluation of the level of accuracy of fit of experimental data on equation 9. Table 7 indicates that data (R2>0.90) were significantly described by equation 9. Table 7: Rate related result at optimal pH and settling time. 0.0002 0.0002 0.0002 0.0002 0.0004 0.004 0.0004 0.0004 0.0004 0.0008 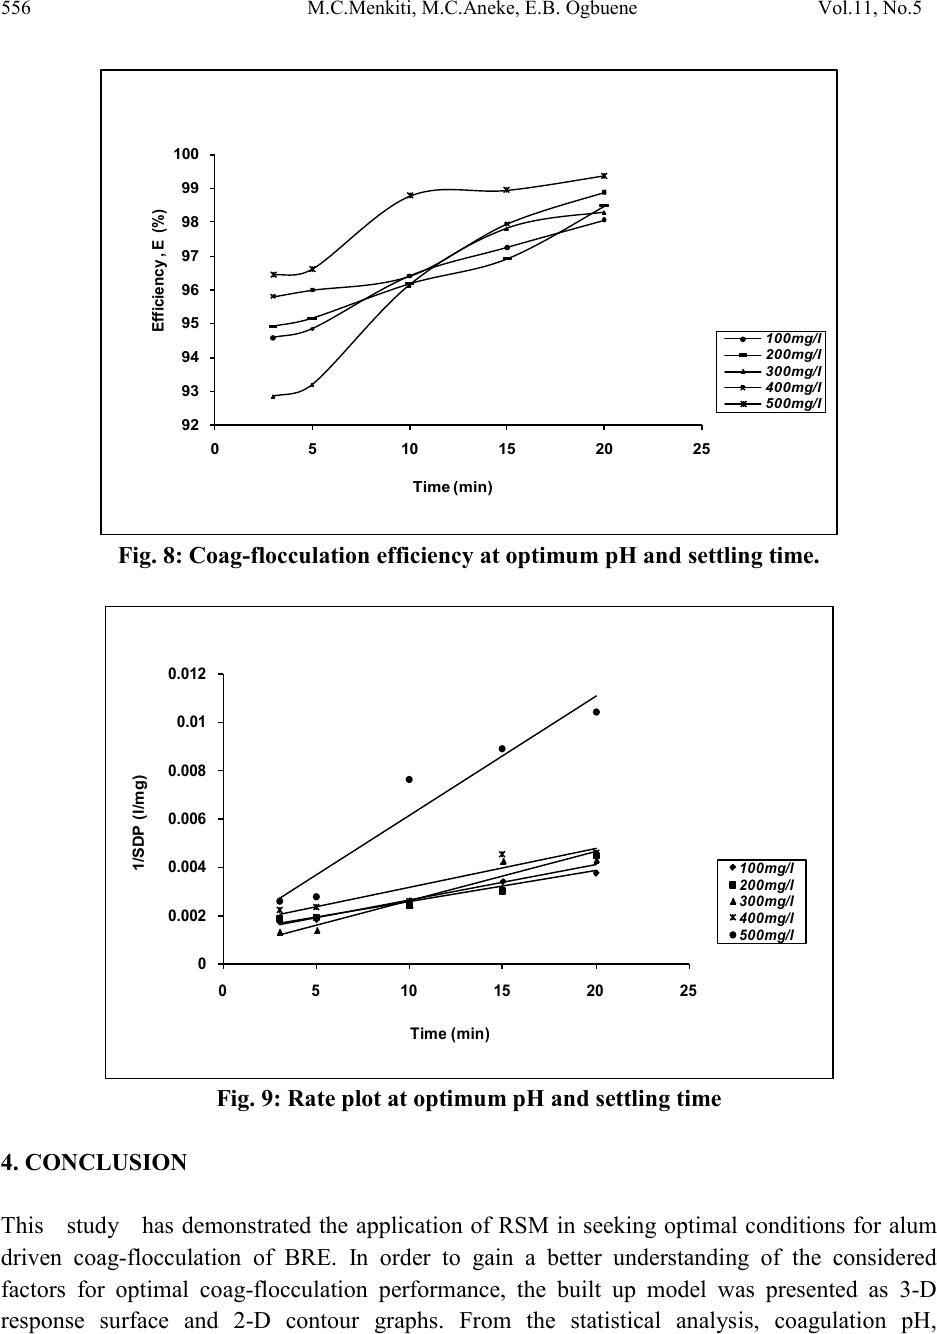 556 M.C.Menkiti, M.C.Aneke, E.B. Ogbuene Vol.11, No.5 92 93 94 95 96 97 98 99 100 0510 15 20 25 Fig. 8: Coag-flocculation efficiency at optimum pH and settling time. 0 0.002 0.004 0.006 0.008 0.01 0.012 05 10 15 20 25 Fig. 9: Rate plot at optimum pH and settling time 4. CONCLUSION This study has demonstrated the application of RSM in seeking optimal conditions for alum driven coag-flocculation of BRE. In order to gain a better understanding of the considered factors for optimal coag-flocculation performance, the built up model was presented as 3-D response surface and 2-D contour graphs. From the statistical analysis, coagulation pH, 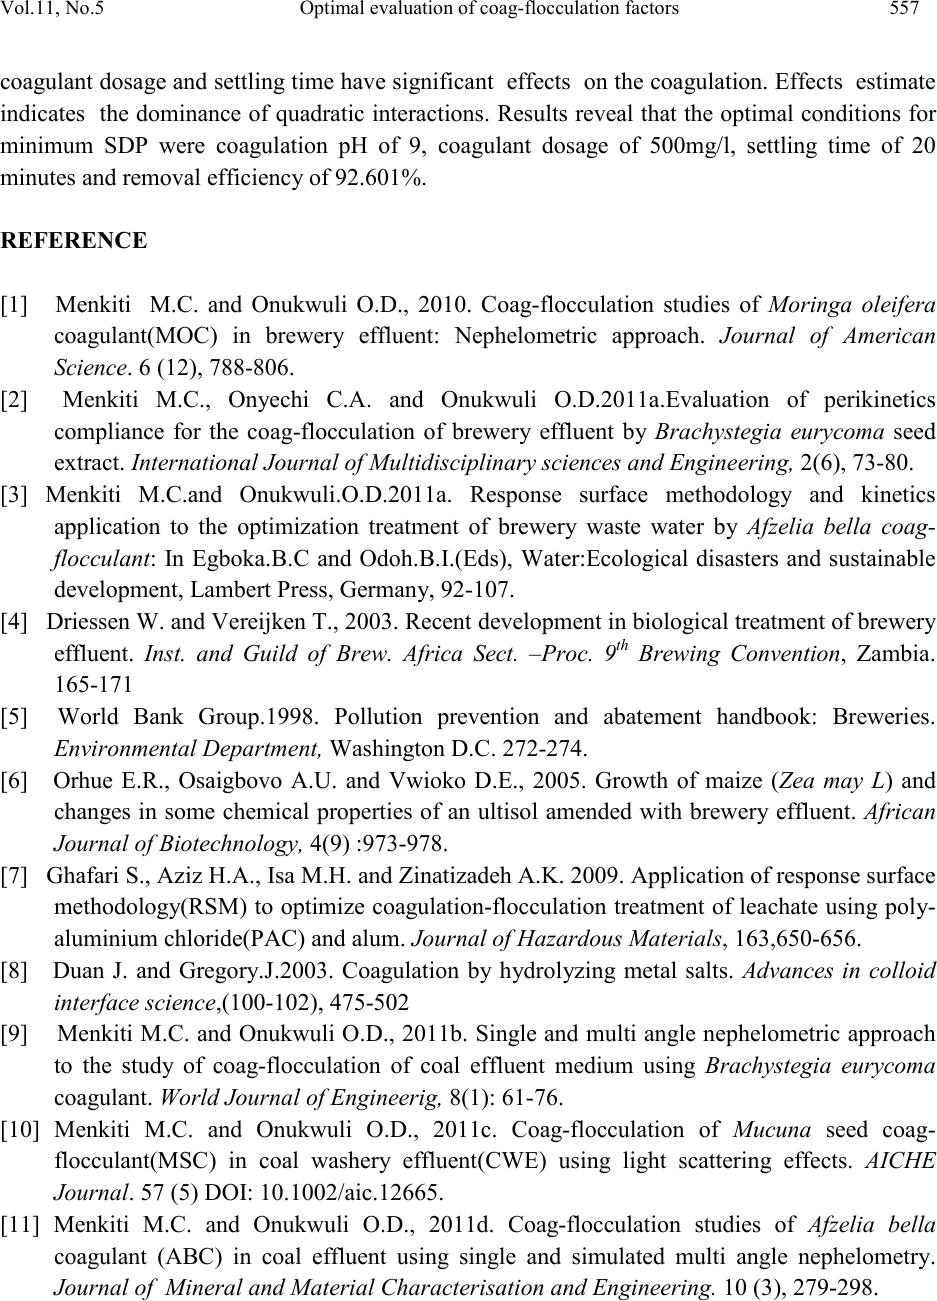 Vol.11, No.5 Optimal evaluatio n of coag-flocculation factors 557 coagulant dosage and settling time have significant effects on the coagulation. Effects estimate indicates the dominance of quadratic interactions. Results reveal that the optimal conditions for minimum SDP were coagulation pH of 9, coagulant dosage of 500mg/l, settling time of 20 minutes and removal efficiency of 92.601%. REFERENCE [1] Menkiti M.C. and Onukwuli O.D., 2010. Coag-flocculation studies of Moringa oleifera coagulant(MOC) in brewery effluent: Nephelometric approach. Journal of American Science. 6 (12), 788-806. [2] Menkiti M.C., Onyechi C.A. and Onukwuli O.D.2011a.Evaluation of perikinetics compliance for the coag-flocculation of brewery effluent by Brachystegia eurycoma seed extract. International Journal of Multidisciplinary sciences and Engineering, 2(6), 73-80. [3] Menkiti M.C.and Onukwuli.O.D.2011a. Response surface methodology and kinetics application to the optimization treatment of brewery waste water by Afzelia bella coag- flocculant: In Egboka.B.C and Odoh.B.I.(Eds), Water:Ecological disasters and sustainable development, Lambert Press, Germany, 92-107. [4] Driessen W. and Vereijken T., 2003. Recent development in biological treatment of brewery effluent. Inst. and Guild of Brew. Africa Sect. –Proc. 9th Brewing Convention, Zambia. 165-171 [5] World Bank Group.1998. Pollution prevention and abatement handbook: Breweries. Environmental Department, Washington D.C. 272-274. [6] Orhue E.R., Osaigbovo A.U. and Vwioko D.E., 2005. Growth of maize (Zea may L) and changes in some chemical properties of an ultisol amended with brewery effluent. African Journal of Biotechnology, 4(9) :973-978. [7] Ghafari S., Aziz H.A., Isa M.H. and Zinatizadeh A.K. 2009. Application of response surface methodology(RSM) to optimize coagulation-flocculation treatment of leachate using poly- aluminium chloride(PAC) and alum. Journal of Hazardous Materials, 163,650-656. [8] Duan J. and Gregory.J.2003. Coagulation by hydrolyzing metal salts. Advances in colloid interface science,(100-102), 475-502 [9] Menkiti M.C. and Onukwuli O.D., 2011b. Single and multi angle nephelometric approach to the study of coag-flocculation of coal effluent medium using Brachystegia eurycoma coagulant. World Journal of Engineerig, 8(1): 61-76. [10] Menkiti M.C. and Onukwuli O.D., 2011c. Coag-flocculation of Mucuna seed coag- flocculant(MSC) in coal washery effluent(CWE) using light scattering effects. AICHE Journal. 57 (5) DOI: 10.1002/aic.12665. [11] Menkiti M.C. and Onukwuli O.D., 2011d. Coag-flocculation studies of Afzelia bella coagulant (ABC) in coal effluent using single and simulated multi angle nephelometry. Journal of Mineral and Material Characterisation and Engineering. 10 (3), 279-298.  558 M.C.Menkiti, M.C.Aneke, E.B. Ogbuene Vol.11, No.5 [12] Oladoja A.N. and Aliu Y.D., 2009. Snail shell as coagulant aid in t he alum precipitation of malachite green from aqua system. Journal of Hazardous Materials. 164 (2-3), 1496-1502. [13] Menkiti M.C .,Mbah G.O. and Onukwuli O.D. 2011b.Turbidimetric perikinetics behavior of Afzelia bella seed biomass for coag-flocculation treatment of Ph varying brewery effluent. International Journal of Chemistry. 3(4),104-115. [14] Trinh T.K. and Kang L.S.2010. Application of response surf ace method as an experimental design to optimize coagulation test. Environmental Engineering Research,15(2),063-070. [15] Mason R.L., Gunst R.F. and Hess J.L. 2003. Statistical design and analysis of experiment, Eight application to Engineering and Science, 2nd edition, Wiley, New York. [16] Khuri A.I. and Cornell J.A. 1996. Response surface, design and analysis, 2nd edition, Marcel Dekker Inc., New York. [17] Clesceri L.S.,Greenberg A. E. and Eaton A.D.,1999. Standard methods for the examinatin of water and waste water. 20th editon. APHA. USA. [18] Silva G.F., Camargo F.L. and Ferreira A.L.O., 2011. Application of response surface methodology for optimization of biodiesel production by transesterification of soybean oil with ethanol. Fuel Processing Technology, 92:407-413. [19] Nordin M.Y., Venkatesh .V.C.,Sharif S., Elting S. and Abdullah A.2004. Application of response surface methodology in describing the performance of coated carbide tools when turning AISI 104 steel. Journal of Material Process Technology,145, 46-58. [20] Beltran-Heredia J ., S anchez-Martin J . and Delgado-Regalado A. 2009. R emoval of dyes b y Moringa oleifera seed extract. Journal of Chemical Technology and Biotechnology, 84, 1653-1659. [21] Menkiti M.C., Ugodulunwa F.X.O., Onukwuli O.D. and Nnaji P.C. 2008. Studies on the coagulation and flocculation of coal washery effluent: A kinetic approach. Nigeria Society of Engineers Technical Transactions,43(4),36-58. [22] Wang P.C., ChenY.Z., Ge X.W. and Yu H.Q.2007. Optimization of coagulation- flocculation process for paper-recycling waste water treatment using response surface methodology, Colloids and surfacesA: Physiochem. Eng.Aspect,302,204-210. [23] Menkiti M.C., Nwoye C.I., Onyechi C.A. and Onukwuli O.D. 2001c. Factorial optimization and kinetics o f coal washery effluent coag-flocculation by Moringa oleifera seed biomass . Advances in Chemical Engineering and science,1,125-132. [24] Menkiti M.C., Nnaji P.C. and Onukwuli O.D. 2009. Coag-flocculation kinetics and functional parameters response of periwinkle shell coagulant(PSC) to pH variation in organic rich coal effluent medium. Nature and Science, 7(6),1-8.
|