Journal of Minerals & Materials Characterization & Engineering, Vol. 11, No.5, pp.471-478, 2012
jmmce.org Printed in the USA. All rights reserved
471
The Effect of Phosphate Mixing on Structural, Spectroscopic, Mech an ic al and
Optical Properties of Zinc tris Thiourea Sulphat e (ZTS) Single Crystals
A. Puhal Raj and C. Ramachandra Raja*
Government Arts College (Autonomous), Kumbakonam-612001, Tamilnadu, India.
*Corresponding Author: crraja_phy@yahoo.com.
ABSTRACT
Zinc tris Thiourea Sulphate (ZTS) is a semi organic non-linear optical crystal. The ZTS and
phosphate mixed (in different mol %) ZTS crystals have been grown from a queous solution using
the slow evaporation method. Single crystal XRD were carried out for ZTS and phosphate mix ed
ZTS crystals to determine cell parameters. FTIR analysis identified modes of vibrations of
different molecular groups and confirms the presence of phosphate ion. The UV-Vis-NIR
spectrum shows that the material has wide optical transpar ency in the entire visible region. The
second harmonic generation (SHG) was confirmed by Kurtz powder method. It is found that 10
mol % of phosphate mixed ZTS crystal has better SHG efficiency than pure ZTS crystal. The
Vicker microhardness test was carried out on the grown crystals and Vicker’s Hardness Number
was found increase with increase in phosphate mixing.
Keywords: Phosphate mixed zinc tris thiourea sulphate; Second harmonic generation; NLO
material.
1. INTRODUCTION
A non linear optical (NLO) material plays a crucial role in the laser technology, optical
communication and electro optic modulation [1, 2]. Materials with good non linear optical
susceptibilities and high laser damage threshold value are needed for these applications. There
are many works carried out to synthesis NLO materials. In the present work, improving quality
of a NLO material Zinc tris Thiourea Sulphate (ZTS) crystal with molecular formula
Zn( N H2CSNH2)3SO4 has been done successfully by mixing of phosphate. ZTS belongs to
orthorhombic system with point group mm2 and space group Pca21. SHG efficiency of ZTS is
472 A. Puhal Raj and C. Ramachandra Raja Vol.11, No.5
1.2 times is that of KDP [3] . The growth and characterization of ZTS were reported in a numbe r
of recent papers [4-6]. Jayavel et al reported substitution of phosphate with ZTS improves its
properties [7]. It is of interest to us to investigate the effect of high level m ix ing of phosphate ion
with ZTS. Hence, we report the property change of ZTS crystals due to high level phosphate
mixing.
2. EXPERIMENTAL
2.1 Synthesis
The ZTS was synthesized from zinc sulphate heptahydrate and thiourea taken in the ratio of 1:3
by the following reaction
ZnS O4.7H2O + 3NH2CSNH2 → Zn(NH2CSNH2)3SO4 + 7H2O
The solution of zinc sulphate heptahydrate was added to the soluti on of thiourea, the mix ture had
to be stirred vigorously to avoid precipitation of other phases. The resultant precipitate of ZTS
was dried. The salt was purified by repeated recrystallization process by using double distilled
water as solvent. The ZTS solution was prepared and maintained at 36oC in a constant
temperature bath with an accuracy of ±0.01oC with continuous stirring to ensure homogeneous
temperatur e concentration over the entire volume of the solution. The trans parent colourless ZTS
single crystals were grown in a period of 40 days by using slow evaporation technique. In the
ZTS solution, the phosphoric acid was dissolved with different molar concentration (10 and 25
mol %). Phosphate mixed ZTS solutions are also allowed to slow evaporation by using the above
condition. The good quality phosphate mixed ZTS crystals were harvested in the same period.
2.2 Characterization
The grown ZTS and 10 and 25 mol % of phosphat e mix ed ZTS single cr ystals were subjected to
various characterization techniques like single crystal XRD, Fourier transform infrared (FTIR),
UV-Vis-NIR, microhardness and non linear optical studies. The single crystals of ZTS and 10
and 25 mol % of phosph ate mix ed ZTS have bee n subjected to X-ray diffraction studies using an
ENRAF NONIUS CAD4 X-ray diffractometer to determine the unit cell parameters. The FTIR
spectra were carried out using Perkin Elmer RX1 spectrometer. The UV-Vis -NIR spectral
studies were studied using Lambda 35 spectrometer in the range 190-1100 nm. The Vickers
hardness measurement was made on the crystals using Shimadzu (Japan) HMV-2 hardness
tester. SHG test has been studied by Kurtz powder technique.
3. RESULTS AND DISCUSSION
3.1 Single Crystal X-ray Diffract ion
Vol.11, No.5 The effe ct of phosphate mix i ng on struc tura l 473
Table 1: Unit cell parameters of pure ZTS and phosphate mixed ZTS single crystals.
Crystal
a (Å)
b (Å)
c (Å)
V (Å3)
Pure ZTS
11.141
7.769
15.501
1342
10 mol % of PO
4
+ ZTS
11.141
7.770
15.537
1345
25 mol % of PO
4
+ ZTS
11.156
7.786
15.526
1348
The cell parameters of pure ZTS and phosphate mixed ZTS crystals are given in table 1. The
values of α, β and γ are same for pure and phosphate mixed ZTS crystals which is indicating no
change in the orthorhombic system due to mixing of phosphate ions. Cell volume of pure ZTS
and 10 and 25 mol % of phosphate mixed ZTS are 1342 Å3, 1345 Å3 and 1348 Å3 respectively.
There is a slight increase in the cell volume of phosphate mixed ZTS when compared to pure
ZTS crystals. This shows that phosphate ions are entered into the ZTS crystal lattice.
3.2 FTIR Spectral Analysis
In ZTS compound, there are three thiourea groups and one sulphate ion. Each thiourea group
consists of one carbon atom bonding to one sulphur and two nitrogen atoms. Each of the nitrogen
atoms in thiourea is connected to two hydrogen atoms. Zinc ion is tetrahedraly coordinated to
three sulphur atoms of thiourea and to an ox ygen atom of sulphate ion [8]. The FTIR spectra of
pure ZTS and 10 and 25 mol % of phosphate mixed ZTS were recorded in the range 450-4000
cm-1 and they are shown in Fig. 1(a-c). The spectra of ZTS and phosphate mixed ZTS crystals
can be interpreted as follows: The N-H absorption frequency in the region between 3000 cm-
1 and 4000 cm-1 arises due to symmetric and asymmetric vibration of NH2 group of the zinc
coordinated thiourea [8]. The bending vibration of NH2 was observed around 1627 cm-1 [9] . The
C-N and N-C-N stretching vibration are observed near 1114 cm-1 and 1510 cm-1, respectively
[8].
The symmetric and asymmetric stretching vibration of C=S was observed around 714 cm-1 and
1401 cm-1, respectively [10]. The symmetric and asymmetric bending vibration of N-C-S was
observed near 474 cm-1 and 617 cm-1 respectively. The as ymmetric bending vibration of N-C-N
was observed near 530 cm-1 [8]. The presence of peaks near 1000cm-1 confirms the presence of
sulphate ion in the coordination sphere. The observed additional peaks near 1200 cm-1 clearly
confirms the presence of phosphate in the coordination sphere [7]. The observed vibrational
spectra of phosphate mixed ZTS crystals are similar to the vibrational spectra of pure ZTS
crystal and only very slight frequency shifts are observed. The tentative as signment s of record ed
FTIR spectra are given in table 2.
474 A. Puhal Raj and C. Ramachandra Raja Vol.11, No.5
0
20
40
60
80
100
120
4000300020001500 1000500
cm-1
%T
Fig. 1: FTIR spectra for a) pure ZTS and b) 10, c) 25 mol % of phosphate mixed ZTS.
Table 2: Comparison of vibrational modes of pure ZTS and phosphate mixed ZTS. (ν-bond
stretching; s-symmetric; as-asymmetric; δ-deformation).
Pure ZTS (cm-1)
10 mol % PO
4
+
ZTS (cm-1)
25 mol % PO
4
+
ZTS (cm-1)
Assignments
474
479
475
δs(N-C-S)
530
524
530
δas(N-C-N)
617
619
617
δas(N-C-S)
714
715
714
νs(C=S)
1114
1109
1111
ν(C-N)
1401
1400
1400
νas(C=S)
1510
1507
1507
ν(N-C-N)
1627
1626
1625
δ(NH
2
)
3179
3184
3186
νs(NH
2
)
3310
3318
3311
νs(NH
2
)
3825
3823
3822
νas(NH
2
)
3924
3923
3928
νas(NH
2
)
3.3 UV-Vis-Nir Spectral Analysis
The optical absorption spectra of ZTS and phosphate mixed ZTS single crystals were recorded in
the ran ge 190 -1100 nm. These are shown in the Fig. 2(a-c). The wide transmission in the region
Vol.11, No.5 The effe ct of phosphate mix i ng on struc tura l 475
300-1100 nm is an advantage as it is the key requirement for NLO application. The spectra of
absorption show that all of three crystals have lower cut off wavelength at around 300 nm. The
peak in the range 195 to 300 nm, in pure ZTS and phosphate mixed ZTS crystals is due to π-π*
transitions of thiourea.
-0.5
0
0.5
1
1.5
2
2.5
3
3.5
4
190300 400 500 600 700800 90010001100
nm
A
-0.5
0
0.5
1
1.5
2
2.5
3
3.5
4
190 300400 500600 700800 90010001100
nm
A
C)
-0.5
0
0.5
1
1.5
2
2.5
3
3.5
4
190300 400500600 700 800 90010001100
nm
A
Fig. 2: UV absorbance spectra for a) pure ZTS and b) 10, c) 25 mol % of phosphate mixed ZTS.
3.4 Microhardness Studies
The Vicke r mi croh ardnes s tes t was pe rformed on ZTS and phosphate mixed ZTS single crystals.
Hardness measurements were taken for different applied loads. Vicker’s Hardness Number
(VHN) was calculated for the samples by using the relation Hv =1.8544 P/d2 Kg m m -2. Here, Hv
is Vicker’s Hardness Number, P is applied load in Kg and d is average diagonal length in mm.
The tests showed that phosphates mixed ZTS crystals are stronger than pure ZTS cr ystals. Fig. 3.
shows value of Hv increases with increase on load up to 200 gm and then attains saturation.
Increases in hardness value of phosphate mixed ZTS crystals are due to the addition of phosphate
in the crystal lattice. The degree of negative charge of phosphate ion is high and it improves
bonding between phosphate ion and others. Hardness values are increased when the percentage
of phosphate addition increases. The increase in the hardness value of phosphate mixed ZTS
single crystals proves it to be a good engineering material for the fabrication of devices for NLO
process.
476 A. Puhal Raj and C. Ramachandra Raja Vol.11, No.5
Fig. 3: Variation of microhardness for a) pure ZTS and b) 10, c) 25 mol % of phosphate mixed
ZTS .
3.5 Second Harmonic Generation Studies
Second Harmonic Generation (SHG) test for the powder samples of pure ZTS and phosphate
mixed ZTS have been studied by kurtz powder technique. In this method the powder samples
were illuminated using Nd:YAG laser emitting a fundamental wavelength of 1064 nm. The
second harmonic generation was confirmed by the emission of green radiation by the crystal
samples with the output power of 27, 32 and 25 mV for pure ZTS and 10 and 25 mol % of
phosphate mixed ZTS respectively. The results are shown in table 3. The π orbital electron
delocalization in thiourea due to mesomeric effect is the reason for the non linear optical
response of ZTS and phosphate mixed ZTS crystals. As the degree of negative charge on ox ygen
of phosphate is more than oxygen of sulphate, phosphate may coordinate better than sulphate.
This shows that the bonding between the zinc and oxygen of phosphate is stronger. This may
weaken the interaction of zinc with thiourea in phosphate mixed ZTS and hence the
delocalization of the electronic cloud between the zinc and sulphur of thourea is hindered. This
could be the reason for the change in the SHG efficiency of phosphate mixed ZTS crystals
compared to pure ZTS crystal. Efficiency of NLO property increases upto 18 % in l0 mol % of
phosphate mixed ZTS crystal compared to pure ZTS.
Table 3: SHG efficiency of pure ZTS and PO4 mixed ZTS single crystals.
Crystal
SHG efficiency
Pure ZTS
27 mV
10 mol % of PO
4
+ ZTS
32 mV
25 mol % of PO
4
+ ZTS
25 mV
Vol.11, No.5 The effe ct of phosphate mix i ng on struc tura l 477
4. CONCLUSION
Single crystals of pure ZTS and 10 and 25 mol % of phosphate mixed ZTS have been grown by
slow evaporation method. Single crystal XRD studies reveal that no structural change in
phosphate mixed ZTS crystals. The presence of f unctional groups in grown cr ystals is identified
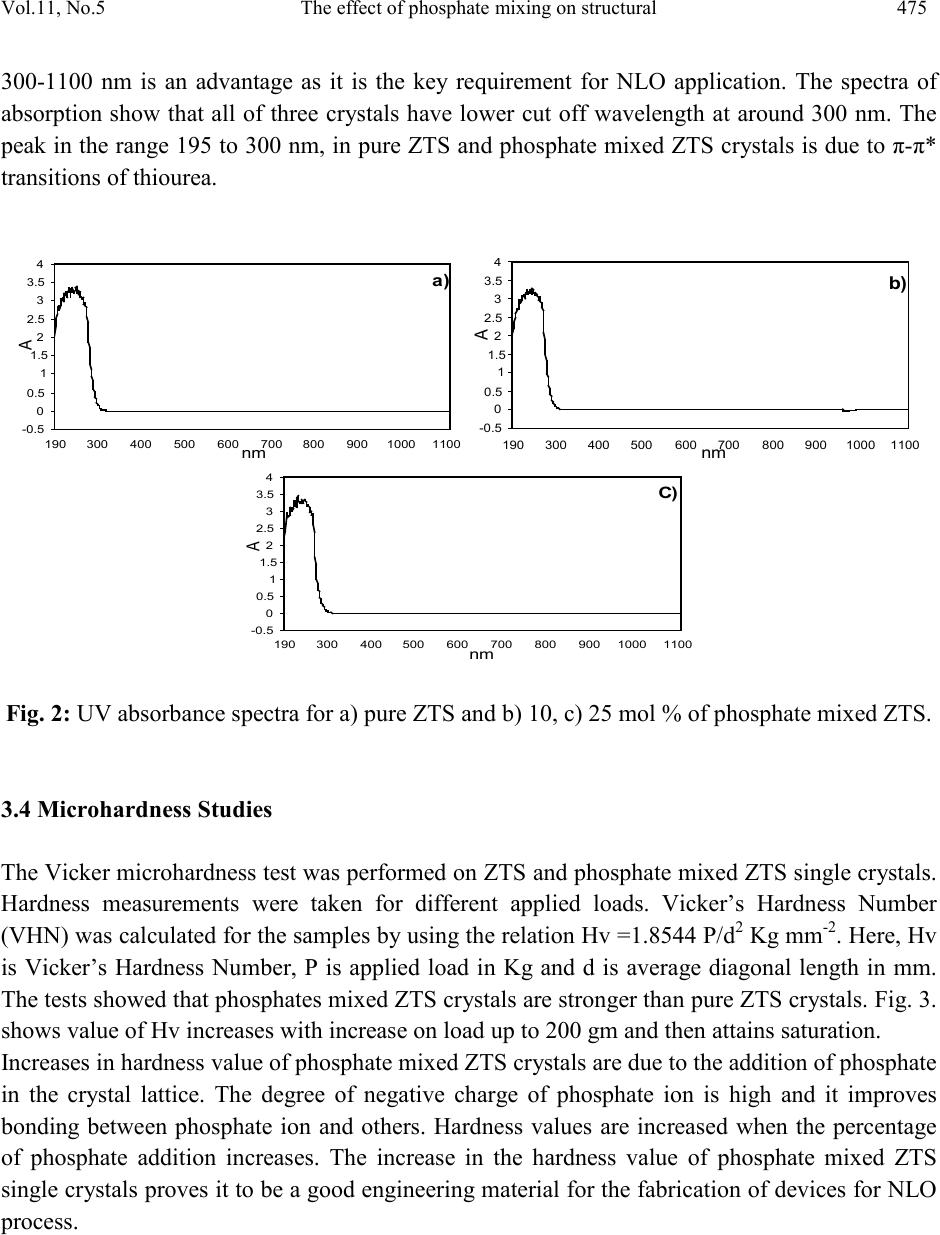
by FTIR spectral analysis. UV-Vis-NIR spectra shows broad transparency of pure ZTS and
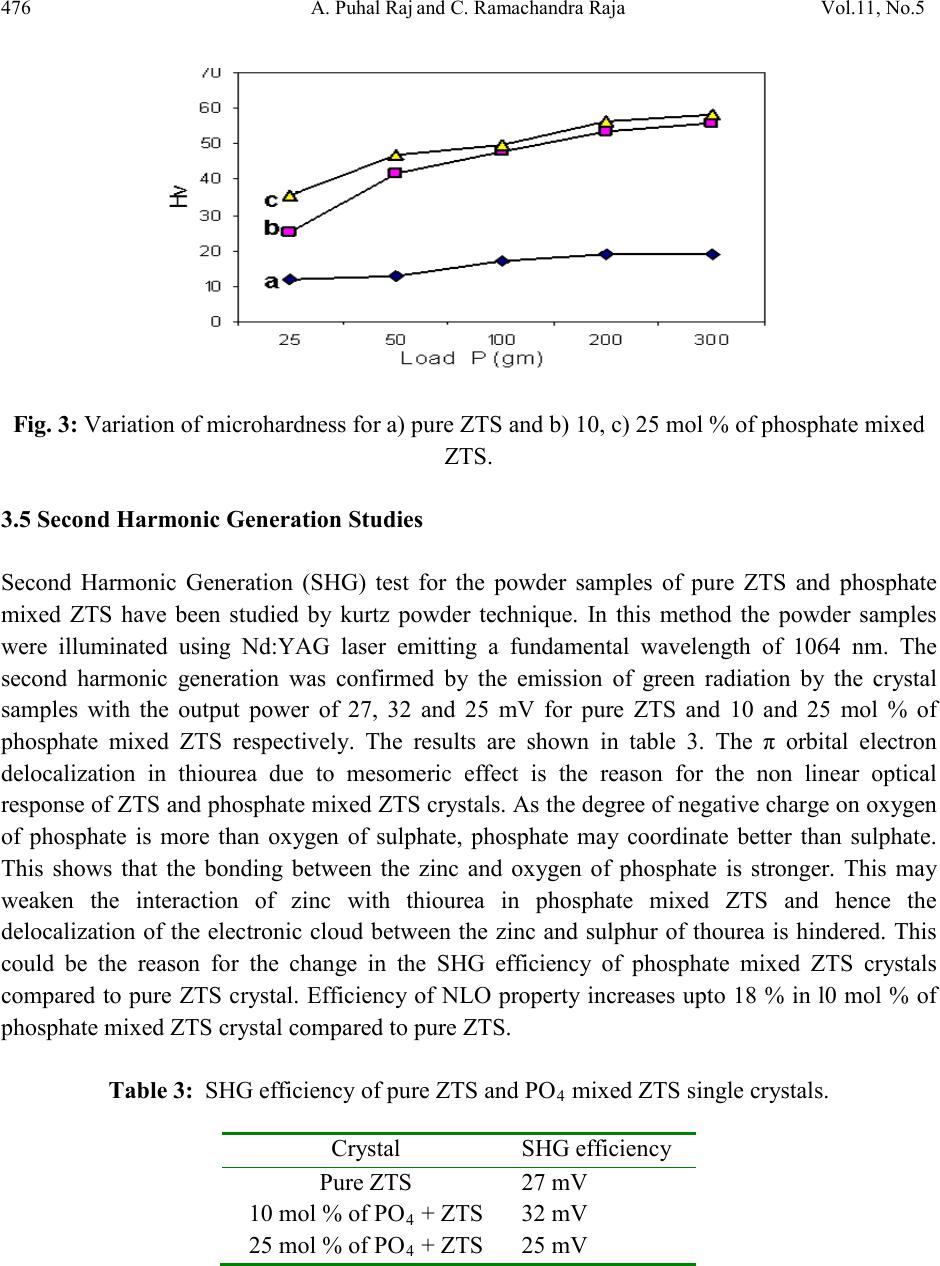
phosphate mixed ZTS crystals lies between 300nm and 1100nm. Vicker hardness test show
increase in the hardness value of phosphate mixed ZTS crystals due to addition of phosphate in
ZTS lattice. SHG test reveals that 10 mol % of phosphate mixed ZTS crystal has greater SHG
efficiency than pure ZTS. Hence, it is concluded that due to its wide transparency range, high
hardness and greater SHG conversion efficiency 10 mol % of phosphate mixed ZTS crystal can
be a good engineering material for fabrication of nonlinear optical devices.
ACKNOWLEDGEMENTS
The authors are very grateful to Dr. P.K. Das, Indian Institute of Science, Bangalore (India) for
measurement of SHG efficiency and IIT, Chennai for FTIR spectrum. The authors thank
Madurai Kamaraj University, Madurai for single crystal XRD and St. Joseph’s College,
Tiruchirappalli for microhardness studies.
REFERENCES
1. Marcy, H. O., Warren, L. F., Webb, M. S., Ebbers , C. A., Velsko, S. P., Kennad y, G. C., and
Catella G. C., 1992, “Second-harmonic generation in zinc tris(thiourea) sulphate” Applied
Opts., Vol. 31, Ed. 24, pp. 5051-5060.
2. Wang X. Q., Xu D., Yuan D. R., Tian Y. P., Yu W. T., Sun S. Y., Yang Z. H., fang Q., Lu
M. K., Yan Y. X., Meng F. Q., Guo S. Y., Zang G. H., and Jiang M. H., 1999, “Synthesis,
structure and properties of a new nonlinear optical material: zinc cadmium tetrathiocyanate”
Mater Res. Bull. Vol. 34, pp. 2003-2011.
3. Marcy H. O., Rosker M. J., Warren L., Cunningham P. H., Thomas C. A., Deloach L. A.,
Velsko S. P., Enners C. A., Liao J. H., and Kamatzidis M. G., 1995, “L-Histidine
tetrafluoroborate: a solution-grown semiorganic crystal for nonlinear frequency conversion”
Opt. Lett. Vol. 20, pp. 252-254.
4. Sastry P. U., Chitra R., Choudhury R. R., and Ramanadhan M., 2004,” Zinc (tris) thiourea
sulphate (ZTS): A single crystal neutron diffraction study” Pramana J. of physics, 63, pp.
257-261.
5. Ushasree P. M., Jayavel R., Subramanian C., Ramasamy P., 1999, “Growth of zinc thiourea
sulfate(ZTS) single crystals–a potential semiorganic NLO material”, J. Cryst. Growth, 197,
pp. 216-220,
478 A. Puhal Raj and C. Ramachandra Raja Vol.11, No.5
6. Gupte S. J., and Desai C. F.,1999 ” Vickers Hardness Anisotropy and Slip System in Zinc
(Tris) Thiourea Sulphate Crystals”, Cryst. Res. Technol. 34, pp.1329-1332.
7. Ushasree P. M., Jayavel R., Ramasamy P., 1999, “Growth and Characterisation of phosphate
mixed ZTS single crystals”, Mat. Science and Eng. B65, pp. 153-163.
8. Selvasekarapandian S., Vivekanandian K., Kolandaivel P., and Gundurao T. K., 1997,
“Vibrational Studies of Bis(thiourea) Cadmium Chloride and Tris(thiourea) Zinc Sulphate
Semio rganic N on-linear Optical Crystals”, Cryst. Res. Technol. 32, pp. 299-309.
9. Ushasree P.M., Jayavel R., Subramanian C. and Ramasam y P., 1999, “Growth of ZTS Sin gle
Crystal: A potential semiorganic NLO Material” J. Crystal Growth 197, pp. 216-223.
10. Silverstein R. M., Clayton Basseler G., and Morrill T. C., “Spectrometric Identificaton of
Organic Compounds”, V-Edn. John Willey & Sons, inc. New York 1998.