Paper Menu >>
Journal Menu >>
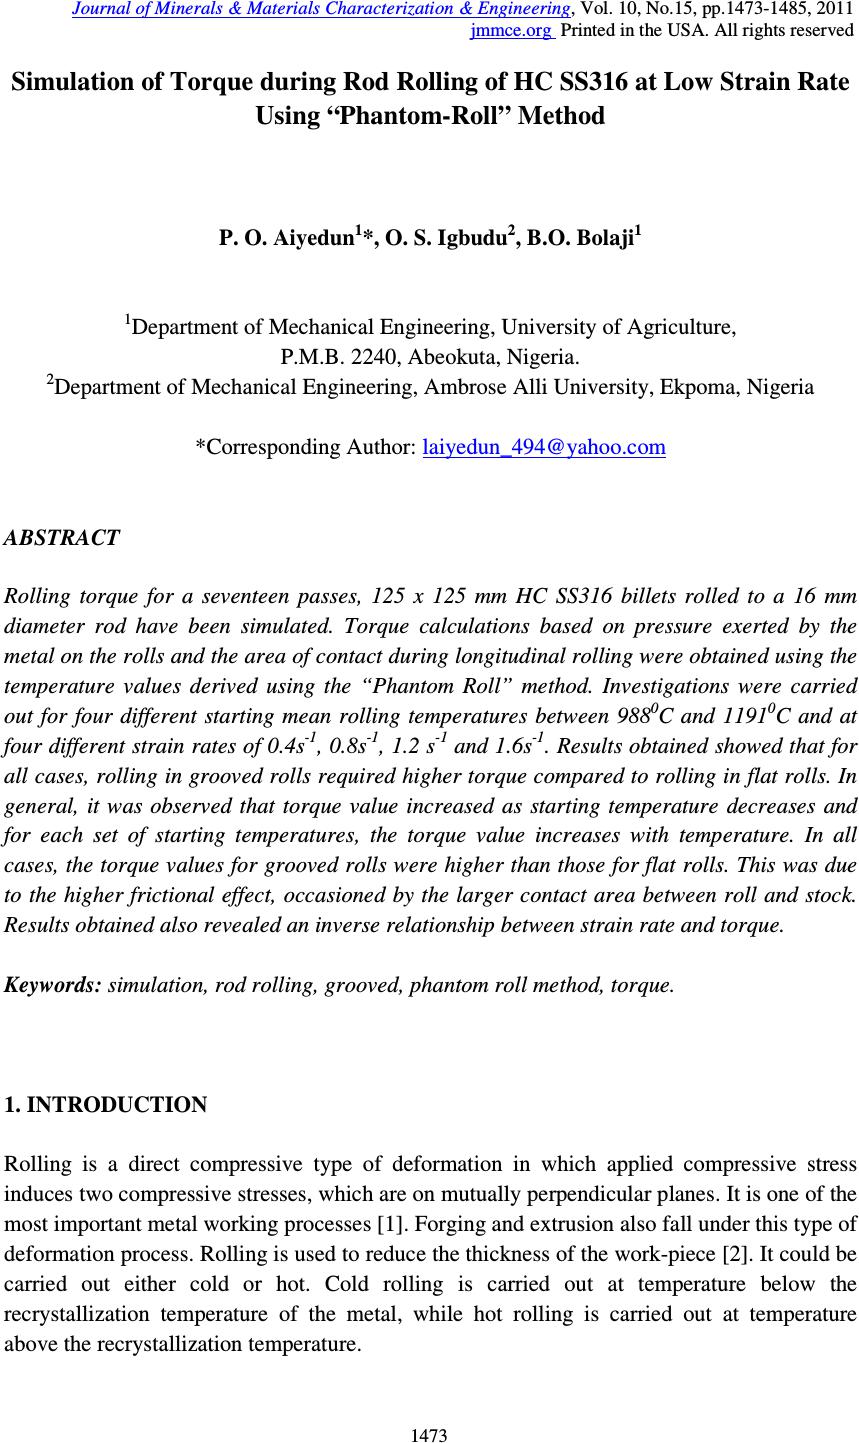 Journal of Minerals & Materials Characterization & Engineering, Vol. 10, No.15, pp.1473-1485, 2011 jmmce.org Printed in the USA. All rights reserved 1473 Simulation of Torque during Rod Rolling of HC SS316 at Low Strain Rate Using “Phantom-Roll” Method P. O. Aiyedun 1 *, O. S. Igbudu 2 , B.O. Bolaji 1 1 Department of Mechanical Engineering, University of Agriculture, P.M.B. 2240, Abeokuta, Nigeria. 2 Department of Mechanical Engineering, Ambrose Alli University, Ekpoma, Nigeria *Corresponding Author: laiyedun_494@yahoo.com ABSTRACT Rolling torque for a seventeen passes, 125 x 125 mm HC SS316 billets rolled to a 16 mm diameter rod have been simulated. Torque calculations based on pressure exerted by the metal on the rolls and the area of contact during longitudinal rolling were obtained using the temperature values derived using the “Phantom Roll” method. Investigations were carried out for four different starting mean rolling temperatures between 988 0 C and 1191 0 C and at four different strain rates of 0.4s -1 , 0.8s -1 , 1.2 s -1 and 1.6s -1 . Results obtained showed that for all cases, rolling in grooved rolls required higher torque compared to rolling in flat rolls. In general, it was observed that torque value increased as starting temperature decreases and for each set of starting temperatures, the torque value increases with temperature. In all cases, the torque values for grooved rolls were higher than those for flat rolls. This was due to the higher frictional effect, occasioned by the larger contact area between roll and stock. Results obtained also revealed an inverse relationship between strain rate and torque. Keywords: simulation, rod rolling, grooved, phantom roll method, torque. 1. INTRODUCTION Rolling is a direct compressive type of deformation in which applied compressive stress induces two compressive stresses, which are on mutually perpendicular planes. It is one of the most important metal working processes [1]. Forging and extrusion also fall under this type of deformation process. Rolling is used to reduce the thickness of the work-piece [2]. It could be carried out either cold or hot. Cold rolling is carried out at temperature below the recrystallization temperature of the metal, while hot rolling is carried out at temperature above the recrystallization temperature. 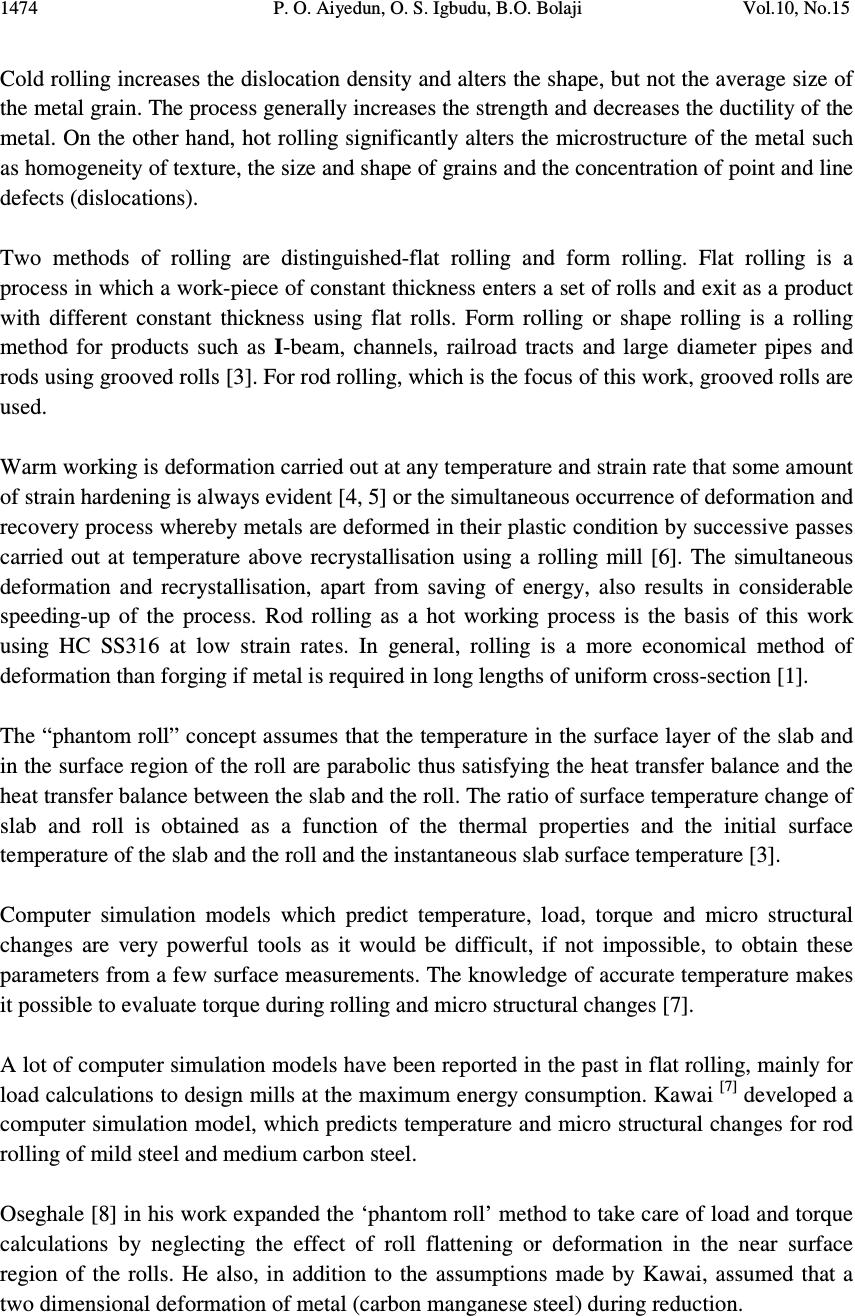 1474 P. O. Aiyedun, O. S. Igbudu, B.O. Bolaji Vol.10, No.15 Cold rolling increases the dislocation density and alters the shape, but not the average size of the metal grain. The process generally increases the strength and decreases the ductility of the metal. On the other hand, hot rolling significantly alters the microstructure of the metal such as homogeneity of texture, the size and shape of grains and the concentration of point and line defects (dislocations). Two methods of rolling are distinguished-flat rolling and form rolling. Flat rolling is a process in which a work-piece of constant thickness enters a set of rolls and exit as a product with different constant thickness using flat rolls. Form rolling or shape rolling is a rolling method for products such as I-beam, channels, railroad tracts and large diameter pipes and rods using grooved rolls [3]. For rod rolling, which is the focus of this work, grooved rolls are used. Warm working is deformation carried out at any temperature and strain rate that some amount of strain hardening is always evident [4, 5] or the simultaneous occurrence of deformation and recovery process whereby metals are deformed in their plastic condition by successive passes carried out at temperature above recrystallisation using a rolling mill [6]. The simultaneous deformation and recrystallisation, apart from saving of energy, also results in considerable speeding-up of the process. Rod rolling as a hot working process is the basis of this work using HC SS316 at low strain rates. In general, rolling is a more economical method of deformation than forging if metal is required in long lengths of uniform cross-section [1]. The “phantom roll” concept assumes that the temperature in the surface layer of the slab and in the surface region of the roll are parabolic thus satisfying the heat transfer balance and the heat transfer balance between the slab and the roll. The ratio of surface temperature change of slab and roll is obtained as a function of the thermal properties and the initial surface temperature of the slab and the roll and the instantaneous slab surface temperature [3]. Computer simulation models which predict temperature, load, torque and micro structural changes are very powerful tools as it would be difficult, if not impossible, to obtain these parameters from a few surface measurements. The knowledge of accurate temperature makes it possible to evaluate torque during rolling and micro structural changes [7]. A lot of computer simulation models have been reported in the past in flat rolling, mainly for load calculations to design mills at the maximum energy consumption. Kawai [7] developed a computer simulation model, which predicts temperature and micro structural changes for rod rolling of mild steel and medium carbon steel. Oseghale [8] in his work expanded the ‘phantom roll’ method to take care of load and torque calculations by neglecting the effect of roll flattening or deformation in the near surface region of the rolls. He also, in addition to the assumptions made by Kawai, assumed that a two dimensional deformation of metal (carbon manganese steel) during reduction. 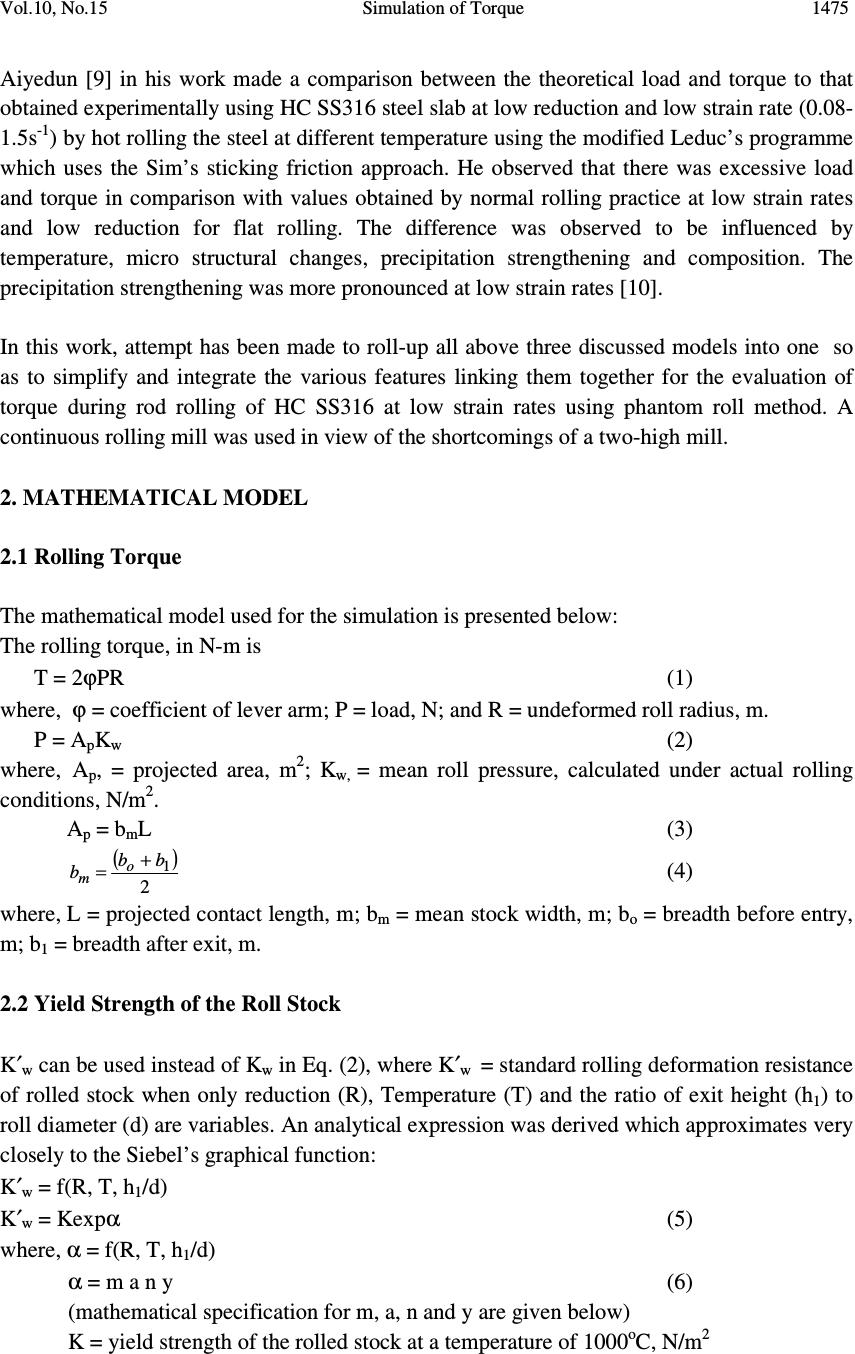 Vol.10, No.15 Simulation of Torque 1475 Aiyedun [9] in his work made a comparison between the theoretical load and torque to that obtained experimentally using HC SS316 steel slab at low reduction and low strain rate (0.08- 1.5s -1 ) by hot rolling the steel at different temperature using the modified Leduc’s programme which uses the Sim’s sticking friction approach. He observed that there was excessive load and torque in comparison with values obtained by normal rolling practice at low strain rates and low reduction for flat rolling. The difference was observed to be influenced by temperature, micro structural changes, precipitation strengthening and composition. The precipitation strengthening was more pronounced at low strain rates [10]. In this work, attempt has been made to roll-up all above three discussed models into one so as to simplify and integrate the various features linking them together for the evaluation of torque during rod rolling of HC SS316 at low strain rates using phantom roll method. A continuous rolling mill was used in view of the shortcomings of a two-high mill. 2. MATHEMATICAL MODEL 2.1 Rolling Torque The mathematical model used for the simulation is presented below: The rolling torque, in N-m is T = 2ϕPR (1) where, ϕ = coefficient of lever arm; P = load, N; and R = undeformed roll radius, m. P = A p K w (2) where, A p , = projected area, m 2 ; K w, = mean roll pressure, calculated under actual rolling conditions, N/m 2 . A p = b m L (3) ( ) 2 1 bb b o m + = (4) where, L = projected contact length, m; b m = mean stock width, m; b o = breadth before entry, m; b 1 = breadth after exit, m. 2.2 Yield Strength of the Roll Stock K′ w can be used instead of K w in Eq. (2), where K′ w = standard rolling deformation resistance of rolled stock when only reduction (R), Temperature (T) and the ratio of exit height (h 1 ) to roll diameter (d) are variables. An analytical expression was derived which approximates very closely to the Siebel’s graphical function: K′ w = f(R, T, h 1 /d) K′ w = Kexpα (5) where, α = f(R, T, h 1 /d) α = m a n y (6) (mathematical specification for m, a, n and y are given below) K = yield strength of the rolled stock at a temperature of 1000 o C, N/m 2 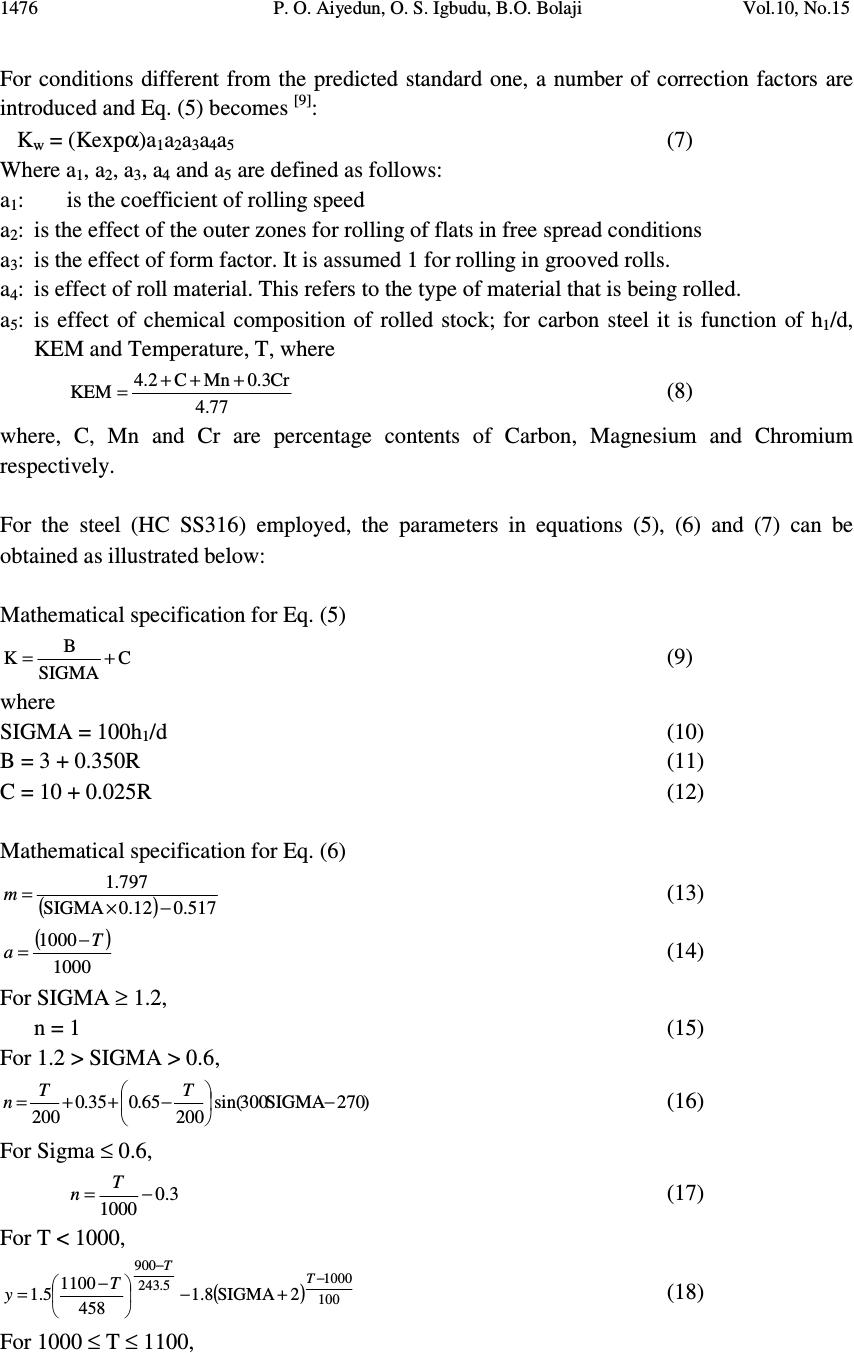 1476 P. O. Aiyedun, O. S. Igbudu, B.O. Bolaji Vol.10, No.15 For conditions different from the predicted standard one, a number of correction factors are introduced and Eq. (5) becomes [9] : K w = (Kexpα)a 1 a 2 a 3 a 4 a 5 (7) Where a 1 , a 2 , a 3 , a 4 and a 5 are defined as follows: a 1 : is the coefficient of rolling speed a 2 : is the effect of the outer zones for rolling of flats in free spread conditions a 3 : is the effect of form factor. It is assumed 1 for rolling in grooved rolls. a 4 : is effect of roll material. This refers to the type of material that is being rolled. a 5 : is effect of chemical composition of rolled stock; for carbon steel it is function of h 1 /d, KEM and Temperature, T, where 77.4 Cr3.0MnC2.4 KEM +++ = (8) where, C, Mn and Cr are percentage contents of Carbon, Magnesium and Chromium respectively. For the steel (HC SS316) employed, the parameters in equations (5), (6) and (7) can be obtained as illustrated below: Mathematical specification for Eq. (5) C SIGMA B K+= (9) where SIGMA = 100h 1 /d (10) B = 3 + 0.350R (11) C = 10 + 0.025R (12) Mathematical specification for Eq. (6) ( ) 517.012.0SIGMA 797.1 −× =m (13) ( ) 1000 1000 T a− = (14) For SIGMA ≥ 1.2, n = 1 (15) For 1.2 > SIGMA > 0.6, )270SIGMA300sin( 200 65.035.0 200 − −++= TT n (16) For Sigma ≤ 0.6, 3.0 1000 −= T n (17) For T < 1000, ( ) 100 1000 5.243 900 2SIGMA8.1 458 1100 5.1 − − +− − = T T T y (18) For 1000 ≤ T ≤ 1100, 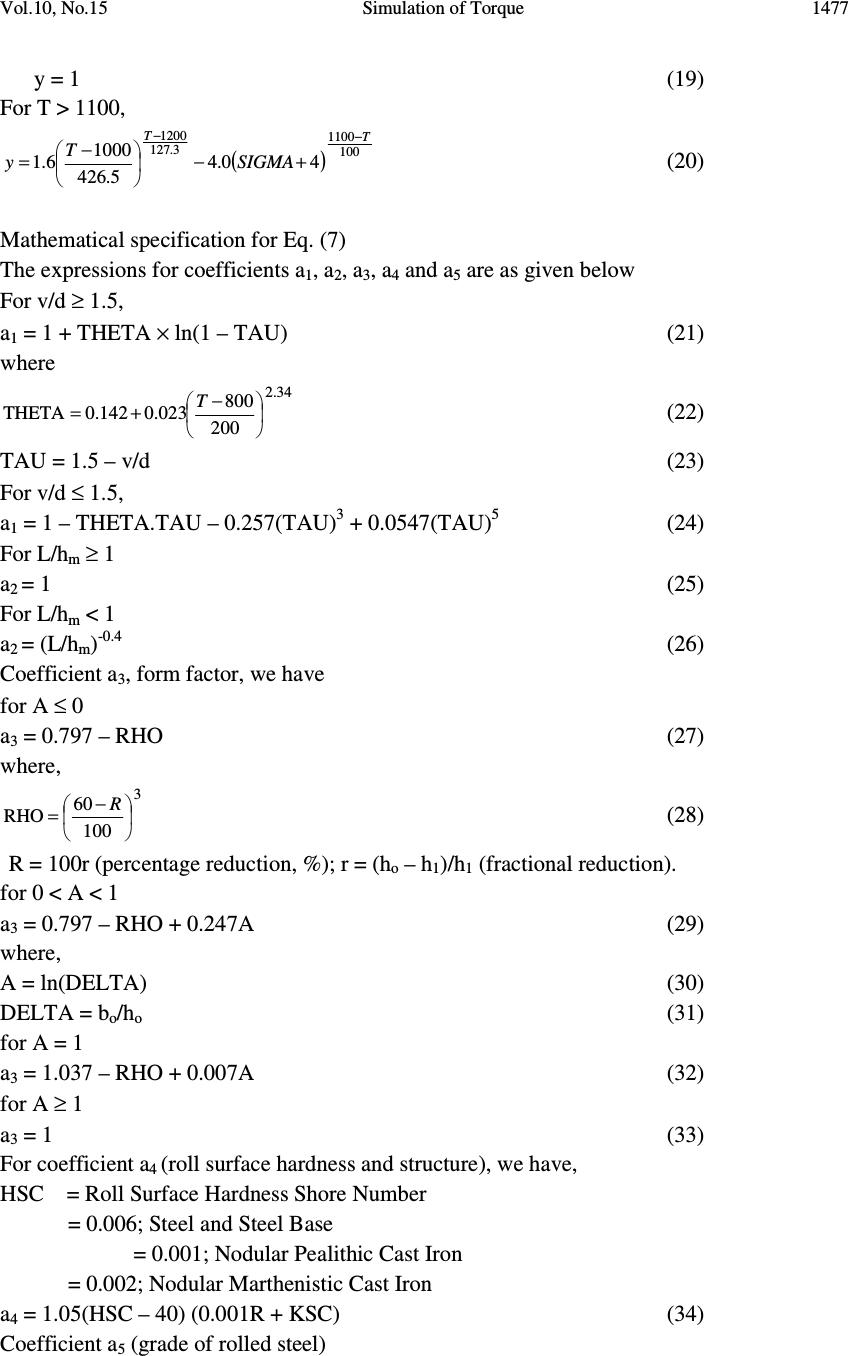 Vol.10, No.15 Simulation of Torque 1477 y = 1 (19) For T > 1100, ( ) 100 1100 3.127 1200 40.4 5.4 26 1000 6.1 T T SIGMA T y − − +− − = (20) Mathematical specification for Eq. (7) The expressions for coefficients a 1 , a 2 , a 3 , a 4 and a 5 are as given below For v/d ≥ 1.5, a 1 = 1 + THETA × ln(1 – TAU) (21) where 34.2 200 800 023.0142.0THETA − +=T (22) TAU = 1.5 – v/d (23) For v/d ≤ 1.5, a 1 = 1 – THETA.TAU – 0.257(TAU) 3 + 0.0547(TAU) 5 (24) For L/h m ≥ 1 a 2 = 1 (25) For L/h m < 1 a 2 = (L/h m ) -0.4 (26) Coefficient a 3 , form factor, we have for A ≤ 0 a 3 = 0.797 – RHO (27) where, 3 100 60 RHO − =R (28) R = 100r (percentage reduction, %); r = (h o – h 1 )/h 1 (fractional reduction). for 0 < A < 1 a 3 = 0.797 – RHO + 0.247A (29) where, A = ln(DELTA) (30) DELTA = b o /h o (31) for A = 1 a 3 = 1.037 – RHO + 0.007A (32) for A ≥ 1 a 3 = 1 (33) For coefficient a 4 (roll surface hardness and structure), we have, HSC = Roll Surface Hardness Shore Number = 0.006; Steel and Steel Base = 0.001; Nodular Pealithic Cast Iron = 0.002; Nodular Marthenistic Cast Iron a 4 = 1.05(HSC – 40) (0.001R + KSC) (34) Coefficient a 5 (grade of rolled steel) 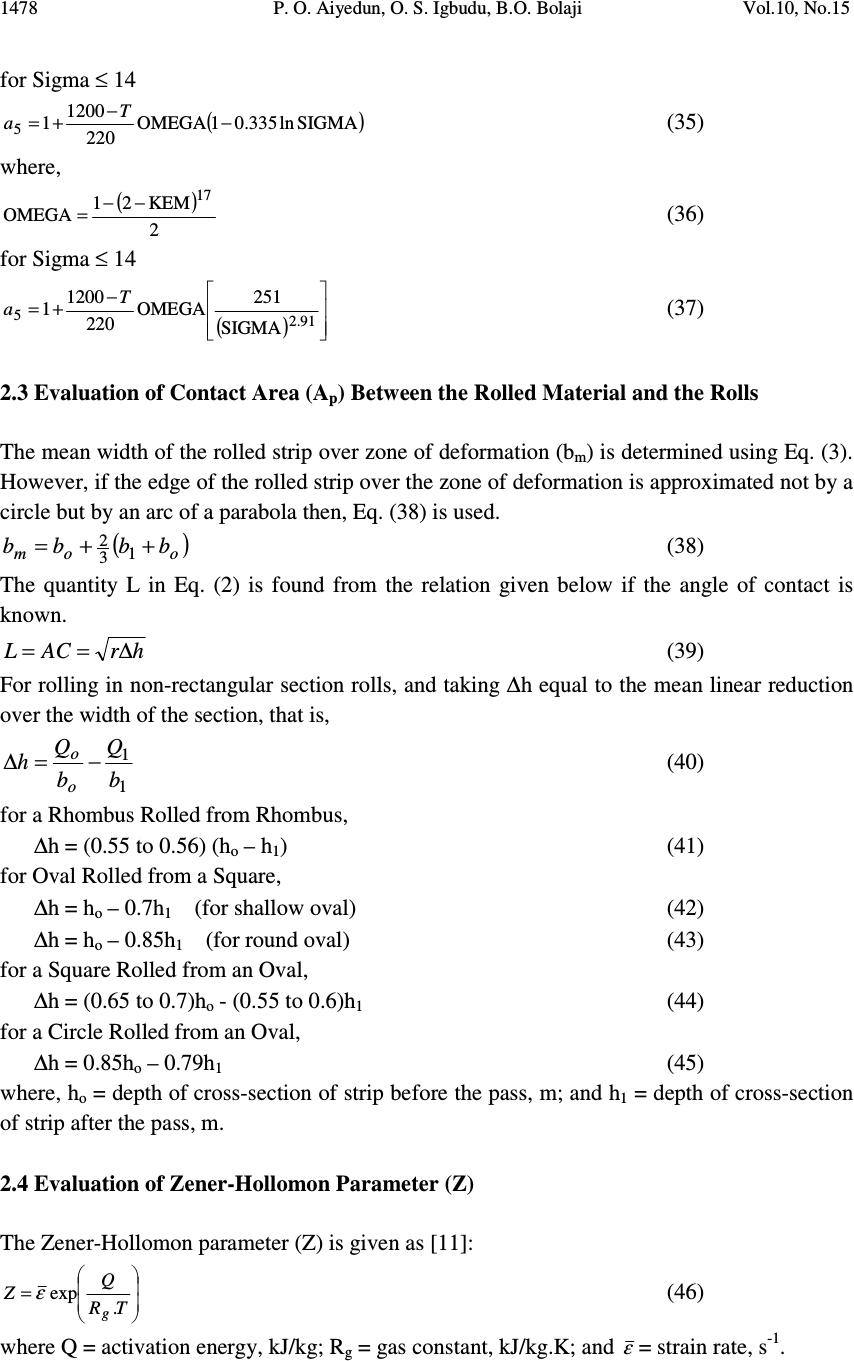 1478 P. O. Aiyedun, O. S. Igbudu, B.O. Bolaji Vol.10, No.15 for Sigma ≤ 14 ( ) SIGMAln335.01OMEGA 220 1200 1 5 − − += T a (35) where, ( ) 2 KEM21 OMEGA 17 −− = (36) for Sigma ≤ 14 ( ) − += 91.2 5 SIGMA 251 OMEGA 220 1200 1T a (37) 2.3 Evaluation of Contact Area (A p ) Between the Rolled Material and the Rolls The mean width of the rolled strip over zone of deformation (b m ) is determined using Eq. (3). However, if the edge of the rolled strip over the zone of deformation is approximated not by a circle but by an arc of a parabola then, Eq. (38) is used. ( ) oom bbbb ++= 1 3 2 (38) The quantity L in Eq. (2) is found from the relation given below if the angle of contact is known. hrACL ∆== (39) For rolling in non-rectangular section rolls, and taking ∆h equal to the mean linear reduction over the width of the section, that is, 1 1 b Q b Q h o o −=∆ (40) for a Rhombus Rolled from Rhombus, ∆h = (0.55 to 0.56) (h o – h 1 ) (41) for Oval Rolled from a Square, ∆h = h o – 0.7h 1 (for shallow oval) (42) ∆h = h o – 0.85h 1 (for round oval) (43) for a Square Rolled from an Oval, ∆h = (0.65 to 0.7)h o - (0.55 to 0.6)h 1 (44) for a Circle Rolled from an Oval, ∆h = 0.85h o – 0.79h 1 (45) where, h o = depth of cross-section of strip before the pass, m; and h 1 = depth of cross-section of strip after the pass, m. 2.4 Evaluation of Zener-Hollomon Parameter (Z) The Zener-Hollomon parameter (Z) is given as [11]: =TR Q Z g . exp ε (46) where Q = activation energy, kJ/kg; R g = gas constant, kJ/kg.K; and ε = strain rate, s -1 .  Vol.10, No.15 Simulation of Torque 1479 The strain rate is obtained using Eq. (47) [3] : ==∫ L d E 0 )(ln 1 ln εεεε (47) the approximate mean rolling strain rate ε is given by Eq. (48) [3] : 45.0 2 1 25.0 21 ln 08.1 ∆ ∆ =h h hh h hR V ε (48) 2.5 Calculation of Graph Equations Torque (T r ) =C log 10 Z + D (49) where C and D are constants which were obtained from curve fitting of torque versus log 10 Z. 2.6 Simulation of the Model In the simulation of the model, conditions and input data similar to those Aiyedun et al. [12] were assumed for this work. A 125 × 125 mm 2 stainless steel (HCSS 316) square billet was used as the starting material for rolling to a 16 mm diameter rod using 17 sequential passes at low strain rates, the following assumptions made were: Roll cooling systems were neglected; Air cooling condition was taken to be the same as in the laboratory although a lower cooling rate is probable due to the obstruction of the radiation by the trough between stands; The roll radii for flat and grooved roll were taken to be 140 mm and 254 mm respectively; One dimensional heat flow within the material and heat flows from the center to the surface; The value of the activation energy (Q) of deformation for HC SS 316 was taken to be 460kJ/kg, [9] ; Heat gain due to deformation is equally distributed to each element and for every time interval during rolling; Heat loss is caused by radiation and convection during air-cooling and by conduction during rolling; and A ‘phantom roll’ method was used. The ‘phantom roll’ method makes it possible to save the computer calculation in the roll by assuming a parabolic temperature distribution [3, 8] . 3. RESULTS DISCUSSION The simulation was carried out starting with four different mean temperatures of 988 0 C, 1094 0 C, 1095 0 C and 1191 0 C and starting strain rates of 0.4 s -1 , 0.8 s -1 , 1.2 s -1 and 1.6 s -1 , respectively for seventeen sequential passes in a continuous rolling mill. The input data were based on those of Aiyedun et al. [12]. Figs. 1 to 4 show the plots of torque against temperature for both flat rolls and grooved rolls for strain rates of 0.4 s -1 and 1.6 s -1 , the points were fitted with curves for all starting temperatures.  1480 P. O. Aiyedun, O. S. Igbudu, B.O. Bolaji Vol.10, No.15 0 400 800 1200 85090095010001050 1100 1150 1200 Temperature ( o C) Torque (kN.m) 988 degree celcius 1094 degree celcius 1095 degree celcius 1191 degree celcius Fig. 1: Plot of torque versus temperature for rolling using flat rolls at initial starting strain of 0.4 s -1 for four mean temperatures 0 400 800 1200 1600 2000 2400 8509009501000 1050 11001150 1200 Temperature ( o C) Torque (kN.m) 988 degree celcius 1094 degree celcius 1095 degree celcius 1191 degree celcius Fig. 2: Plot of torque versus temperature for rolling using grooved rolls at initial starting strain of 0.4 s -1 for four mean temperatures  Vol.10, No.15 Simulation of Torque 1481 0 400 800 1200 85090095010001050 11001150 1200 Temperature (oC) Torque (kN.m) 988 degree celcius 1094 degree celcius 1095 degree celcius 1191 degree celcius Fig. 3: Plot of torque versus temperature for rolling using flat rolls at initial starting strain of 1.6 s -1 for four mean temperatures 0 400 800 12 00 16 00 85090095010001050 11001150 1200 Temperature (oC) Torque (kN.m) 988 degree celcius 1094 degree celcius 1095 degree celcius 1191 degree celcius Fig. 4: Plot of torque versus temperature for rolling using grooved rolls at initial starting strain of 1.6 s -1 for four mean temperatures As shown in these figures, it was observed that for grooved rolls, torque values were larger than for flat rolls; this translates into more power dissipation with grooved rolls. The higher values encountered are possibly due to the following reasons:  1482 P. O. Aiyedun, O. S. Igbudu, B.O. Bolaji Vol.10, No.15 For rolling in grooved rolls, the area of contact between roll and stock increases towards exit and not constant as in flat rolls. Since torque is a function of contact area, this could account for the difference. Friction effect due to the side wall of grooved rolls is greater because of the greater contact area. The plot of torque against temperature, hyperbolic curves were obtained both for flat and grooved rolling (Figs. 1 to 4). Towards the end of rolling, the increase in temperature did not produce a corresponding increase in torque thus explaining the conic shape of the curves. Further investigation of the combined effects of temperature and strain rate on torque was carried out by calculating the Zener-Hollomon parameter (Z), which combined these effects. Plots of torque against log 10 (Z) are shown in Figs. 5 and 6 for strain rates of 0.8 and 1.6 s -1 , respectively. Points were fitted with straight lines for both flat and grooved rolls. An inverse relationship exists between log 10 (Z) and torque. A peculiar variation was observed for the highest temperature (1191 o C). This trend was general for the various strain rates and rolls (Figs. 5 and 6). 0 4 0 0 8 0 0 120 0 160 0 200 0 18 2022 2426 28 Log 10 (Z) Torque (kN.m) Flat rolls at 1095 degree celcius Grooved rolls at 1095 degree celcius Flat rolls at 1191 degree celcius Grooved rolls at 1191 degree celcius Fig. 5: Plot of torque versus log 10 (Z) for seventeen passes for starting temperatures of 1095 and 1191 0 C, and strain of 0.8s -1 using flat and grooved rolls  Vol.10, No.15 Simulation of Torque 1483 0 4 0 0 8 0 0 120 0 160 0 18 20 2224 26 28 Log 10 (Z) Torque (kN.m) Flat rolls at 1095 degree celcius Grooved rolls at 1095 degree celcius Flat rolls at 1191 degree celcius Grooved rolls at 1191 degree celcius Fig. 6: Plot of torque versus log 10 (Z) for seventeen passes for starting temperatures of 1095 and 1191 0 C, and strain of 1.6s -1 using flat and grooved rolls This abnormal behaviour could be that recrystallization and hence recovery never fully taking place during rolling at this temperature thereby resulting in strain localization. The plot of torque against strain rate for flat roll at various rolling temperatures is shown in Fig. 7. 0 200 400 600 800 1000 020 406080 Strain (s -1 ) Torque (kN.m) 988 degree celcius 1094 degree celcius 1095 degree celcius 1191 degree celcius Fig. 7: Plot of torque versus strain rate for rolling in flat rolls at starting temperatures of 988, 1094, 1095 and 1191 0 C  1484 P. O. Aiyedun, O. S. Igbudu, B.O. Bolaji Vol.10, No.15 The figure shows a gradually decreasing torque as strain rate increases; this also applies to grooved rolls (Fig. 8). This indicates an inverse relation between strain rate and torque. 0 400 800 1200 1600 0510 1520 2530 35 Strain (s -1 ) Torque (kN.m) 988 degree celcius 1094 degree celcius 1095 degree celcius 1191 degree celcius Fig. 8: Plot of torque versus strain rate for rolling in grooved rolls at starting temperatures of 988, 1094, 1095 and 1191 0 C 4. CONCLUSION Torque plays a very significant roll during rolling operation. Therefore, there is the need to minimize them so as to reduce both cost and weight, which ultimately translates into low energy dissipation and consumption. It was observed that: 1. Increasing strain rate and temperature lead to a decrease in torque values; 2. Larger contact area between roll and stock and additional frictional effect due to side walls of roll lead to increased torque requirements for grooved rolls when compared to flat roll; 3. In view of 2 above, rolling in grooved rolls requires more power than for flat rolls; 4. Hyperbolic curves were obtained in the Variation of torque with temperature for both flat and grooved rolling. The increase in temperature towards the end of rolling did not produce a corresponding increase in torque thus explaining the hyperbolic shape of the curves; 5. Further investigation of the combined effects of temperature and strain rate on torque using Zener-Hollomon parameter (Z) shows inverse relationship between log 10 (Z) and torque. Peculiar variation was also observed for the highest temperature (1191 o C), which was general for the various strain rates and rolls. This abnormal behaviour could be that recrystallization and hence recovery never fully taking place during rolling at this temperature thereby resulting in strain localization; 6. An inverse relationship exists between strain rate and torque.  Vol.10, No.15 Simulation of Torque 1485 REFERENCES [1] A.G. Antonio and R.V. Renato, The Effect of Finishing Temperature and Cooling Rate on the Microstructure and Mechanical Properties of As-Hot Rolled Dual Phase Steel, Antonio Augusto Gorni, 1996, Home page, http://www.Geocities.com. [2] P.J. Schaffer, A. Sexana, D.S. Antolovich, T.H. Sanders and B.S. Warner, Science and Design of Engineering Materials, 2nd ed., McGraw-Hill Company Inc., New York, 1999. [3] P.O. Aiyedun, O.S. Igbudu and B.O. Bolaji, Simulation of Load during Rod Rolling of HCSS316 at Low Strain Rate, Proceedings of 2nd International Conference on Engineering Research and Development: Innovation, April 15-17, 2008 (Nigeria), University of Benin, Benin City, Nigeria, 2008, p 422-430. [4] S. Venkadesan, P. Sivaprasad, S. Venugopal and V. Seetharaman, Tensile Deformation Behaviour of Warm-Rolled Type 316 Austenitic Stainless Steel, Journal of Mechanical Working Technology, 12, 1986, p 351-354. [5] E.C. Rollason, Metallurgy for Engineers 4th ed., Edward Anorld, New York, 1992. [6] H. Qamark, G.W. Buckley and M. Lewis, Computer Programmed Speed Roll-Torque Data Calculation, Journal of Iron and Steel International, 53, 1980, p 29-37. [7] R. Kawai, “Simulation of Rod Rolling of Carbon-Manganese Steel,” M.Phil. Thesis, University of Sheffield, UK, 1985. [8] L.E. Oseghale, “Simulation of Load and Torque During Rod Rolling Using the ‘Phanthom Roll’ Method,” M.Sc. Thesis, Univesity of Ibadan, Nigeria, 1998. [9] P.O. Aiyedun, “A study of loads and torque for light reduction in hot flat rolling at low strain rates,” Ph.D. Thesis, University of Sheffield, UK, 1984. [10] R.W.K. Honey-Combe, The Plastic Deformation of Metals, 2nd ed., Anorld, New York, 1983. [11] O.J. Alamu and M.O. Durowoju, Evaluation of Zener-Hollomon parameter variation with pass reduction in hot steel rolling, International Journal of Environmental Issues, 1, 2003, p 148-159. [12] P.O. Aiyedun, L.E. Oseghale and O.J. Alamu, Simulation of Load Bearing Rod Rolling of Carbon-Manganese Steel Using the “Phantom Roll” Method, Pacific Journal of Science and Technology, 10, 2009, p 4-14. |