Paper Menu >>
Journal Menu >>
 Journal of Minerals & Materials Characterization & Engineering, Vol. 10, No.15, pp.1457-1472, 2011 jmmce.org Printed in the USA. All rights reserved 1457 Comparative Study of the Kinetics of Dissolution of Laterite in some Acidic Media Olushola S. AYANDA 1* , Folahan A. ADEKOLA 2 , Alafara A. BABA 2 , Olalekan S. FATOKI 1 and Bhekumusa J. XIMBA 1 1 Department of Chemistry, Faculty of Applied Sciences, Cape Peninsula University of Technology, P.O. Box 652, Cape Town, South Africa. 2 Department of Chemistry, University of Ilorin, P.M.B 1515, Ilorin, Nigeria. * Corresponding author: osayanda@gmail.com ABSTRACT Studies on the kinetics of dissolution of a Nigerian lateritic soil in acids media including hydrochloric, nitric and sulphuric acids have been undertaken. The elemental and mineralogical characterization, loss of mass on ignition, moisture content and pH of the material suspension in water were determined. The effects of acid concentration, process temperature, stirring rate and particle size on the dissolution rate were investigated. Experimental results indicated that laterite dissolution was greatly influenced by hydrogen ion concentration and the leaching data fitted a diffusion model. The linear dependence of the rate constant k on 1/r o2 supported the proposed kinetic model. Values of 60.23 kJmol -1 , 64.31 kJmol -1 and 67.53 kJmol -1 were obtained for the activation energies of laterite dissolution in hydrochloric, nitric and sulphuric acids respectively; and the order of reaction was approximately one with respect to each of the three acids. Keywords: Lateritic soil, Dissolution kinetics, Hydrochloric acid, Nitric acid, Sulphuric acid. 1. INTRODUCTION Laterite is a soil formed in hot and wet tropical area that is enriched in iron and aluminium by intensive and long lasting weathering of the underlying parent rock. The percolation of rainwater causes dissolution of primary rock minerals leading to a decrease in sodium, potassium, calcium, magnesium and silicon, giving rise to a residual concentration of more insoluble elements predominantly iron and aluminium [1]. Laterites are generally a mixture of minerals such as kaolinite, goethite, hematite and gibbsite formed in the course of weathering [2]. The presence of goethite and hematite causes the red- brown colouration of laterites. In Nigeria, laterite is found in large proportion across the country.  1458 Olushola S. AYANDA, Folahan A. ADEKOLA Vol.10, No.15 Laterite finds its applications in building houses and road construction. Solid lateritic gravel is also used in aquaria where it favours the growth of tropical plants. Intensive laterization results in the formation of aluminium-rich laterite (Bauxite) and laterization of igneous rocks often results in a considerable nickel and cobalt concentration [1, 3, 4]. Cobalt and nickel have found numerous applications in chemical and manufacturing industries. The strategic nature of cobalt has made it imperative to search for cobalt-enriched laterites, which constitutes one of its primary sources. As there is no comprehensive study on kinetic dissolution of laterites in Nigeria, except the one reported by Olanipekun (2000) [5] on the dissolution of laterite in HCl medium. The present study represents a more comprehensive study on a Nigerian laterite. The present investigation was therefore aimed at establishing the conditions for the leaching of a Nigerian lateritic soil in hydrochloric, nitric and sulphuric acids, followed by a comparative analysis of the kinetic data. 2. EXPERIMENTALS 2.1 Material Lateritic soil used for this study was collected from a mining site in Ilorin, Nigeria. Elemental analysis and mineralogical characterization were respectively carried out by X-ray fluorescence model 12045B4/3 and Philips PW1800 X-ray diffractometer, with CuK α (1.54 Å) radiation generated at 40 kV and 55 mA. All reagents used were of analar grade and were all products of BDH. Doubly distilled water was used for all the analytical preparations. 2.2 Physico-chemical Characterization 2.2.1 Loss of mass on ignition The loss of mass on ignition was carried out gravimetrically at 600 °C using ASTM method until a constant weight was obtained. The process was carried out in triplicate. 2.2.2 Moisture content determination The moisture content determination was carried out gravimetrically by heating 1.0 g of laterite in the oven at temperature of 105 ºC for 5 hours. 2.2.3 pH determination The pH of 10.0 g suspension of laterite in 30 ml distilled water was measured by the use of a pHep ® HANNA pH meter. The measurement was monitored daily for two weeks.  Vol.10, No.15 Comparative Study of the Kinetics 1459 2.3 Leaching Procedure 1.0 g of laterite sample of < 0.2 mm particle size was put into a 100 ml of 0.5 M acid (HCl, HNO 3 and H 2 SO 4 ). The magnetic stirrer was introduced and the solution mixture heated at temperature of 55 ºC and stirred at a rate of 200 rpm for a particular contact time. At the end of the contact time and for each concentration of the leachant, the solution obtained was filtered and the insoluble residue left in the filter paper was washed thoroughly with distilled water. The residue in the filter paper was oven-dried at about 60 o C and was reweighed. The difference in the amount of the laterite left from the original mass was then noted. This was then used to determine the percentage of the laterite dissolved in the leachant [6, 7, 8]. The same procedure was repeated for other acids concentrations: 1.0 M, 2.0 M, 4.0 M and 8.0 M. Each concentration of acid was contacted with 1.0 g of laterite for 5, 10, 30, 60 and 120 mins. A controlled experiment was carried out using doubly distilled water, so as to determine the percentage of laterite released/soluble in ordinary distilled water. All leaching data were subsequently corrected by subtracting the amount dissolved in ordinary water from the corresponding data obtained for various acids concentrations. The concentration which gave the highest percentage of dissolution was used for optimization of other parameters including temperature, particle size and stirring rate. The activation energy and the orders of reactions were finally calculated from the Arrhenius plots for the three acids. 3. RESULTS AND DISCUSSION 3.1 Physico-chemical Characterization 3.1.1 Loss of mass on ignition and moisture content The average percentage loss of mass on ignition of laterite ore was 21.83 % ± 0.02. The loss of mass could be accounted for by the presence of organic/decayed substances in the laterite. The moisture content of the laterite was 9.1 % ± 0.004. 3.1.2 pH determination The pH of the laterite-water suspension was 8.5. This value suggests that the surface of laterite is basic. This is in support of the predominant chemical form of laterite, which is oxide. 3.1.3 XRF analysis The results of XRF analysis shown in Table 1 indicate that the various elements present in laterite exist mainly as oxides. The results also showed that the laterite consists majorly of iron oxide, followed by the oxides of calcium, potassium, titanium, nickel, cobalt, copper, zinc, manganese and zirconium in decreasing order of concentration. 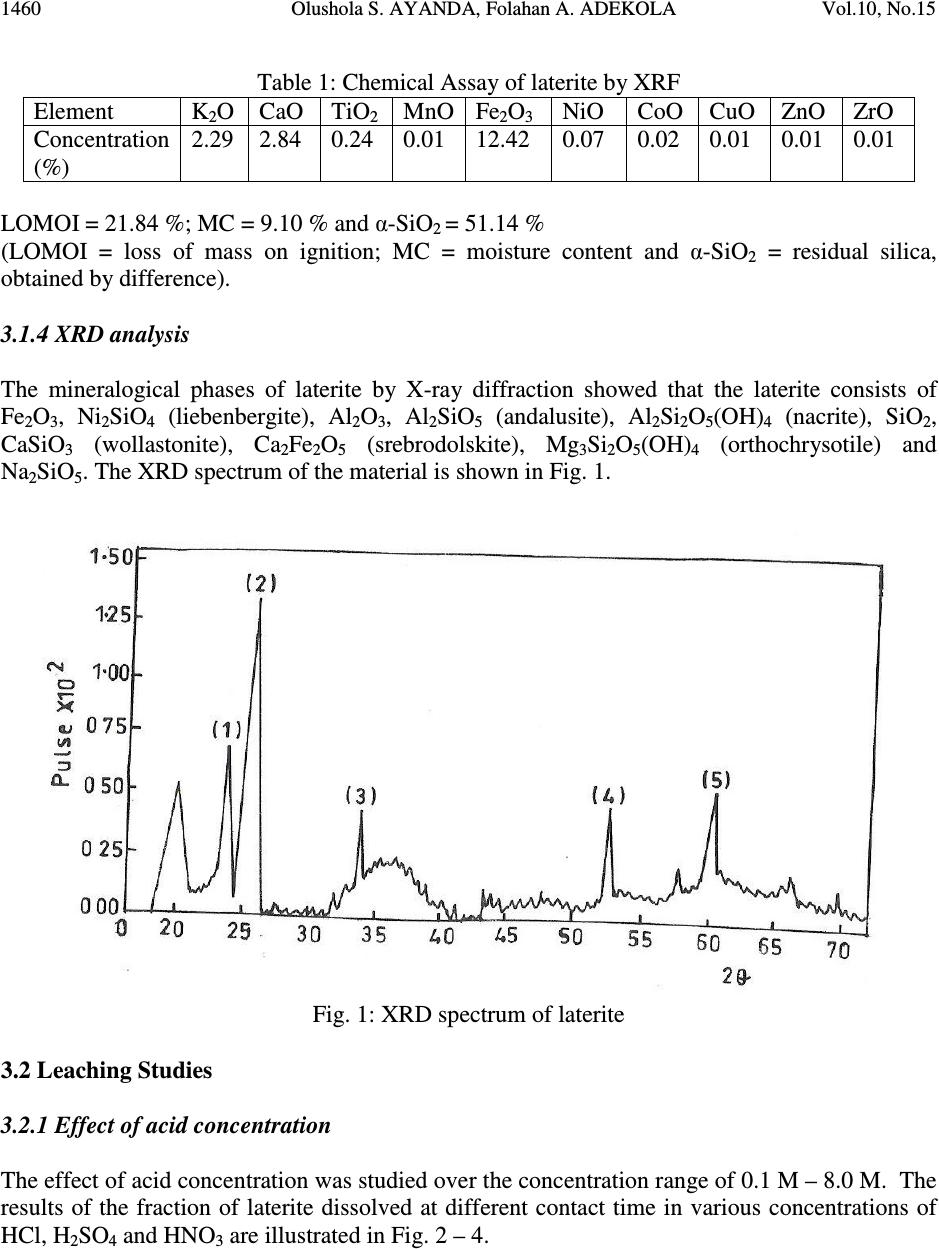 1460 Olushola S. AYANDA, Folahan A. ADEKOLA Vol.10, No.15 Table 1: Chemical Assay of laterite by XRF Element K 2 O CaO TiO 2 MnO Fe 2 O 3 NiO CoO CuO ZnO ZrO Concentration (%) 2.29 2.84 0.24 0.01 12.42 0.07 0.02 0.01 0.01 0.01 LOMOI = 21.84 %; MC = 9.10 % and α-SiO 2 = 51.14 % (LOMOI = loss of mass on ignition; MC = moisture content and α-SiO 2 = residual silica, obtained by difference). 3.1.4 XRD analysis The mineralogical phases of laterite by X-ray diffraction showed that the laterite consists of Fe 2 O 3 , Ni 2 SiO 4 (liebenbergite), Al 2 O 3 , Al 2 SiO 5 (andalusite), Al 2 Si 2 O 5 (OH) 4 (nacrite), SiO 2 , CaSiO 3 (wollastonite), Ca 2 Fe 2 O 5 (srebrodolskite), Mg 3 Si 2 O 5 (OH) 4 (orthochrysotile) and Na 2 SiO 5 . The XRD spectrum of the material is shown in Fig. 1. Fig. 1: XRD spectrum of laterite 3.2 Leaching Studies 3.2.1 Effect of acid concentration The effect of acid concentration was studied over the concentration range of 0.1 M – 8.0 M. The results of the fraction of laterite dissolved at different contact time in various concentrations of HCl, H 2 SO 4 and HNO 3 are illustrated in Fig. 2 – 4. 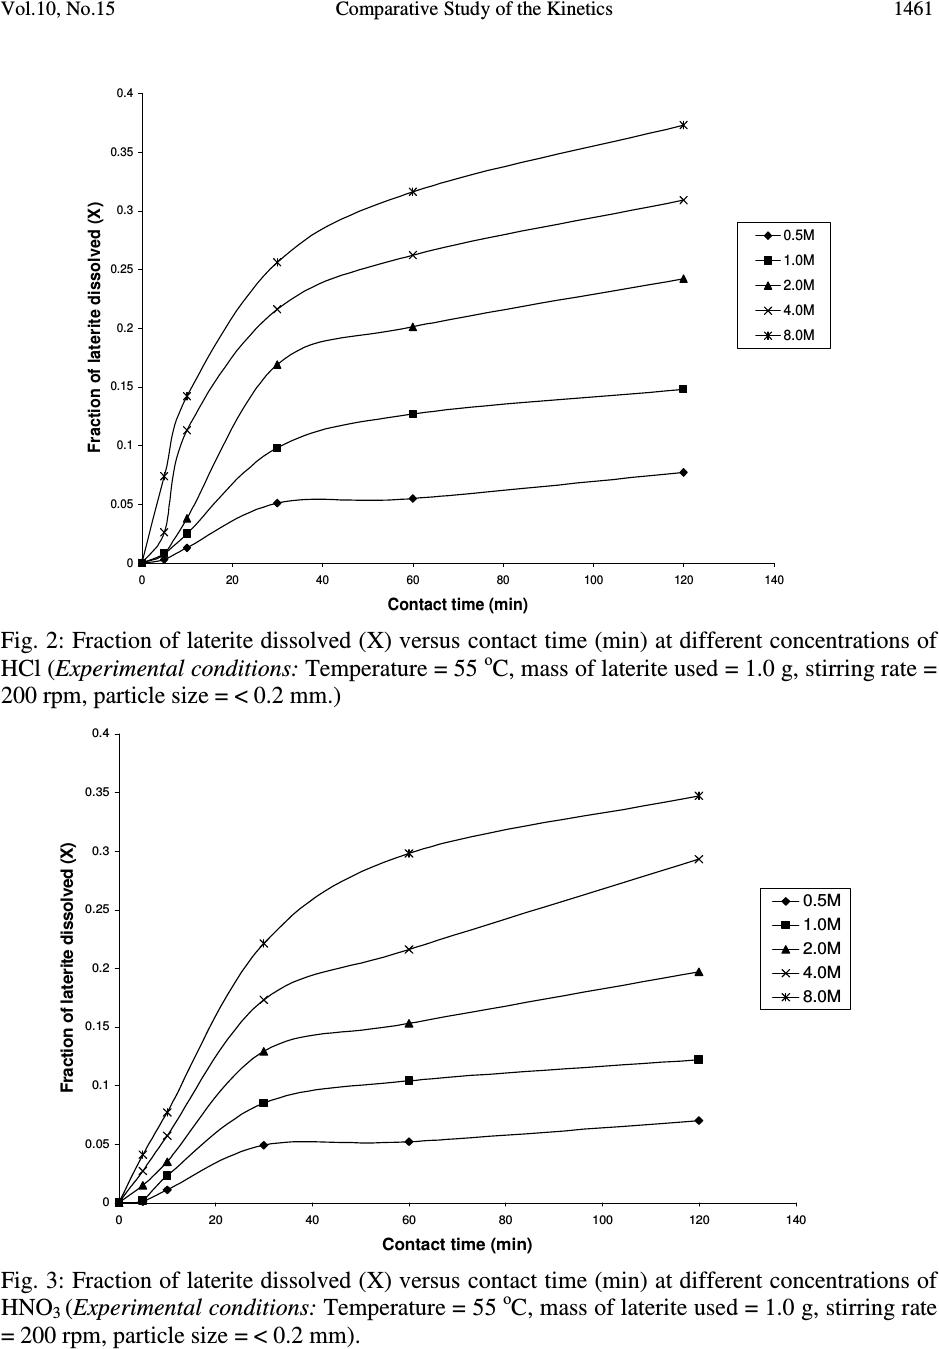 Vol.10, No.15 Comparative Study of the Kinetics 1461 0 0.05 0.1 0.15 0.2 0.25 0.3 0.35 0.4 020406080100 120 140 Contact time (min) Fraction of laterite dissolved (X) 0.5M 1.0M 2.0M 4.0M 8.0M Fig. 2: Fraction of laterite dissolved (X) versus contact time (min) at different concentrations of HCl (Experimental conditions: Temperature = 55 o C, mass of laterite used = 1.0 g, stirring rate = 200 rpm, particle size = < 0.2 mm.) 0 0.05 0.1 0.15 0.2 0.25 0.3 0.35 0.4 020406080100 120 140 Contact time (min) Fraction of laterite dissolved (X) 0.5M 1.0M 2.0M 4.0M 8.0M Fig. 3: Fraction of laterite dissolved (X) versus contact time (min) at different concentrations of HNO 3 (Experimental conditions: Temperature = 55 o C, mass of laterite used = 1.0 g, stirring rate = 200 rpm, particle size = < 0.2 mm). 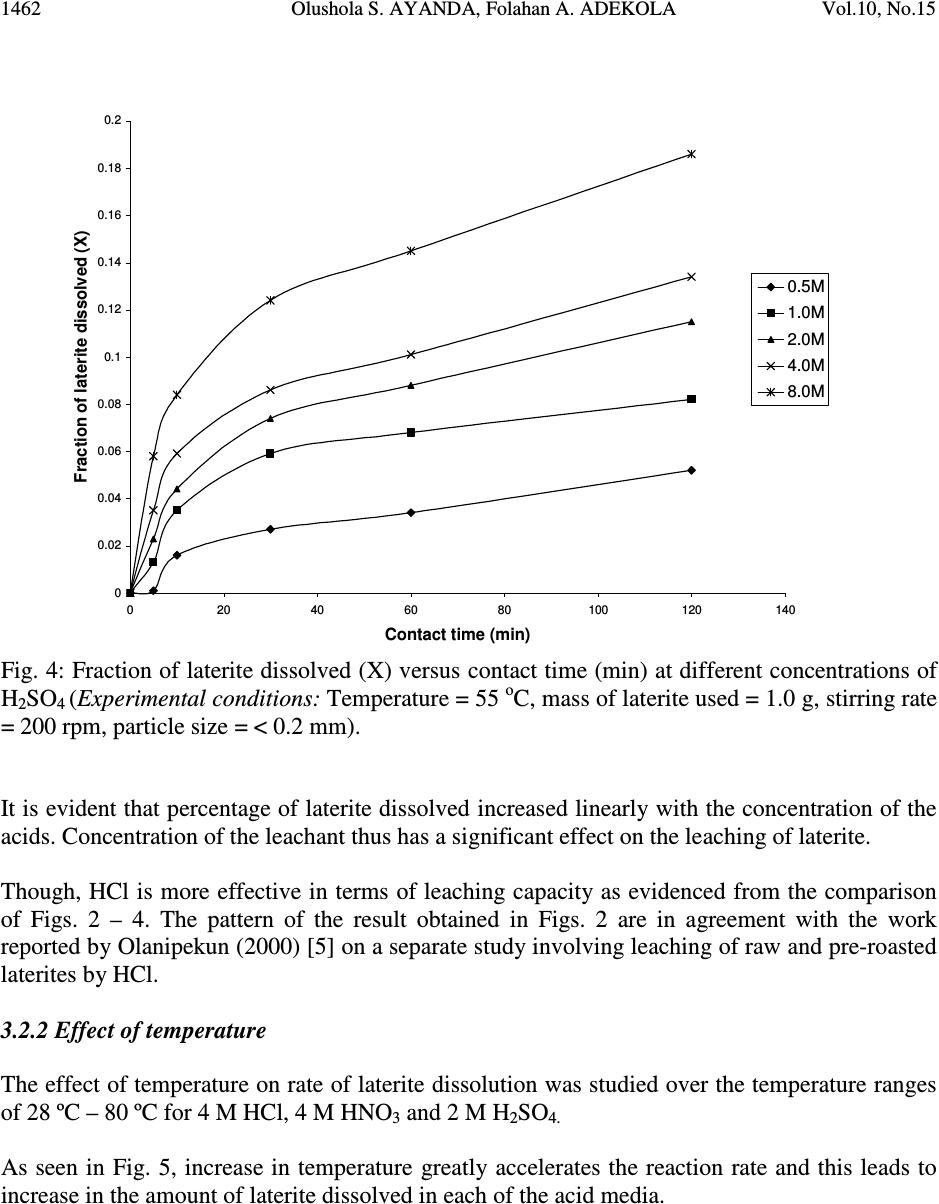 1462 Olushola S. AYANDA, Folahan A. ADEKOLA Vol.10, No.15 0 0.02 0.04 0.06 0.08 0.1 0.12 0.14 0.16 0.18 0.2 020406080100 120140 Contact time (min) Fraction of laterite dissolved (X) 0.5M 1.0M 2.0M 4.0M 8.0M Fig. 4: Fraction of laterite dissolved (X) versus contact time (min) at different concentrations of H 2 SO 4 (Experimental conditions: Temperature = 55 o C, mass of laterite used = 1.0 g, stirring rate = 200 rpm, particle size = < 0.2 mm). It is evident that percentage of laterite dissolved increased linearly with the concentration of the acids. Concentration of the leachant thus has a significant effect on the leaching of laterite. Though, HCl is more effective in terms of leaching capacity as evidenced from the comparison of Figs. 2 – 4. The pattern of the result obtained in Figs. 2 are in agreement with the work reported by Olanipekun (2000) [5] on a separate study involving leaching of raw and pre-roasted laterites by HCl. 3.2.2 Effect of temperature The effect of temperature on rate of laterite dissolution was studied over the temperature ranges of 28 ºC – 80 ºC for 4 M HCl, 4 M HNO 3 and 2 M H 2 SO 4. As seen in Fig. 5, increase in temperature greatly accelerates the reaction rate and this leads to increase in the amount of laterite dissolved in each of the acid media. 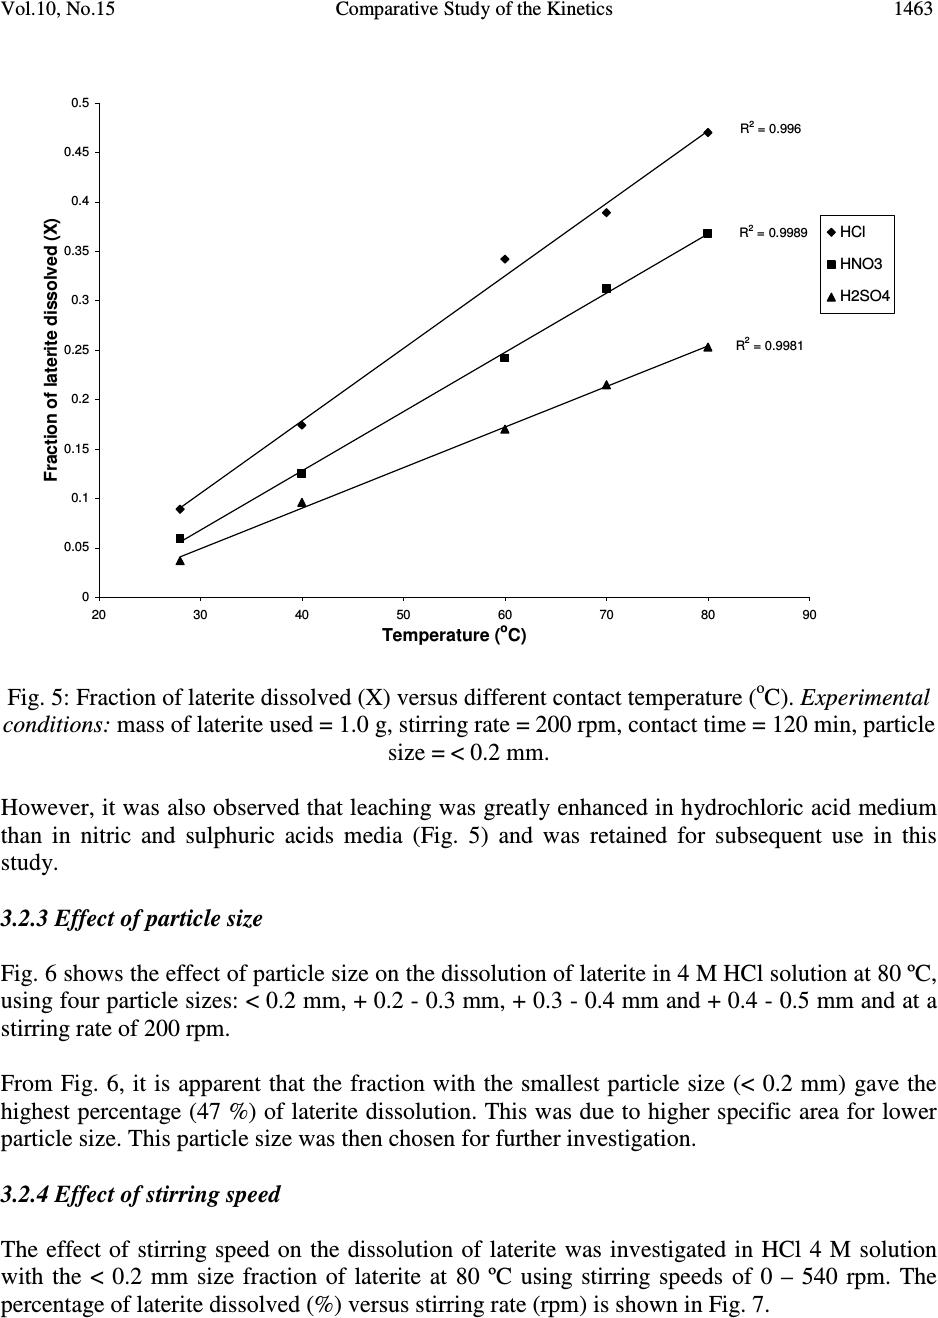 Vol.10, No.15 Comparative Study of the Kinetics 1463 R 2 = 0.996 R 2 = 0.9989 R 2 = 0.9981 0 0.05 0.1 0.15 0.2 0.25 0.3 0.35 0.4 0.45 0.5 20 30 40 50 60 70 80 90 Temperature ( o C) Fraction of laterite dissolved (X) HCl HNO3 H2SO4 Fig. 5: Fraction of laterite dissolved (X) versus different contact temperature ( o C). Experimental conditions: mass of laterite used = 1.0 g, stirring rate = 200 rpm, contact time = 120 min, particle size = < 0.2 mm. However, it was also observed that leaching was greatly enhanced in hydrochloric acid medium than in nitric and sulphuric acids media (Fig. 5) and was retained for subsequent use in this study. 3.2.3 Effect of particle size Fig. 6 shows the effect of particle size on the dissolution of laterite in 4 M HCl solution at 80 ºC, using four particle sizes: < 0.2 mm, + 0.2 - 0.3 mm, + 0.3 - 0.4 mm and + 0.4 - 0.5 mm and at a stirring rate of 200 rpm. From Fig. 6, it is apparent that the fraction with the smallest particle size (< 0.2 mm) gave the highest percentage (47 %) of laterite dissolution. This was due to higher specific area for lower particle size. This particle size was then chosen for further investigation. 3.2.4 Effect of stirring speed The effect of stirring speed on the dissolution of laterite was investigated in HCl 4 M solution with the < 0.2 mm size fraction of laterite at 80 ºC using stirring speeds of 0 – 540 rpm. The percentage of laterite dissolved (%) versus stirring rate (rpm) is shown in Fig. 7. 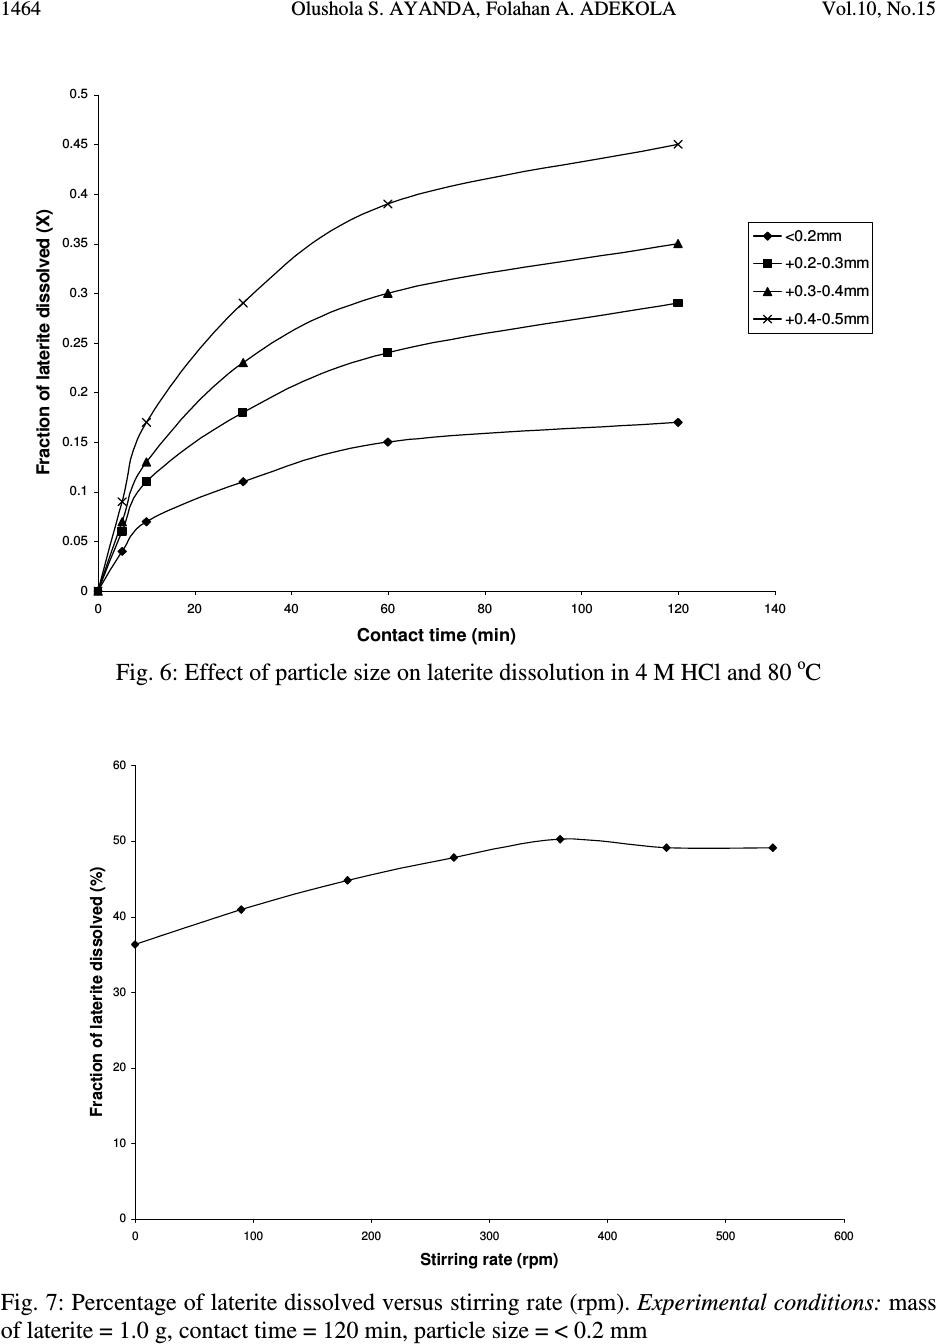 1464 Olushola S. AYANDA, Folahan A. ADEKOLA Vol.10, No.15 0 0.05 0.1 0.15 0.2 0.25 0.3 0.35 0.4 0.45 0.5 020406080100 120 140 Contact time (min) Fraction of laterite dissolved (X) <0.2mm +0.2-0.3mm +0.3-0.4mm +0.4-0.5mm Fig. 6: Effect of particle size on laterite dissolution in 4 M HCl and 80 o C 0 10 20 30 40 50 60 0100 200 300 400 500 600 Stirring rate (rpm) Fraction of laterite dissolved (%) Fig. 7: Percentage of laterite dissolved versus stirring rate (rpm). Experimental conditions: mass of laterite = 1.0 g, contact time = 120 min, particle size = < 0.2 mm  Vol.10, No.15 Comparative Study of the Kinetics 1465 It was clear from Fig. 7 that the amount of laterite dissolved increases with the stirring speed between 0 – 360 rpm. The percentage dissolved appears to be practically constant afterwards. There is no appreciable gain from 360 – 540 rpm. Hence, increase in the percentage of laterite dissolved with increasing stirring speed demonstrates the importance of diffusion in the dissolution process. 3.3 Kinetic Analysis The shrinking core model considers that the leaching process is controlled either by the diffusion of reactant through the solution boundary layer or through a solid product layer; or by the rate of the surface chemical reaction; or combination of surface chemical reaction and diffusion of reactant (mixed control mechanism). For this study, three shrinking core models were investigated with respect to the linearization of the dissolution curves (Figs. 2 – 4) as proposed by several investigators [6, 7, 9]: 1- (1 - X) 1/3 = k r t (1) 1- 2/3X - (1 - X) 2/3 = k d t (2) 1- (1- X) 1/3 + y/6[(1- X) 1/3 + 1 - 2(1- X) 2/3 ] = k m t (3) where X is the fraction of laterite dissolved; t is contact time (s); k r , k d and k m are the reaction rate constants. Equation 1 is based on the surface chemical reaction as the rate controlling step and its slope corresponds to the apparent rate constant k r . Equation 2 on the other hand is based on the assumption that the rate controlling step is diffusion through a semi-permeable product layer formed around the solid and its slope gives the apparent rate constant k d . Lastly, equation 3 is a combination of both surface chemical reaction and diffusion or simply called a mixed controlled reaction. The slope of this graph corresponds to the apparent rate constant k m . The rate constant values k r , k d and k m calculated from the corresponding graphs illustrated in Figures 8, 9 and 10 at various concentrations of HCl, HNO 3 and H 2 SO 4 are summarized in Tables 3, 4 and 5, respectively.  1466 Olushola S. AYANDA, Folahan A. ADEKOLA Vol.10, No.15 R 2 = 0.9975 R 2 = 0.9971 R 2 = 0.9975 R 2 = 0.9972 R 2 = 0.998 0 0.005 0.01 0.015 0.02 0.025 0.03 020406080100 120 140 Contact time (min) 1-2/3X-(1-X) 2/3 0.5M 1.0M 2.0M 4.0M 8.0M Fig. 8: Plot of [1-2/3X-(1-X) 2/3 ] versus contact time at various concentrations of HCl R 2 = 0.9968 R 2 = 0.9878 R 2 = 0.9962 R 2 = 0.9937 R 2 = 0.9983 0 0.001 0.002 0.003 0.004 0.005 0.006 020406080100 120 140 Contact time (min) 1-2/3X-(1-X) 2/3 0.5M 1.0M 2.0M 4.0M 8.0M Fig. 9: Plot of [1-2/3X-(1-X) 2/3 ] versus contact time at various concentrations of HNO 3  Vol.10, No.15 Comparative Study of the Kinetics 1467 R 2 = 0.9959 R 2 = 0.9903 R 2 = 0.9951 R 2 = 0.9944 R 2 = 0.9908 0 0.005 0.01 0.015 0.02 0.025 020 40 6080100120140 Contact time (min) 1-2/3X-(1-X) 2/3 0.5M 1.0M 2.0M 4.0M 8.0M Fig. 10: Plot of [1-2/3X-(1-X) 2/3 ] versus contact time at various concentrations of H 2 SO 4 Table 2: Apparent rate constants k r , k d and k m and correlation coefficient values at various concentrations of HCl Concentration of HCl (M) Apparent rate constant (10 - 4 min - 1 ) k r k d k m Correlation coefficient (R 2 ) k r k d k m 0.5 1.0 2.0 4.0 8.0 2.50 0.076 3.83 5.08 0.303 7.67 10.80 1.28 15.80 12.80 1.80 18.80 15.80 2.63 22.90 0.9049 0.9975 0.9064 0.8905 0.9971 0.8888 0.8887 0.9975 0.8853 0.8946 0.9972 0.8900 0.8990 0.9980 0.8927 Table 3: Apparent rate constants k r , k d and k m and correlation coefficient values at various concentrations of HNO 3 Concentration of HNO 3 (M) Apparent rate constant (10 - 4 min - 1 ) k r k d k m Correlation coefficient (R 2 ) k r k d k m 0.5 1.0 2.0 4.0 8.0 1.67 0.029 2.50 3.58 0.153 5.42 7.25 0.608 10.80 9.67 1.05 14.30 11.50 1.47 16.90 0.9375 0.9968 0.9381 0.9272 0.9878 0.9246 0.9276 0.9962 0.9255 0.9204 0.9937 0.9186 0.9252 0.9983 0.9231  1468 Olushola S. AYANDA, Folahan A. ADEKOLA Vol.10, No.15 Table 4: Apparent rate constants k r , k d and k m and correlation coefficient values at various concentrations of H 2 SO 4 Concentration of H 2 SO 4 (M) Apparent rate constant (10 - 4 min - 1 ) k r k d k m Correlation coefficient (R 2 ) k r k d k m 0.5 1.0 2.0 4.0 8.0 1.00 0.012 1.58 2.75 0.088 4.08 5.00 0.288 7.42 6.42 0.473 9.58 7.67 0.668 11.14 0.8205 0.9959 0.8201 0.8305 0.9903 0.8285 0.8372 0.9951 0.8335 0.8427 0.9944 0.8385 0.8470 0.9908 0.8417 These results (Fig. 8 – 10, Tables 2 – 4) clearly indicated that the mechanism of dissolution of laterite follows perfectly the diffusion through a semi-permeable product layer. Furthermore, the plot of rate constant, k versus reciprocal of the square of particle size, 1/r o2 (Fig. 11), was linear with a correlation coefficient of 0.9992, and this supports the proposition of diffusion kinetic model for the laterite ore dissolution [7, 10]. It is worthy of note that the plot of the rate constant k against the reciprocal of the particle radii, 1/r o did not give a straight line. R 2 = 0.9992 0 5 10 15 20 25 30 00.1 0.2 0.30.4 0.5 0.6 1/r o 2 k X 10 -5 Fig.11: Dependence of k on 1/r o2 3.3.1 Activation energy Arrhenius diagram in Fig. 12 was obtained by applying Equation 2 to the leaching experimental data in Fig. 5.  Vol.10, No.15 Comparative Study of the Kinetics 1469 R 2 = 0.9678 R 2 = 0.9709 R 2 = 0.9731 -14 -13 -12 -11 -10 -9 -8 -7 2.8 2.933.13.2 3.3 3.4 T -1 X 10 -3 (K -1 ) lnk HCl HNO3 H2SO4 Fig. 12: Arrhenius plot for laterite dissolution in HCl, HNO 3 and H 2 SO 4 acid Table 5 summarizes the apparent rate constant values for HCl 4 M, HNO 3 4 M and H 2 SO 4 2 M at various temperatures. The activation energy (E a ) values for the dissolution of laterite calculated from their respective slopes in Fig. 12 for HCl, HNO 3 and H 2 SO 4 were 60.23 kJmol -1 , 64.31 kJmol -1 and 67.53 kJmol -1 , respectively. Table 5: Apparent rate constant values k d for HCl (4 M), HNO 3 (4 M) and H 2 SO 4 (2 M) at different temperatures TºC 1/T (K -1 ) 4 M HCl k d (h -1 ) 4 M HNO 3 k d (h -1 ) 2 M H 2 SO 4 k d (h -1 ) 28 40 60 70 80 3.32 X10 - 3 3.19 X10 -3 3.00 X 10 -3 2.92 X 10 -3 2.83 X 10 -3 7.60 X 10 - 6 3.03 X 10 -5 1.28 X 10 -4 1.80 X 10 -4 2.63 X 10 -4 3.29X 10 - 6 1.53 X 10 -5 6.08 X 10 -5 1.05 X 10 -4 1.47 X 10 -4 1.25X 10 - 6 8.83 X 10 -6 2.88 X 10 -5 4.73 X 10 -5 6.68 X 10 -5  1470 Olushola S. AYANDA, Folahan A. ADEKOLA Vol.10, No.15 Olanipekun, (2000) [5] who previously investigated the kinetic of dissolution of another type of Nigerian laterite in hydrochloric acid reported values of 65.2 kJ/mol and 71.7 kJ/mol for the activation energy of pre-roasted and raw laterite respectively. The relatively higher values suggest that the type of laterite used by this author is obviously more difficult to leach when compared to the value of 60.2 kJ/mol obtained for this study. It is important to also note that several authors who had previously worked on some other types of laterite have reported dissolution data that fitted the diffusion kinetic equation with activation energy greater than 60 kJ/mol [5, 11]. Therefore, the increasing order of activation energies for the three leachants investigated in this work is given thus: E a (HCl) < E a (HNO 3 ) < E a (H 2 SO 4 ) Hence, HCl would lead to higher laterite dissolution than HNO 3 and H 2 SO 4 by atmospheric leaching for the used hydrogen ion concentration and temperatures. 3.3.2 Order of reaction The results on the effect of the three mineral acids concentrations were applied to this kinetic model and k d values for each hydrogen ion concentration are given in Table 6. Table 6: Values for rate constant for HCl, HNO 3 and H 2 SO 4 media at various concentrations [H + ] ln [H + ] HCl k d (h -1 ) HNO 3 k d (h -1 ) H 2 SO 4 k d (h -1 ) 0.5 1.0 2.0 4.0 8.0 -6.93 X10 - 1 0.00 6.73 X 10 -1 1.39 2.08 1.08 X 10 - 5 3.12 X 10 -5 7.71 X 10 -5 1.25 X 10 -4 1.84 X 10 -4 9.30 X 10 - 6 2.23 X 10 -5 5.23 X 10 -5 1.13 X 10 -4 1.58 X 10 -4 6.14 X 10 - 6 1.13 X 10 -5 2.05 X 10 -5 2.63 X 10 -5 4.70 X 10 -5 From the k d and hydrogen ion concentration values in Table 6, a plot of ln k d versus ln [H + ] were constructed (Fig. 13 & 14).  Vol.10, No.15 Comparative Study of the Kinetics 1471 R2 = 0.9561 R2 = 0.982 -12.5 -12 -11.5 -11 -10.5 -10 -9.5 -9 -8.5 -8 -1-0.500.51 1.5 2 2.5 ln[H + ] lnk d HCl H2SO4 Fig. 13: Plot of ln k d vs ln [H + ] for HCl and H 2 SO 4 R2 = 0.9776 -12 -11.5 -11 -10.5 -10 -9.5 -9 -8.5 -8 -1-0.50 0.511.52 2.5 ln[H+] lnkd HNO3 Fig. 14: Plot of ln k d vs ln [H + ] for HNO 3  1472 Olushola S. AYANDA, Folahan A. ADEKOLA Vol.10, No.15 As seen from Figs. 13 and 14, the estimated order of reaction for the systems were 1.02, 1.02 and 0.73 with respect to HCl, HNO 3 and H 2 SO 4 concentations respectively. Furthermore, the activation energy and the order of reaction values with respect to the various acids concentration, temperature and particle size confirm the shrinking core model for a diffusion controlled process. 4. CONCLUSION In the present study, the dissolution of laterite in hydrochloric, nitric and sulphuric acid solutions was studied. It was found that the rate of laterite dissolution increases with acid concentration, temperature, stirring speed and decreases with particle size. The dissolution of laterite was found to be controlled by the shrinking core model for a diffusion-controlled process. Values of 60.23 kJmol -1 , 64.31 kJmol -1 and 67.53 kJmol -1 were obtained for the activation energies of laterite dissolution in hydrochloric, nitric and sulphuric acids, respectively, and the order of reaction was approximately one with respect to each of the three acids. REFERENCES 1. Aleva, G. J. J., 1994, Laterites: Concept, Geology, Morphology and Chemistry, ISRIC, Wageningen, the Netherlands, ISBN 90-6672-053-0. 2. Hudson, R. 2005, Using Laterite, AquaBotanic, Salem. 3. Schellmann, W., 1983, “Geochemical Principles of Lateritic Nickel Ore Formation.” Proceedings of the International Seminar on Laterization Processes, Sao Paulo, 119-135. 4. Bardossy, G., and Aleva, G. J. J., 1990, “Lateritic Bauxites.” Development in Economic Geology, 27, 624. 5. Olanipekun, E. O., 2000, “Kinetics of leaching laterite.” International Journal of Mineral Processing, 60, 9-14. 6. Aydogan, S., Aras, A., and Canbazoglu, M., 2005, “Dissolution kinetics of Sphalerite in acidic ferric chloride leaching.” Chemical Engineering Journal, 114, 67-72. 7. Baba, A. A., Adekola, A. F., and Bale, R. B., 2009, “Development of a combined pyro- and hydro-metallurgical route to treat spent zinc-carbon batteries.” Journal of Hazardous Materials, 171, 838-844. 8. Madhuchhanda, M., Devi, N. B., Rao, K. S., Rath, P. C., and Paramguru, R. K., 2000, “Oxidation of Sphalerite in Hydrochloric acid medium in the presence of manganese dioxide.” The Inst. of Min. and Metallurgy, 109, C150-C155. 9. Antonijevic, M. M., Jankovic, Z. D., and Dimitrijeviv, M. D., 2004, “Kinetics of Chalcopyrite dissolution by hydrogen peroxide in Sulphuric acid.” Hydrometallurgy, 71, 329-334. 10. Ucar, G., 2009, “Kinetics of Sphalerite dissolution by sodium chlorate in hydrochloric Acid.” Hydrometallurgy, 95, 39-43. 11. Stopic, S., Friedrich, B., and Fuch, R., 2003, “Kinetics of sulphuric acid leaching of the Serbian nickel laterite ore under atmospheric pressure.” Metalurgica Journal of Metallurgy, 235-244. |