Paper Menu >>
Journal Menu >>
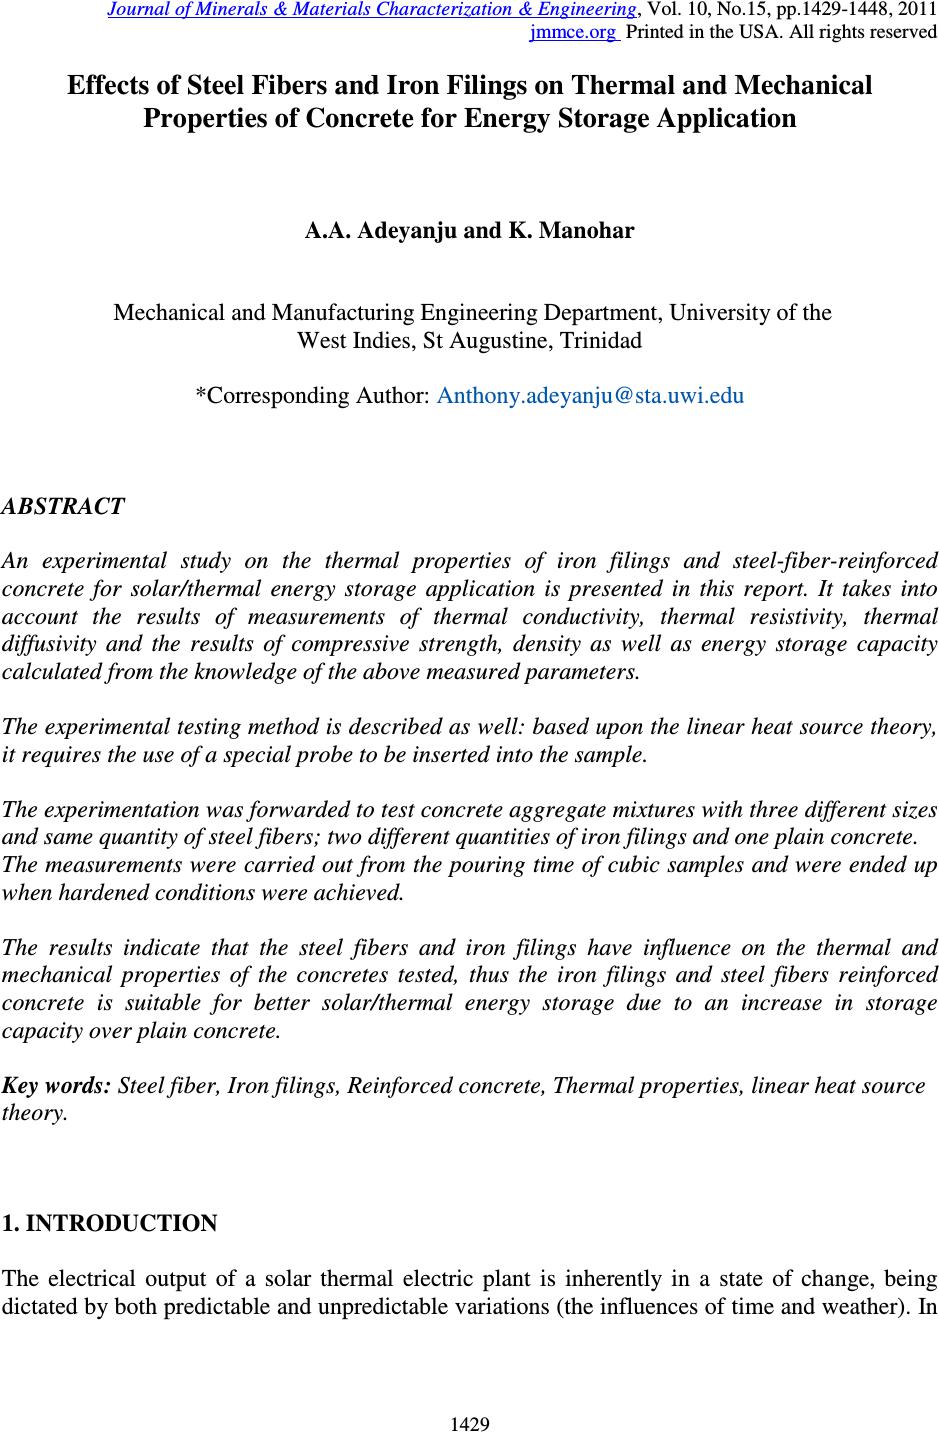 Journal of Minerals & Materials Characterization & Engineering, Vol. 10, No.15, pp.1429-1448, 2011 jmmce.org Printed in the USA. All rights reserved 1429 Effects of Steel Fibers and Iron Filings on Thermal and Mechanical Properties of Concrete for Energy Storage Application A.A. Adeyanju and K. Manohar Mechanical and Manufacturing Engineering Department, University of the West Indies, St Augustine, Trinidad *Corresponding Author: Anthony.adeyanju@sta.uwi.edu ABSTRACT An experimental study on the thermal properties of iron filings and steel-fiber-reinforced concrete for solar/thermal energy storage application is presented in this report. It takes into account the results of measurements of thermal conductivity, thermal resistivity, thermal diffusivity and the results of compressive strength, density as well as energy storage capacity calculated from the knowledge of the above measured parameters. The experimental testing method is described as well: based upon the linear heat source theory, it requires the use of a special probe to be inserted into the sample. The experimentation was forwarded to test concrete aggregate mixtures with three different sizes and same quantity of steel fibers; two different quantities of iron filings and one plain concrete. The measurements were carried out from the pouring time of cubic samples and were ended up when hardened conditions were achieved. The results indicate that the steel fibers and iron filings have influence on the thermal and mechanical properties of the concretes tested, thus the iron filings and steel fibers reinforced concrete is suitable for better solar/thermal energy storage due to an increase in storage capacity over plain concrete. Key words: Steel fiber, Iron filings, Reinforced concrete, Thermal properties, linear heat source theory. 1. INTRODUCTION The electrical output of a solar thermal electric plant is inherently in a state of change, being dictated by both predictable and unpredictable variations (the influences of time and weather). In  1430 A.A. Adeyanju and K. Manohar Vol.10, No.15 either event, utility system needs may require a fully functional storage system to mitigate the changes in solar radiation or to meet demand peaks. A distinct advantage of solar thermal power plants compared with other renewable energies, such as photovoltaics (PV) and wind, is the possibility of using relatively cheap storage systems. That is, storing the thermal energy itself. Storing electricity is much more expensive. Thermal energy storage (TES) option can collect energy in order to shift its delivery to a later time, or to smooth out the plant output during intermittently cloudy weather conditions [1]. Hence, the operation of a solar thermal power plant can be extended beyond periods of no solar radiation without the need to burn fossil fuel. Times of mismatch between energy supply by the sun and energy demand can be reduced. When used with Integrated Solar Combined Cycle Systems, energy storage could provide another important advantage. If the plant operates at base load, it will operate at full load only when enough solar energy is available. At part load, the turbine efficiency can decrease considerably. If fossil energy is used to augment turbine load (through the use of duct firing, a heat transfer fluid heater, or a backup boiler) when solar is not available, the plant converts that fossil fuel at a substantially lower efficiency than if it had been used directly in the combined cycle. Using thermal energy storage instead of a fossil burner can help to overcome this problem. Economic thermal storage is a key technological issue for the future success of solar thermal technologies. Besides high thermal durability, the storage concrete has to fulfill numerous requirements. For example, a high heat capacity and thermal conductivity will reduce the costs of the heat exchanger and thermal insulation. Research on closely-spaced wires and random metallic fibers in the late 1950s and early 1960s was the basis for a patent on steel fiber reinforced concrete (SFRC) based on fiber spacing. The Portland Cement Association (PCA) investigated fiber reinforcement in the late 1950s. Principles of composite materials were applied to analyze fiber reinforced concrete. The addition of fibers was shown to increase toughness much more than the first crack strength in these tests. Another patent based on bond and the aspect ratio of the fibers was granted in 1972. Since the time of these original fibers, many new steel fibers have been produced. Steel fiber reinforced concrete is concrete made of hydraulic cements containing fine or fine and coarse aggregate and discontinuous discrete steel fibers. In tension, SFRC fails only after the steel fiber breaks or is pulled out of the cement matrix. Properties of SFRC in both the freshly mixed and hardened state, including durability, are a consequence of its composite nature. The mechanics of how the fiber reinforcement strengthens concrete or mortar, extending from the elastic pre-crack state to the partially plastic post-cracked state, is a continuing research topic. One approach to the mechanics of SFRC is to consider it a composite material whose properties can be related to the fiber properties (volume percentage, strength, elastic modulus, and a fiber bonding parameter of the fibers), the concrete properties (strength, volume percentage, and elastic modulus), and the properties of the interface between 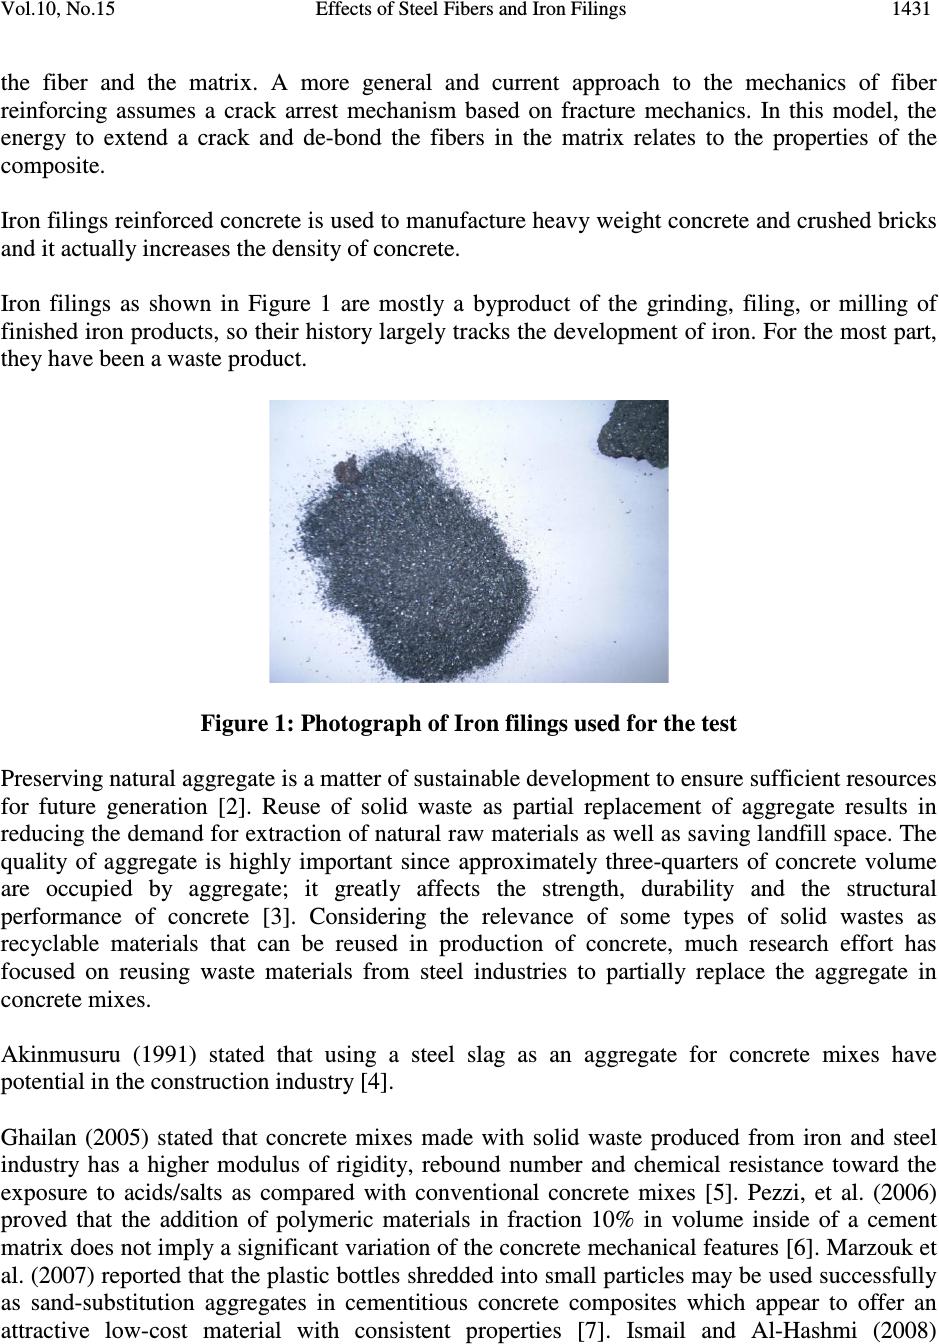 Vol.10, No.15 Effects of Steel Fibers and Iron Filings 1431 the fiber and the matrix. A more general and current approach to the mechanics of fiber reinforcing assumes a crack arrest mechanism based on fracture mechanics. In this model, the energy to extend a crack and de-bond the fibers in the matrix relates to the properties of the composite. Iron filings reinforced concrete is used to manufacture heavy weight concrete and crushed bricks and it actually increases the density of concrete. Iron filings as shown in Figure 1 are mostly a byproduct of the grinding, filing, or milling of finished iron products, so their history largely tracks the development of iron. For the most part, they have been a waste product. Figure 1: Photograph of Iron filings used for the test Preserving natural aggregate is a matter of sustainable development to ensure sufficient resources for future generation [2]. Reuse of solid waste as partial replacement of aggregate results in reducing the demand for extraction of natural raw materials as well as saving landfill space. The quality of aggregate is highly important since approximately three-quarters of concrete volume are occupied by aggregate; it greatly affects the strength, durability and the structural performance of concrete [3]. Considering the relevance of some types of solid wastes as recyclable materials that can be reused in production of concrete, much research effort has focused on reusing waste materials from steel industries to partially replace the aggregate in concrete mixes. Akinmusuru (1991) stated that using a steel slag as an aggregate for concrete mixes have potential in the construction industry [4]. Ghailan (2005) stated that concrete mixes made with solid waste produced from iron and steel industry has a higher modulus of rigidity, rebound number and chemical resistance toward the exposure to acids/salts as compared with conventional concrete mixes [5]. Pezzi, et al. (2006) proved that the addition of polymeric materials in fraction 10% in volume inside of a cement matrix does not imply a significant variation of the concrete mechanical features [6]. Marzouk et al. (2007) reported that the plastic bottles shredded into small particles may be used successfully as sand-substitution aggregates in cementitious concrete composites which appear to offer an attractive low-cost material with consistent properties [7]. Ismail and Al-Hashmi (2008)  1432 A.A. Adeyanju and K. Manohar Vol.10, No.15 demonstrated that using waste iron filings as partial replacement of fine aggregate in concrete mixes offers higher strength values than that for the plain mixes [8]. The results of the study carried out by Kou et al. (2009) revealed that the workability, compressive strength, and tensile splitting strength of lightweight aggregate concretes that are prepared with recycled plastic waste were reduced [9]. None of the studies explored the effects of waste materials on the mechanical behavior of concrete mixes for solar/thermal energy storage. In view of the fact that iron filings and steel fibers are widespread types of non-biodegradable solid wastes derived as discarded materials from several industrial processes, the knowledge of their combined influence on the strength properties of concrete is worth to be considered. The current study describes the impact of utilizing iron filings and steel fibers to partially replace sand on the mechanical properties of the waste modified-concrete mixes. The purpose of this study is to investigate experimentally the effects of the addition of steel fibers and iron filings (solid waste) to thermal properties of concrete for solar/thermal energy storage application. The experimentation is based upon the linear heat source theory; it requires the use of a special probe to be inserted into the sample. 2. THEORY Thermal properties analyzer calculates its values for thermal conductivity, resistivity, and diffusivity by monitoring the dissipation of heat from a line heat source given a known voltage. The equation for radial heat conduction in a homogeneous, isotropic medium is given by 2 1 2 TT T r t rr − ∂ ∂∂ = α+ ∂ ∂∂ (1) Where T temperature ( o C) is, t is time (s), α is the thermal diffusivity (m 2 /s), and r is radial distance (m). When a long, electrically heated probe is introduced into a medium, the rise in temperature from initial temperature, o T at some distance r , from the probe is: 2 4 4 o h q r T TEi t α − −= πΚ (2) Where q is the heat produced per unit length per unit time (W/m), h Κ is the thermal conductivity of the medium (W/m o C), and Ei is the exponential integral function ()( ) 22 2 1 exp ln.... 44 8 a rr r Eiau du utt t γαα α ∞ −−=−= −−+−+ ∫ (3)  Vol.10, No.15 Effects of Steel Fibers and Iron Filings 1433 With a = 2 4 r t α and γ is Euler’s constant (0.5772), when t is large, the higher order terms can be ignored, so combining Equations (2) and (3) yields ( ) 2 ln ln 4 4 o h q r T Tt γα − −≅− − πΚ (4) It is apparent from the relationship between thermal conductivity and , o TT T ∆ =− shown in Equation (4), that T ∆ and ( ) ln t are linearly related with a slope4 h q m= πΚ . Linearly regressing T ∆ on ( ) ln t yields a slope that, after rearranging, gives the thermal conductivity as 4 h q K m = π (5) q is known from the power supplied to the heater. The diffusivity can also be obtained from Equation (4). The intersection of the regression line with the t axis ( ) 0 T ∆ = gives ( ) 2 lnln4 o r t γα − = + (6) From the calculated o t {from the intercept of T ∆ vs ( ) ln t and finite r ,} Equation (6) gives the diffusivity. 3. METHODOLOGY 3.1 Composition and Preparation of the Concrete Cube Type I Portland cement was utilized in this study. The chemical analysis of cement was performed according to ASTM C114 [10]. The chemical composition and physical properties of cement are given in Tables 1 and 2, respectively. The waste iron filings aggregate was obtained from the University of the West Indies Mechanical workshop, it is normally generated in hundreds of tons from the iron smith processes. The gradation, chemical composition and physical properties of the waste iron filings are given in Tables 3, 4 and 5, respectively. The type of aggregate influences the thermal properties of concrete and hence limestone and quartzite were used in the concrete mix. Further, to compare the performance of fiber-reinforced concrete with that of plain concrete, three types of concrete samples (A, B, C, D, E and F ) were investigated and the compositions were shown in Table 6. 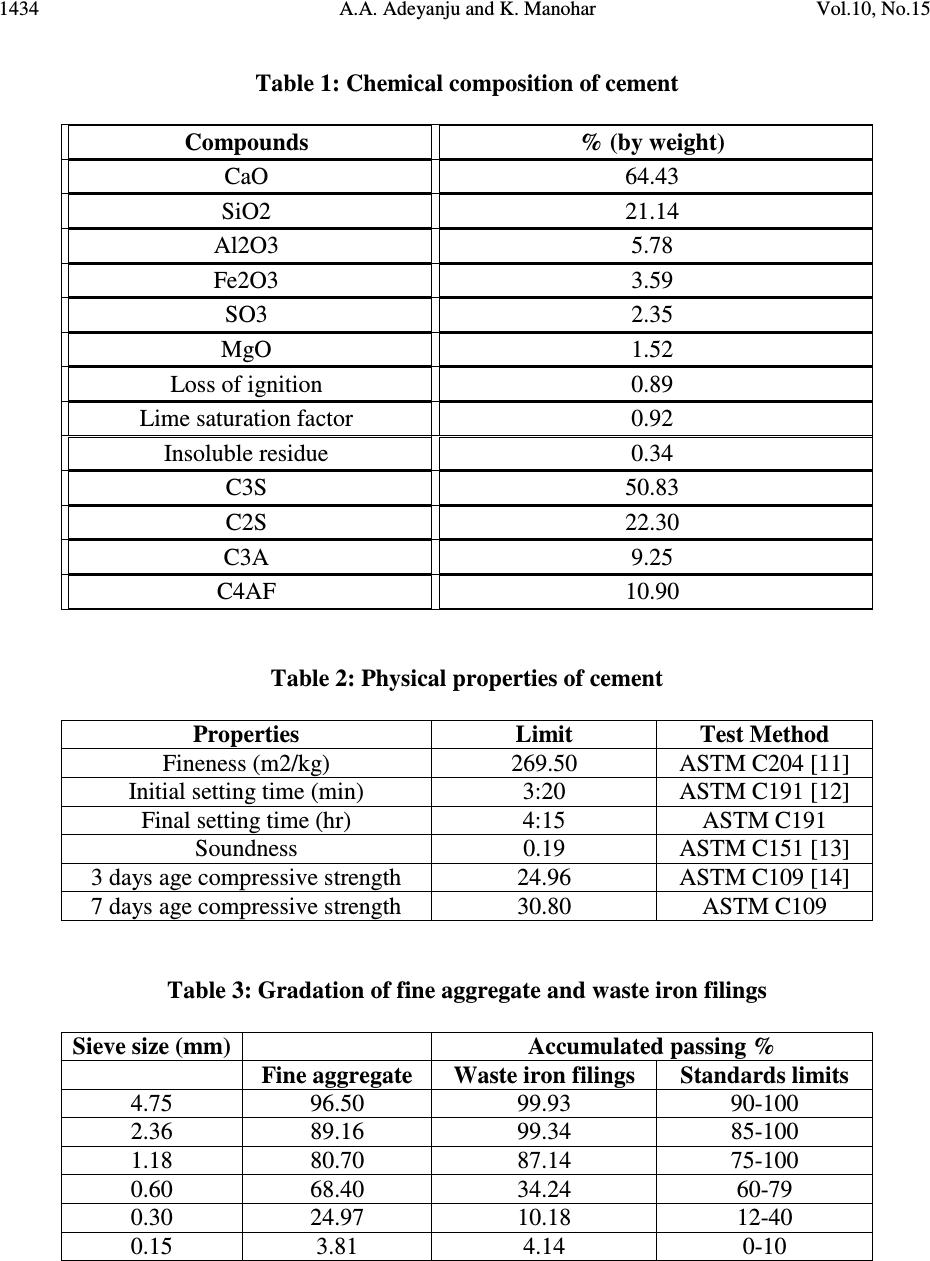 1434 A.A. Adeyanju and K. Manohar Vol.10, No.15 Table 1: Chemical composition of cement Compounds % (by weight) CaO 64.43 SiO2 21.14 Al2O3 5.78 Fe2O3 3.59 SO3 2.35 MgO 1.52 Loss of ignition 0.89 Lime saturation factor 0.92 Insoluble residue 0.34 C3S 50.83 C2S 22.30 C3A 9.25 C4AF 10.90 Table 2: Physical properties of cement Properties Limit Test Method Fineness (m2/kg) 269.50 ASTM C204 [11] Initial setting time (min) 3:20 ASTM C191 [12] Final setting time (hr) 4:15 ASTM C191 Soundness 0.19 ASTM C151 [13] 3 days age compressive strength 24.96 ASTM C109 [14] 7 days age compressive strength 30.80 ASTM C109 Table 3: Gradation of fine aggregate and waste iron filings Sieve size (mm) Accumulated passing % Fine aggregate Waste iron filings Standards limits 4.75 96.50 99.93 90-100 2.36 89.16 99.34 85-100 1.18 80.70 87.14 75-100 0.60 68.40 34.24 60-79 0.30 24.97 10.18 12-40 0.15 3.81 4.14 0-10  Vol.10, No.15 Effects of Steel Fibers and Iron Filings 1435 Table 4: Chemical composition of waste iron filings Compounds Weight % Test method Fe2O3 93.14 Titration with potassium dichromate using diphenyl amine as indicator. Al2O3 < 0.03 Auto color analyzer Table 5: Physical properties of waste iron filings Properties Limit Test method Fineness modulus 2.65 F.M = accumulative percentage retained/100 Specific gravity 4.50 Somayaji [1995] [15] Density (kg/m3) 1946.70 ASTM C 293 [16] Color Black gray - Table 6: Composition of concrete mixtures used for test SAMP LES Property A B C D E F Water content (Litre) Cement content (Kg/m 3 ) Aggregate: Quarzite (Kg/m 3 ) Limestone (Kg/m 3 ) Aggregate/Cement Water/Cement Steel fibers quantity (Kg/m 3 ) Steel fibers Length (cm) Steel fibers Length equivalent diameter (cm) % of Steel fibers/aggregate 20g Iron Filings quantity (Kg/m 3 ) 50g Iron Filings quantity (Kg/m 3 ) 0.28 0.90 1.10 1.00 2.33 0.31 - - - 0.28 0.90 1.10 1.00 2.33 0.31 0.02 5.0 0.09 0.66% 0.28 0.90 1.10 1.00 2.33 0.31 0.02 2.5 0.09 0.66% 0.28 0.90 1.10 1.00 2.33 0.31 0.02 1.0 0.09 0.66% 0.28 0.90 1.10 1.00 2.33 0.31 - - - 0.02 0.05 0.90 0.90 1.10 1.00 2.33 0.31 - - - 0.02 0.05 As reinforcement, corrugated steel fibers were used. The fibers had a length of 5 cm, an equivalent diameter of 0.09 cm, and an aspect ratio of 57. The weight percentage of the steel fibers in the concrete was approximately 0.02 kg/m3. The steel fibers were added to the fresh concrete and mixed for about 2 minutes to ensure uniform dispersion.  1436 A.A. Adeyanju and K. Manohar Vol.10, No.15 In making the concrete test cube, Portland cement, quartzite (sharp sand) and gravel (limestone) provided by the University of West Indies concrete laboratory were used. After consideration of various mixtures of sand and gravel, the proportion of 55 per cent sand to 45 per cent gravel, by weight, was chosen, though the proportioning was actually done by loose volumes. These proportions lie between the coarser mixtures that are frequently used and the mixtures that have larger percentages of sand which produced an easily worked mixture. The aggregate of this mixture had a weight of 3kg per 0.001m 3 of concrete cube. One consistency was used in the concrete mixture which is referred to as 100 per cent water content. This consistency was such that freshly moulded concrete in cubic form of size 0.1m x 0.1m was made. Table 6 shows the mix proportions of different constituents for the mixtures tested, together with concrete and steel data for the four batches. Vibrators were used to consolidate the concrete. The forms were removed from the mould after the concrete had set 24 hours. The forms were then stored in damp sand for 14 days and later removed to a dry room. They were all thoroughly dry when tested. The appearance of the cubic shaped concrete is shown in Figure 2. Figure 2: Cubic shaped concrete samples Concrete thermal conductivity was measured using the KD2 sensor, manufactured by the Decagon Devices Inc, Pullman, Washington, United States. The sensor employs steady-state methodology to measure thermal properties and calculates thermal conductivity, by monitoring the dissipation of heat from a line heat source given a known voltage using the equation for radial heat conduction in a homogeneous and isotropic medium. According to the KD2 User's Manual by Decagon Devices Inc. (2001) [17], when a long, electrically heated probe is introduced into a medium, when time t in s is large, the rise in temperature from an initial temperature, T 0 at some distance r in m from the probe can be approximated as  Vol.10, No.15 Effects of Steel Fibers and Iron Filings 1437 (7) Where: T is temperature in °C; q is the heat produced per unit length per unit time in W m −1 ; α is the diffusivity in m 2 s −1 ; k is thermal conductivity in W m −1 °C −1 of the medium; while γ is Euler's constant (0·5772). The relationship between k and ∆T=T-T 0 shown in Eqn.(7) is such that ∆T and ln t are linearly related with a slope m such that m=q/(4πk). Linearly regressing ∆T on ln t yields a slope, which, after rearranging, gives the thermal conductivity k as: k=q/4πm (8) Where, q is known from the power supplied to the heater. The above theory assumes that the long heat source can be treated as an infinitely long heat source. The manufacturer of the KD2 probe found that it measures k and α with 5% and 10% accuracies, respectively. The KD2 probe records the temperature of the medium. 3.2 Sample Testing of Concrete Mixes Concrete tests are administered to samples to learn about their properties. The most common concrete tests carried out in this study are the Conductivity Test, Diffusivity Test, Slump Test, and the Compressive Strength Test. 3.2.1 The slump test The Slump Test measures the workability and consistency of a concrete sample. A slump cone (30.48 cm tall) or a mini slump cone (10.16 cm tall), a tamping rod (1.5875 cm diameter x 60.96 cm tall), and concrete mix is required to complete the slump test. To complete the slump test, the slump cone is filled with concrete mix that amounts to the height and rodded with the tamping rod 25 times. This process is repeated 3 times until the cone is full. Then the excess cement is removed using the tamping rod. Immediately after the cement is removed, the slump cone is slowly lifted above the concrete mix which should be in the shape of a cone. Within 2.5 minutes, the difference between the concrete mix height and the slump cone height should be measured. This value is known as the slump value. While individually slump values do not relay a large amount of information, a set of slump values show the consistency of the workability of the concrete mix; all the slump values should have approximately the same slump in order to have consistent workability. The slump value for the samples tested in this study is zero. 3.2.2 The compressive strength test The Compressive Strength Test measures the compressive force a concrete sample is able to withstand. A concrete sample (cube), a compressive test machine, and safety glasses are required  1438 A.A. Adeyanju and K. Manohar Vol.10, No.15 to complete this test. The seven concrete cube samples used for this test are all having dimension of 0.1m x 0.1m. After the sample is cured, it is placed between two metal plates in the compressive test machine shown in Figure 3. The machine applies force increasing at a constant rate upon the sample. When the sample fails, the load applied is recorded in Table 7; this value is known as the peak load. By using the following equation, the compressive strength can be calculated: where P = peak load, A = minimum cross-sectional area and F c = compressive strength. Figure 3: Samples after compressive strength test Table 7: Compressive strength of concrete specimens Samples Cast Date Date Tested Age (Days) Specimen Size and Type (mm) Weight (kg) Density (kg/m 3 ) Failure Load (KN) Compressive Strength (N/mm 2 ) A 10/3/11 7/4/11 28 100(Cube) 2.55 2550 556 55.6 B 10/3/11 7/4/11 28 100(Cube) 2.87 2870 669 66.9 C 10/3/11 7/4/11 28 100(Cube) 2.85 2850 650 65.0 D 10/3/11 7/4/11 28 100(Cube) 2.83 2490 654 65.4 E 10/3/11 7/4/11 28 100(Cube) 2.85 2850 578 57.8 F 10/ 3/11 7/4/11 28 100(Cube) 2.83 2630 416 41.6 3.2.3 The thermal conductivity, diffusivity and resistivity test 3.2.3.1 Description of test specimens and apparatus used  Vol.10, No.15 Effects of Steel Fibers and Iron Filings 1439 The Linear Heat Source method is used to measure simultaneously the coefficients of conductivity and thermal diffusivity of the seven concrete samples. The storage capacity will be determined according to the relationship with conductivity and diffusivity. In this test a special thermal probe sensors needle coated with thermal grease (in order to maintain good contact with the concrete walls) is introduced into a drilled hole of 7cm deep and 0.5cm diameter in each of the seven concrete samples (A, B, C, D, E, F) and this is heated at constant power by the probe which also measures the temperature rise of the sample during the transient time through imbedded thermocouples. The probe sensors needle contains both a heating element and a thermistor. Its controller module contains a battery, a 16-bit microcontroller/AD converter and power control circuitry. The thermal properties analyzer (probe) is as shown in Figure 4. Figure 4: Thermal properties analyzer To start measurement with the probe, the microcontroller waits for 90 seconds for temperature stability, and then applies a known amount of current for 30 seconds to a heater in the probe that has an accurately known resistance. The microprocessor calculates the amount of power supplied to the heater. The probe’s thermistor measures the changing temperature for 30 seconds while the microprocessor stores the data. At the end of the reading for each of the seven concrete samples the controller computes the thermal conductivity and diffusivity using the change in temperature ( ) T ∆ versus time data. Thermal resistivity is computed as the reciprocal of thermal conductivity. It is important to wait for about 5 minutes between readings in order to make the probe to be as close to equilibrium as possible. An ideal environment for equilibrium can be accomplished by placing the probe in an isothermal chamber or Styrofoam box. 4. RESULTS AND DISCUSSION  1440 A.A. Adeyanju and K. Manohar Vol.10, No.15 The results of the observations and calculations are shown in Figures 5 to 8. Tests were made on six concrete samples of cubic shape. Sample A consists of 20g plain concrete without steel fibres; Sample B consists 20g of 5cm length steel fibre plus concrete mixtures; Sample C consists of 20g of 2.5cm length steel fibre plus concrete mixtures; Sample D consists of 20g of 1cm length steel fibre plus concrete mixtures; Sample E consists of 50g of iron filings plus concrete mixtures while Sample F consists of 20g of iron filings plus concrete mixtures. Figure 5: Comparisons of temperature with thermal conductivity of concrete samples A, B, C, D, E and F  Vol.10, No.15 Effects of Steel Fibers and Iron Filings 1441 Figure 6: Comparisons of temperature with thermal resistivity of concrete samples A, B, C, D, E and F  1442 A.A. Adeyanju and K. Manohar Vol.10, No.15 Figure 7: Comparisons of temperature with thermal diffusivity of concrete samples A, B, C, D, E and F  Vol.10, No.15 Effects of Steel Fibers and Iron Filings 1443 Figure 8: Comparisons of temperature with thermal storage capacity of concrete samples A, B, C, D, E and F The comparison of samples thermal conductivity were made with temperatures and it was discovered that Sample B which was reinforced with 5cm steel fibers has the highest thermal conductivity while Sample A of plain concrete has the lowest. The results indicate that there is very slight change of temperature for each of the concrete samples tested. The presence of iron filings increases the thermal conductivity to a small extent but the presence of steel fibers has a greater effect on concrete mixtures of the tested samples. The greater increase in thermal conductivity of reinforced steel fiber concrete can be attributed to the fact that the thermal conductivity of steel is about 50 times higher than that of concrete  1444 A.A. Adeyanju and K. Manohar Vol.10, No.15 From Figure 6 it can be seen that thermal resistivity of the samples tested is an inverse of thermal conductivity. As shown in Figure 7, sample B has the highest thermal diffusivity follow in order by samples C, E, F and D respectively while sample A which consists of plain concrete has the lowest thermal diffusivity. This is an indication that the presence of steel fiber and iron filings increases the rate at which a temperature disturbance at one point in the tested samples travels to another point. From the values given in Table 7 for the densities of the samples tested, sample B has the highest density follow in order by samples C, E, F and A respectively while sample D has the lowest density. The increase in the density of the steel fibers reinforced concrete is due to the fact that steel has a density which is three times that of concrete and this actually improves the storage capacity of the samples with steel fibers as shown in Figure 8. The decrease in density noticed with sample D which contains 20g steel fibers of length 1cm may actually be due to the dispersion of the fibers during the batching and mixing phase which may not be uniform. It was noticed during calculation that the percentage of voids in samples D was about 25 per cent while that of samples A, B, C, E and F range from 16 - 20 per cent. It seems probable that the proportion of solid material to voids to a large extent determines the density, storage capacity and even the thermal conductivity. The storage capacity of sample A which is the lowest may be due to the fact that the sample contain only plain concrete without steel fibers or iron filings. The results of the measurements of the mechanical properties of the concretes samples showed that the compressive strength of the steel fiber reinforced concrete is higher than that of iron filings and plain concrete as shown in Table 7. Compressive and tensile/flexural strengths are directly related to density. An increase in density of 50-70 kg/m 3 can result in a compressive strength gain of 5-8N/mm (12-18%). The compressive strength and density are slightly increased in value with steel fiber content with 0.66% as compared with the plain concrete with no steel fiber, and the highest strength and density are obtained at the fiber–concrete ratio of 0.66% and 5cm length steel fiber. The increase in compressive strength and bulk density may be due to high compaction between the steel fibers and the aggregates plus the cement matrix. However, the compressive strength of specimens increased with the increase in density, this can be explained by the fact that the composites have higher density, and this might be due to the decrease in air void and low porosity. Steel Fibers do little to enhance the static compressive strength of concrete, with increases in strength ranging from essentially nil to perhaps 25%. Even in members that contain conventional reinforcement in addition to the steel fibers, the fibers have little effect on compressive strength.  Vol.10, No.15 Effects of Steel Fibers and Iron Filings 1445 However, the fibers do substantially increase the post-cracking ductility, or energy absorption of the material. This is shown graphically in the compressive stress-strain curves of steel fiber reinforced concrete in Figure 9. Figure 9: Stress-Strain curves in compression for steel fiber reinforced concrete [18] Fibers aligned in the direction of the tensile stress may bring about very large increases in direct tensile strength, as high as 133% for 5% of smooth, straight steel fibers. However, for more or less randomly distributed fibers, the increase in strength is much smaller, ranging from as little as no increase in some instances to perhaps 60%, with many investigations indicating intermediate values, as shown in Figure 9. Splitting-tension test of SFRC show similar result. Thus, adding fibers merely to increase the direct tensile strength is probably not worthwhile. However, as in compression, steel fibers do lead to major increases in the post-cracking behavior or toughness of the composites. Steel fibers are generally found to have aggregate much greater effect on the flexural strength of SFRC than on either the compressive or tensile strength, with increases of more than 100% having been reported. The increase in flexural strength is particularly sensitive, not only to the fiber volume, but also to the aspect ratio of the fibers, with higher aspect ratio leading to larger strength increases. Figure 10 describes the fiber effect in terms of the combined parameter WL/D, where L/D is the aspect ratio and W is the weight percent of fibers. It should be noted that for WL/D > 600, the mix characteristics tended to be quite unsatisfactory. Deformed fibers show the same types of increases at lower volumes, because of their improved bond characteristics.  1446 A.A. Adeyanju and K. Manohar Vol.10, No.15 Figure 10: Influence of steel fiber content on tensile strength [18] Fibers are added to concrete not to improve the strength, but primarily to improve the toughness, or energy absorption capacity. Commonly, the flexural toughness is defined as the area under the complete load-deflection curve in flexure; this is sometimes referred to as the total energy to fracture. Alternatively, the toughness may be defined as the area under the load-deflection curve out to some particular deflection, or out to the point at which the load has fallen back to some fixed percentage of the peak load. Probably the most commonly used measure of toughness is the toughness index proposed by Johnston and incorporated into ASTM C1018 [19]. As is the case with flexural strength, flexural toughness also increases at the parameter WL/D increases, as shown in Figure 11. Figure 11: Effect of WL/D on the flexural strength of concrete [Johnston, (1974)]  Vol.10, No.15 Effects of Steel Fibers and Iron Filings 1447 The load-deflection curves for different types and volumes of steel fibers can vary enormously, as was shown previously in Figure 12. For all of the empirical measures of toughness, fibers with better bond characteristics (i.e. deformed fibers, or fibers with greater aspect ratio) give higher toughness values than do smooth, straight fibers at the same volume concentrations. Figure 12: Range of load-deflection curves obtained in the testing of steel fiber reinforced concrete [20] 5. CONCLUSION Experimental studies were carried out to investigate the influence of steel fibers and iron filings on the behaviour of concrete for the purpose of solar/thermal energy storage. It can be concluded that: (i) The compressive strength of concrete reinforced with steel fibers and iron filings are higher than that of plain concrete except in the case of 20g iron filings reinforced concrete which has lower compressive strength and this may be due to less compactness and low porosity of the mixture. The presence of steel fibers and iron filings improves the ductility of the concrete. (ii) The presence of steel fibers and iron filings also increases the thermal conductivity and thermal storage capacity of the concrete which makes it more suitable for energy storage.  1448 A.A. Adeyanju and K. Manohar Vol.10, No.15 REFERENCES 1. Adeyanju, A.A and Manohar,K (2009) Theoretical and Experimental Investigation of Heat Transfer in Packed Beds. Research Journal of Applied Sciences.4 (5). Pp.166-167. 2. Rakshvir, M., and Barai, S.V. (2006). "Studies on Recycled Aggregates-Based Concrete." Waste Management & Research, 24, 225-233. 3. Neville, A.M., and Brooks, J.J. (1990). "Concrete Technology." Longman Group Limited, U.K. 4. Akinmusuru, J.O. (1991) "Potential Beneficial Uses of Steel Slag Wastes for Civil Engineering Purposes." Resources, Conservation and Recycling, 5, 73-80. 5. Ghailan, A.H. (2005). "Modified Concrete by Using a Waste Material as a Coarse Aggregate." Construction Research Congress: Broadening perspective-Proceedings of the Congress, 217-226. 6. Pezzi, L., De Lice, P., Vuono, D., Chiappetta, F., Nastro, A. (2006). "Concrete Products with Waste's Material (Bottle, Glass, Plate)." Materials Science Forum, 1753-1757. 7. Marzouk, O.Y., Dheilly, R.M., Queneudec. M. (2007). "Valorization of Post-Consumer Waste Plastic in Cementitious Concrete Composites." Waste Management, 27, 310-318. 8. Ismail, Z.Z., and Al-Hashmi, E.A. (2008). "Reuse of Waste Iron as a Partial Replacement of Sand in Concrete." Waste Management, 28, 2048-2053. 9. Kou, S.C., Lee, G., Poon, C.S, Lai, W.L. (2009). "Properties of Lightweight Aggregate Concrete Prepared With PVC Granules Derived from Scraped PVC Pipes." Waste Management, 29, 621-628. 10. ASTM C114. "Standard Chemical Analysis of Hydraulic Cement." Annual book of ASTM standards. 11. ASTM C204. "Standard Test Method for Fineness of Hydraulic Cement by Air Permeability Apparatus." Annual Book of ASTM Standards. 12. ASTM C191. "Standard Test Method for Time of Setting of Hydraulic Cement by Vicat Needle." Annual book of ASTM standards. 13. ASTM C151. "Standard Test Method for Autoclave Expansion of Hydraulic Cement." Annual book of ASTM standards. 14. ASTM C109. "Standard Test Method for Compressive Strength of Hydraulic Cement." Annual Book of ASTM Standards. 15. Somayaji, S. (1995). "Civil Engineering Materials." Prentice-Hall, Inc., Englewood Cliffs, New Jersey. 16. ASTM C293. "Standard Test Method for Flexural Strength of Concrete Using Simple Beam With Center-Point Loading." Annual book of ASTM standards. 17. Decagon Devices Incorporated (2001). KD2 Thermal Properties Analyzer User's Manual, Version 1.0. http://www.thermalresistivity.com/KD2man.pdf (2006/01/23). 18. Johnston, C.D. (1974) “Steel fiber reinforced mortar and concrete”, A review of mechanical properties. In fiber reinforced concrete ACI – SP 44 – Detroit 1974. 19. ASTM C1018. "Standard Test Method for Flexural Toughness and First Crack Strength of Fiber-Reinforced Concrete (Using Beam with Third-Point Loading)." Annual Book of ASTM Standards. 20. Johnston, C.D. (1982) “Definition and measurement of flexural toughness parameters for fiber reinforced concrete” Cement Concrete Aggregate 1982. |