Applied Mathematics
Vol.06 No.06(2015), Article ID:57139,15 pages
10.4236/am.2015.66102
An Optimal Control Approach to HIV Immunology
Edilson F. Arruda1, Claudia M. Dias2, Camila V. de Magalhães3, Dayse H. Pastore3, Roberto C. A. Thomé3, Hyun Mo Yang4
1Instituto Alberto Luiz Coimbra de Pós Graduação e Pesquisa de Engenharia, Universidade Federal do Rio de Janeiro, Rio de Janeiro, Brazil
2Instituto Multidisciplinar, Universidade Federal Rural do Rio de Janeiro, Nova Iguaçu, Brazil
3Departamento de Matemática, Centro Federal de Educação Tecnológica Celso Suckow da Fonseca, Rio de Janeiro, Brazil
4Departamento de Matemática Aplicada, Universidade Estadual de Campinas, Campinas, Brazil
Email: efarruda@po.coppe.ufrj.br, mazzaclaudia@gmail.com, milamagal@yahoo.com.br, dpastore@cefet-rj.br, rthome@cefet-rj.br, hyunyang@ime.unicamp.br
Copyright © 2015 by authors and Scientific Research Publishing Inc.
This work is licensed under the Creative Commons Attribution International License (CC BY).
http://creativecommons.org/licenses/by/4.0/


Received 1 May 2015; accepted 12 June 2015; published 15 June 2015
ABSTRACT
This paper introduces a mathematical model which describes the dynamics of the spread of HIV in the human body. This model is comprised of a system of ordinary differential equations that involve susceptible cells, infected cells, HIV, immune cells and immune active cells. The distinguishing feature in the proposed model with respect to other models in the literature is that it takes into account cells that represent two distinct mechanisms of the immune system in the defense against HIV: the non-HIV-activated cells and the HIV-activated cells. With a view at minimizing the side effects of a treatment that employs a drug combination designed to attack the HIV at various stages of its life cycle, we introduce control variables that represent the infected patient’s medication. The optimal control rule that prescribes the medication for a given time period is obtained by means of Pontryagin’s Maximum Principle.
Keywords:
HIV, Mathematical Modelling, Optimal Control, Pontryagin’s Maximum Principle

1. Introduction
Belonging to the family of retroviruses, the Human Immunodeficiency Virus (HIV) is responsible for AIDS. HIV infection results in a chronic, progressive disease that can lead to the destruction of the immune system. The disease is characterized by a high rate of viral replication, which results in the emergence of more virulent variants. HIV infection is currently characterized by the count of CD4+ T cells, by the amount of viral particles in the blood (viral load) and also by the clinical symptoms. Not all patients develop every stage of the disease, and the time elapsed between the infection and the manifestation of different clinical symptoms is highly variable, even though the causes of such a variation remain partly unknown.
To reproduce, HIV joins the membrane of the T4 cell, which is vital to the immune response. The virus releases its RNA and an enzyme, which produces the DNA of the virus. Then, the DNA of the virus enters the nucleus and joins to the DNA of the cell, taking full control. The result of this union is the pro-viral DNA, that produces the messenger RNA, which contains the genetic code of the virus. The messenger RNA then reaches the cytoplasm and produces virions, which leave the host cell as newly formed HIV’s. Thus, when joined to a T4 cell, a single virus produces many potential threats to other cells.
By making quantification possible and unfolding non-trivial equilibrium points, the analysis of viral load in HIV infection has facilitated the management of the disease. It turns out that an exponential decrease in viral levels in plasma can be attained by the reverse transcriptase inhibitors and protease that are included in Anti- retroviral Therapy (ART) [1] [2] .
When HIV viruses invade the human body, they attack the CD4+ T cells in their way. When attacked, these auxiliary cells signal the presence of an invader to other immune cells (CD8+ T cells). The CD8+ T cells then respond to this signal and become Cytotoxic T Lymphocytes (CTL) by attempting to destroy the infected cells [3] - [6] . This process, which is not exploited in typical HIV models, plays an important role in the proposed approach. Indeed, a novel feature of the present work is the introduction of a variable to represent the CD8+ T cells. Such a variable is extremely important to the model, since it enables the decision maker to evaluate the interaction between the CD8+ T cells, CTL and the other variables in the model, such as the virus load.
This work proposes a simple mathematical model to describe the dynamics of the HIV taking into account the immune response. The proposed model introduces changes to several existing models in the literature [7] - [10] . As mentioned above, one such change is the introduction of a new variable to provide a more detailed des- cription of the defense of the immune system. This variable represents the number of unactivated CD8+ T defense cells, which can become activated (i.e. HIV-specific, or CTL) after being warned by some CD4+ T cell. In contrast to the formulation proposed by [4] , which accounts for the activated cells but does not model the activation mechanism, the proposed model keeps track of both the unactivated CD8+ T cells and the activated cells, thus taking into account the dynamics of the activation process.
Even though ART has produced undisputed advances in the treatment of HIV infection, it has been argued that the inhibitors that comprise ART may cause adverse effects; see for example [11] - [13] . Hence, one can argue that a compromise should be reached between the benefits obtained from ART and the adverse effects that it may cause. The ideal treatment should keep the benefits to a maximum degree while also minimizing the adverse effects. It is the development of such a treatment that we address in this paper, making use of the optimal control theory framework. We propose a dynamic model to represent the dynamics of the HIV infection, which takes into account the effects of the ART therapy and introduces control parameters that determine the intensity of the medication. An optimal control problem is then proposed to determine the optimal medication levels in such a way to maximize the benefits of the therapy, while keeping the medication to a minimum efficient level. The side effects assessment is another novelty of the paper, which also strives to provide insights into the effects in the optimal treatment by changing the parameters of the optimal control problem. In order to achieve our goal and minimize the side effects, optimal control theory is applied to the HIV infection model encompassing drug treatments. That, on the other hand, produces a problem whose solution is numerically obtained by standard algorithms, such as the gradient descent method; for more details on these algorithms we refer to [14] . The gradient algorithm makes use of both the solution to the system’s dynamics under a given control sequence, i.e., the medication levels for the complete treatment, and the solution of the co-state equations under the same medication, to generate an improved control sequence, and so on, until convergence is attained. The solutions to both the system’s dynamics and the co-state equations are obtained by means of finite diffe- rence algorithms.
This work is organized as follows. Section 2 introduces the model, while Section 3 derives the trivial equi- librium point and analyzes the stability of the model. Section 4 introduces the optimal control problem, which derives the optimal medication levels. In Section 5, numerical experiments are proposed to illustrate the proposed approach and shed light into the behavior of the controlled system. Finally, Section 6 concludes the paper.
2. Model Formulation
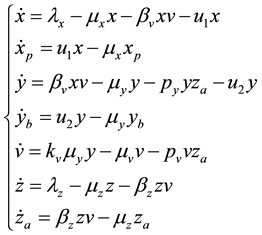
Let x represent the susceptible cells, i.e. the cells that can be infected with HIV, and define y as the cells that are already infected. In addition, assume that v represents the free viruses in the body, z denotes the defense cells (CD8+ T and B) and  corresponds to the activated defense cells, i.e., cytotoxic T cells and plasma (activated CD8+ T and B cells). In the proposed model, the interaction of these variables is represented by the following set of differential equations:
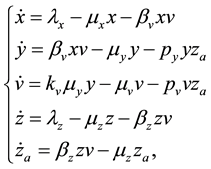 (1)
(1)
with initial conditions: 


The parameters in the above equations are described in Table 3. Note that uninfected cells x are produced at a constant rate , and decay at rate
 . In addition, these cells are infected by the free viruses at rate
 . As for the infected cells y, they are produced from the interaction of their uninfected counterparts and the viruses, at rate
 , decay at rate
  and are eliminated by the activated defense cells at rate
 . Free viruses v are generated from infected cells at rate
 , decay at rate
  and are eliminated by means of the activated defense cells
 , at rate
 . The defense cells, in turn, are generated at a constant rate
 , and decay at rate
 . Furthermore, they become activated by the viruses at rate
 . The activated defense cells are generated from the defense cells in the presence of the virus, at rate
 , and decay at rate
 . It is worth stressing that these cells fight against the infected cells y and the free viruses v, as previously mentioned in the description of the model dynamics.
The virus replication mechanism is depicted in Figure 1. Observe that free viruses (v) and uninfected cells (x, CD4+ T) produce infected cells (y) that, in turn, produce new free viruses. Figure 2 illustrates the activation of the defense cells (z, CD8+ T). Note that they are activated in the presence of free viruses.
In the model, one can notice the introduction of two variables z and  to represent the defense cells (CD8+ T) and the HIV activated defense cells (CTL), respectively. Figure 3 illustrates the action of the activated defense cells, which eliminate infected cells y and free viruses v.
It is worth point out that, in the proposed model, the immune CTL cells are activated directly by the free viruses. In contrast, some previous works in the literature assume they are activated by infected cells, healthy cells and also CTL cells [15] . Observe that this is a simplification of the proposed model, which takes advantage of the fact that all elements that act to activate the immune CTL cells are mediated directly or indirectly by the virus. This hypothesis in our model simplifies the complex phenomena of activation and inactivation of the immune system by cytokines and dendritic cells (antigen presenting cells) [15] . Such a simplification is very useful in the optimal control formulation, which results in a larger and more complex set of equations.
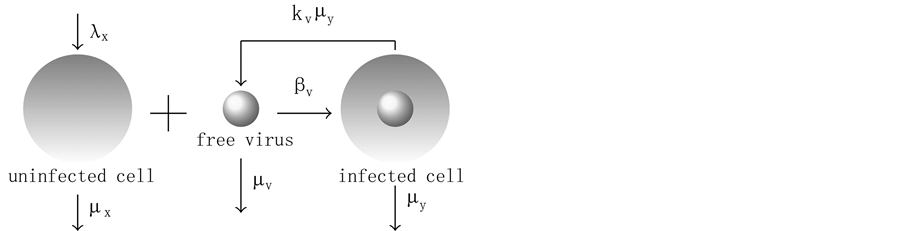
Figure 1. Virus replication.
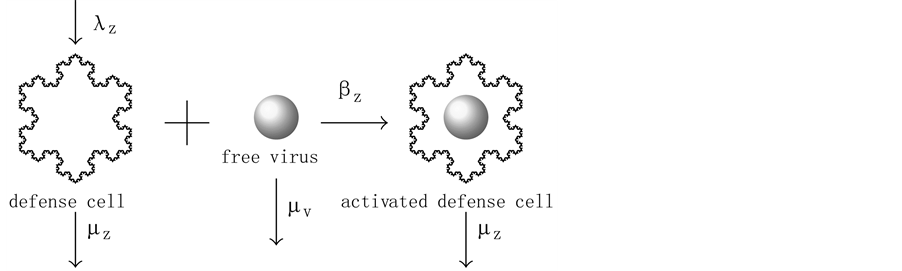
Figure 2. CD8+ T response.
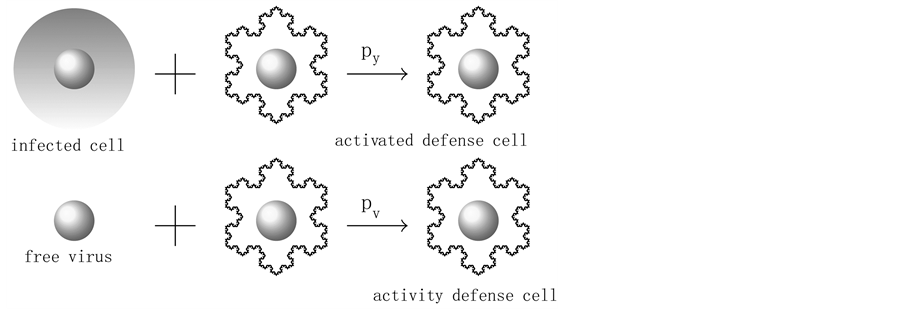
Figure 3. CTL response.
3. Equilibrium Points and Stability
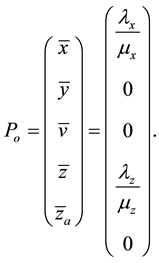
3.1. Trivial Equilibrium Point
For a non-HIV-infected person,  (not virus), it is logical to conclude that we have no infected cells
  and no activated defense cells
 . Upon fixing these values in (1) and solving for the remaining unknowns, one finds the trivial equilibrium point of the dynamic system in Equation (1), described below:
 (2)
(2)
3.2. Stability of Trivial Equilibrium Point
By Hartman-Grobman’s theorem [16] , one can say that an equilibrium point is stable if the sign of the real part of the eigenvalues of the Jacobian matrix, evaluated at this point, is negative. Making use of this theorem, it is possible to show that if the basic reproduction number of the virus  is less than one unit, the trivial equi- librium point
  in (2) is stable. In such a scenario the infection does not propagate in the human body.
The Jacobian matrix of the system (1),  , is given by:
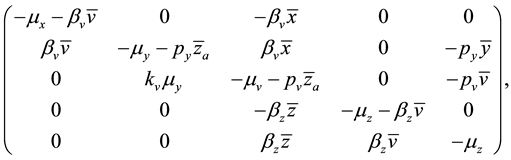 (3)
(3)
evaluated at values corresponding to the equilibrium points.
The Jacobian matrix evaluated at the point of trivial equilibrium (2) is given by:
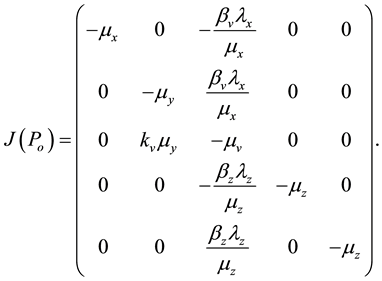 (4)
(4)
The eigenvalues of the matrix  are the roots r of the characteristic polynomial
  given by:
 (5)
(5)
It can be noted that  and
and  are negative eigenvalues of the Jacobian matrix
 . The other eigenvalues are obtained through the solution of the quadratic equation given by:

i.e.,
 (6)
(6)
Applying Routh-Hurwitz criterion [17] , one can see that the system is stable if the last term in Equation (6) is positive. Hence, the system is stable if
 (7)
(7)
Lets assume that one virus infects one person. During its average survival time , the possibility of en-
countering and infecting one target cell  in a completely susceptible population of CD4+ T cells
  is
is . This infected cell, releases on average
  viruses. Hence,
  is the average number of secondary
viruses produced by one virus infecting a cell in a completely susceptible population of CD4+ T cells.
 (8)
(8)
So, if  (basic reproduction number of the virus), as it can be seen in (7), the trivial equilibrium point
  given in (2) is stable. That is, in this case, the infection does not propagate in the body.
3.3. Non-Trivial Equilibrium Points
Equating to zero all the differential equations given in (1), one comes up to the following general formulation for the equilibrium points of the dynamical system:
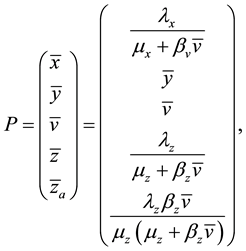 (9)
(9)
where:
 (10)
(10)
or
 (11)
(11)
It is possible to observe that when  in (9), and (10) or (11), we obtain the trivial equilibrium point given in (2). However, if
 , i.e, for an HIV infected individual, equaling Equation (10) and (11) it is possible to obtain, after some numerical manipulation, the following polynomial equation of degree 3:
 (12)
(12)
where the coefficients are:
 (13)
(13)
 (14)
(14)
 (15)
(15)
 (16)
(16)
The coefficients of Equation (12) are positive when , implying that there is no positive solution; hence
  is a solution. When
 ,
,  , and as
  increases, the coefficient
  becomes negative, followed by
 . Hence, for
 , a unique change of sign occurs between successive coefficients, and according to Descartes rule of signs, there is a unique positive solution.
4. Optimal Control Formulation
In order to study the effect of treating HIV infection with the use of a cocktail of drugs, we introduce two control variables ( and
and ) in the dynamic system described in Equation (1). The control variable
  represents the effect of inhibitors of reverse transcriptase, integrase and input. These drugs protect the uninfected cells x, preventing their infection, i.e., keeping them from turning into infected cells y. To account for this effect, we introduce in the basic model of Equation (1) a new state variable
 , which represents the cells that are protected by the action of the inhibitors. The control variable
  simulates the effect of the protease inhibitor, which blocks infected cells y, preventing them from releasing new viruses v in the body. To account for this action, we introduce a new variable
  in our model. This variable describes the infected cells that are blocked by the action of the protease inhibitor. With the modifications described above, the studied dynamic system (1) can be reformulated as:
 (17)
(17)
The initial conditions were obtained by running the uncontrolled model from Equation (1) for a period of 365 days. Note that the second and fourth equations are decoupled.
We point out that  and
and  are dynamic variables in continuous time, which prescribe the medication dosages at each time
 , where T is the total length of the planned treatment. Thus,
  represents the dosage of inhibitors of reverse transcriptase, integrase and input at time
 ; whereas
  indi- cates the dosage of the protease inhibitor at time
 . To simplify the treatment, doctors can apply a sub- optimal treatment, with regular dosages of medication corresponding to the combined medication prescribed by continuous variables
  and
and  for each regular interval. For example, if the treatment is prescribed daily for a period of 365 days, the sub-optimal treatment would be comprised of a discrete sequence of dosages
  and
and , such that
 (18)
(18)
Alternatively, doctors could prescribe average values of the sequences  and
and  over predetermined inter- vals, such as monthly intervals for example, re-evaluating the treatment between successive intervals.
Observe that, if the dosages  and
and  were to be kept constant, one could replace
  for
for  and
and  for
for  in terms involving
  and
and , and all the results regarding the equilibrium points and their stability obtained in the foregoing section would be retrieved here. In that case, the number of primary virus replication after treatment (control), represented by
 , is given by:
 (19)
(19)
Note that the terms multiplying  in the above equation arise due to the (now constant) control variables
 , and
, and . Note also that, if
  (no treatment), then
 , where
  was defined in (8).
In the remainder of this paper, we analyze the system’s dynamics with  and
and  varying over time, and strive to obtain an optimal treatment, prescribing the values of these variables at each time in such a way that an optimal compromise between the efficiency of the treatment and its side effects is obtained.
It is worth reinforcing that, in relation to typical HIV models that simulate the production rates and infect- ability of the virus, the proposed model includes two new variables in the dynamics: protected uninfected cells  and blocked infected cells
 , which do not release new viruses. This modeling choices are explained partly by the fact that the antiretroviral treatment stops the cell transcription process. The cell becomes healthy and the virus is destroyed, but that happens only after the contact between the cell and the virus. Bearing that in mind, instead of having the control be set in the infection force by a mass action law, we assume that the cells became resistant to infection (or protected). We also assume that the effect of the protease inhibitor is to prevent the release of viable viruses. Consequently, only infected but untreated cells release viable viruses. Upon being treated, the infected cell becomes blocked and does not release viable viruses thereafter.
The introduction of the new variables, namely protected uninfected cells  and blocked infected cells
 , allows a better understanding of the dynamics. Moreover, taking into account the number of such cells is important to assess the effects of the prescribed treatment. Another innovation is the introduction of the control variables, which enables us to model the compromise between medication and side-effects.
Observing the model we note that the defense cells CD8+ T (z) produce the activated cells CTL , while the latter contribute to the reduction of infected cells (y) and free viruses (v). Moreover, the control variable
 , corresponding to the reverse transcriptase inhibitor, protects the cells CD4+ T (x) from being infected, thus producing protected cells
 . In addition, the control variable
  corresponds to the integrase inhibitor and keeps the infected cells y from producing viruses v. The infected cells under the effect of this inhibitor are called blocked cells, and are denoted by
 . Table 1 provides a description of the variables that were added to the model. Figure 4 illustrates the dynamics of the system described by Equation (17).
4.1. Objective Function
System (17) is now optimized with respect to control parameters  and
and . For this reason, both are allowed to vary with time. To reach a compromise between medication and side effects, we introduce an optimal control problem aimed at maximizing the number of protected cells while also mitigating the side effects. The optimal control problem is defined as follows:
 (20)
(20)
In the expression above,  ,
,  and
and  are non-negative scalars. The functional J in equation (20) has the following objective: we maximize the protected cells
  while also trying to minimize the drug admini- strations (
 and
and ). We are assuming that the higher
  and
and , the higher the side effects.
4.2. The Hamiltonian
To find the optimal control variables  and
and  that solve Problem (20), we make use of Pontryagin’s maximum

Table 1. New variables after control.
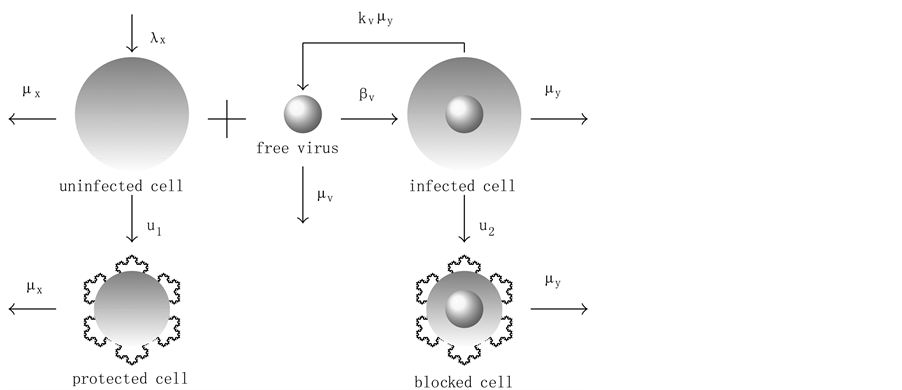
Figure 4. Virus replication with antiretroviral therapies.
principle [14] [18] [19] , and derive the Hamiltonian of our optimal control problem, which is given by:
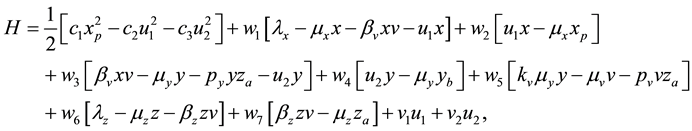
where , are the co-state variables, that determine the adjoint systems. It is well known that the optimal solution must satisfy both the original and the adjoint system of equations.The variables
  and
and  are penalty multipliers (slack variables), added to the model to ensure that the constraints
  and
and  are satisfied. For the optimal controls
  and
and , it holds that
  and
and . In the remainder of this section, we will consider all possible values for the control variables, including the lower limits
  and
and .
.
1) Considering the set: 
It follows from Pontryagin’s maximum principle that the optimal control variables  and
and  must satisfy:

Then,
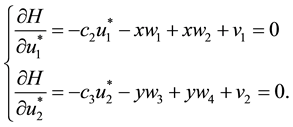
Thus, isolating  and
and , we obtain,
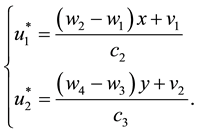 (21)
(21)
As in this case we necessarily have , since
 , the optimal control can be expressed as:
 (22)
(22)
2) Considering the set: 
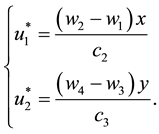
It follows from Equation (21), that
 (23)
(23)
Since, by definition,  and
and , it follows from Equation (23) that
 (24)
(24)
Therefore, to ensure that  and
and  do not take negative values, we summarize the results obtained in (22) and (24) by:
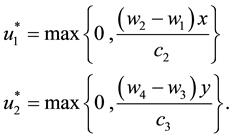 (25)
(25)
Hence, the optimal control for Problem (20) is characterized by (25).
4.3. The Co-State Equations
The necessary conditions of the Pontryagin’s maximum principle [14] also establish that the adjoint variables satisfy:
 (26)
(26)
Finally, we analyze the conditions of transversality. In our case, there is no terminal value for the state variables. Therefore, the transversal conditions to the adjoint variables are given by

Observe that the optimal control values in (25) depend directly on the co-state variables and, through these variables, on the dynamics described in (17). Hence, they cannot be analytically determined. Consequently, to solve Problem (20), one searches for optimal control values  and
and  that simultaneously solve the initial value problem in Equation (17) and the final value problem in Equation (26). In this paper, we find the optimal control trajectories iteratively, employing a classical specialized gradient algorithm [14] and solve the diffe- rential equation systems by means of finite difference methods.
5. Numerical Results
For the numerical simulations we have used the dataset described in Table 2 and Table 3, which was also studied in [8] [9] [20] . For this data set, the reproduction number  indicates an infection.
5.1. The Uncontrolled System
Figure 5 conveys a numerical simulation of the uncontrolled model in Equation (1), solved by means of the Finite Difference Method, for a one year period. Note that the solution represents the typical behavior of the immune system in the presence of HIV [9] [21] - [23] . The system rapidly approaches the non-trivial equilibrium point.
In Figure 5, one can see a steep increase in the number of viruses and infected cells in the first month. In contrast, the number of susceptible cells presents a substantial decrease over the same period. In the subsequent
Table 2. Initial conditions.
Table 3. Parameters.
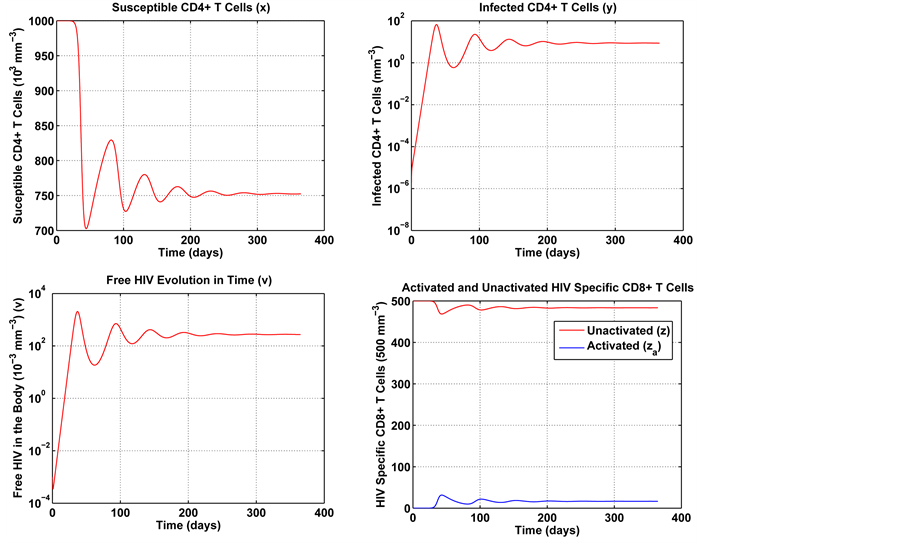
Figure 5. Numerical experiment without control.
periods, these variables stabilize and gradually approach a non-trivial equilibrium point. As previously men- tioned, the proposed model describes the typical behavior of the immune system in the presence of HIV. The difference is that it also allows a separate analysis of the activated defense cells. In Figure 5, one can notice a migration of immune cells into the compartment of activated defense cells. We believe that this could lead, over the years, to the saturation of the immune system. Furthermore, the results seem to suggest a trend for a regular non-trivial dynamical system balance.
5.2. Adding Medication: The Optimal Control Problem
The optimal control problem in Equation (20) was solved for a one year treatment period. The initial condition for the state variables was obtained by running the uncontrolled system in Equation (1) for a one year period. The last value of each variable (after 365 days) was taken as the initial value for the same variable in the controlled problem. In this work, we first consider Case 1, with ,
,  and
and , which will be used as our benchmark for model evaluation. Note that, under such parameters, the objective function in (20) evaluates the number of protected cells versus the side effects attained from the medication to be taken to accomplish such a number. The small value of
  is due to the large number of immune cells, which render the first term in Equation (20) quite significant. The optimal trajectories of the system for the selected parameters are depicted in Figure 6.
Note in Figure 6 that the first week of treatment causes a substantial decrease in the unprotected (susceptible) CD4+ T cells, with an increase in the number of protected cells. That is because the treatment makes most of these cells become protected cells. Note that, since the medication efficiently fights the infection, the number of HIV-specific CD8+ T cells can be reduced with respect to the uncontrolled dynamics in Figure 5. That leaves the imune system free to combat other infections. With regards to the infected cells, blocked and unblocked, they rapidly vanish. Note that the unblocked cells vanish more rapidly than their blocked counterparts. Note also that the number of remaining viruses rapidly decays to zero, its trivial equilibrium point. It is also noteworthy that the optimal dosage of the transcriptase inhibitor  is significantly higher than that of the integrase inhibitor
 . In the next section we verify how the variation in the parameters of the optimal control problem affects the dynamics. It is also noteworthy that the medication levels are much higher in the early treatment period, and are stabilized to lower levels in a very short time span.
5.3. Sensitivity Analysis
In this section we examine the effects of the parameters of the optimal control problem in Equation (20). We vary the parameters  and
and  and verify the effects of the variations in the controlled system dynamics. The
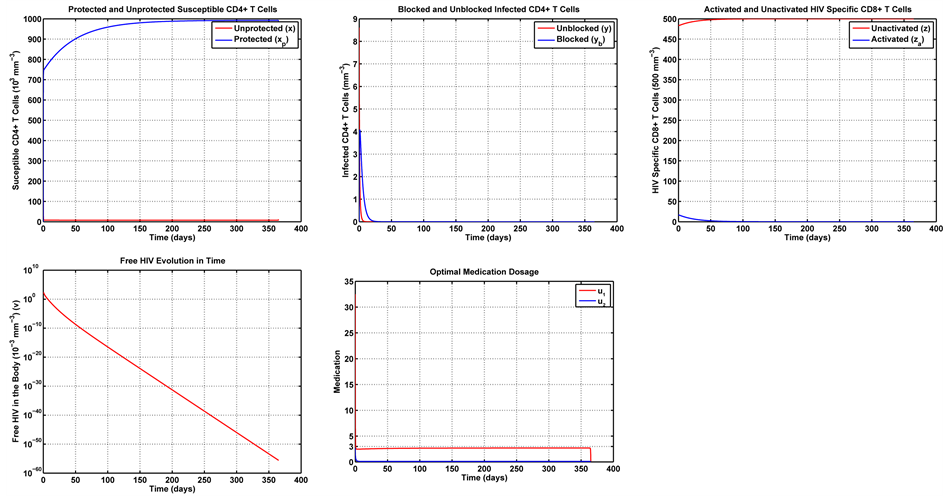
Figure 6. Optimal trajectories for Case 1: .
.
objective is to verify the implications of different compromises between immune response and side effects into the medication levels as time elapses.
In Case 2, we examine the influence of parameter , making
 ,
,  and
and . In this case, we assume that the reverse transcriptase inhibitor presents more side effects than the protease inhibitor, thus causing an augmented value of
  with respect to Case 1. The results are conveyed in Figure 7. It can be noted that, with the increase of
  there is a decrease in both the number of protected cells
  and unprotected cells (x). The evolution of the virus shows that, in this case, the viruses get extinct more slowly than in Case 1. The same applies to the infected cells y and
 . Apparently, the changes do not cause significant changes in the values of z and
 . With regards to the control variables, i.e. the medication levels, the levels of
  are reduced in this example.
In Case 3 we make ,
,  and
and , assuming that
  produces more side effects than
 . The results are depicted in Figure 8. One notes that the viruses get extinct slightly slower than in Case 1, with the same applying to infected cells y. Once again, the changes do not cause significant changes in the values of z and
 . The medication levels
  and
and  are similar to those in Case 1. The increase in
  does not seem to affect the levels of
  significantly, for these levels were already very reduced in Case 1.
In Case 4 we make  and
and . In this case, in addition to
  being very harmful, we assume that
  has reduced side effects. The results are presented in Figure 9. One notices that the dynamics of the system remains similar to that in the other cases. One difference is that the viruses and the unblocked infected cells y get extinct much faster. Another significant difference is that, in this case, the levels of
  exceed those of
 .
.
6. Concluding Remarks
This paper introduces a novel model of HIV dynamics. In contrast to typical HIV dynamics models, the pro- posed model explicitly describes the protected CD4+ T cells and the HIV-specific CD8+ T cells. That allows us to explicitly understand and quantify these effects, thus providing a better understanding of the system’s dynamics.
The dynamics of the proposed model can be influenced by the use of Anti-retroviral Therapy (ART), which has produced significant advances in the treatment of HIV infection. Such a therapy, however, is associated to side effects, which should be avoided whenever possible. To take account of the side effects and produce a desirable compromise between treatment effectiveness and side effects, we propose an optimal control approach
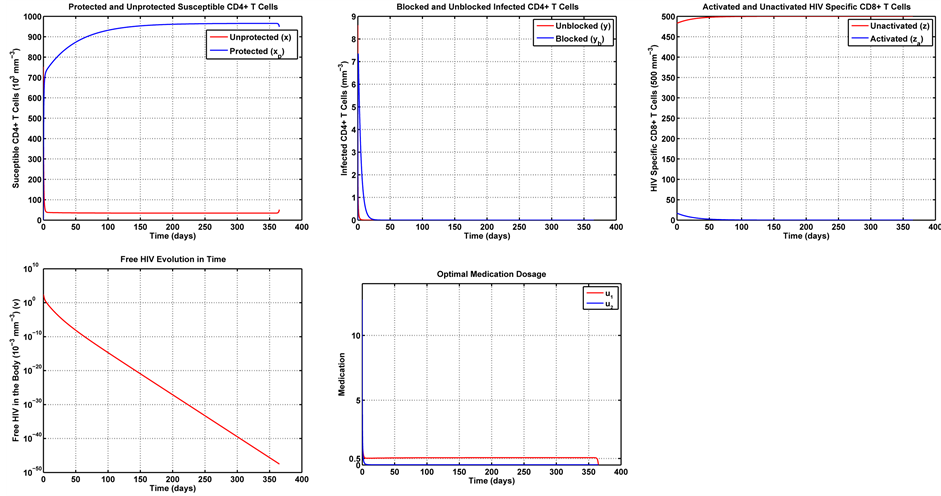
Figure 7. Optimal trajectories for Case 2: .
.
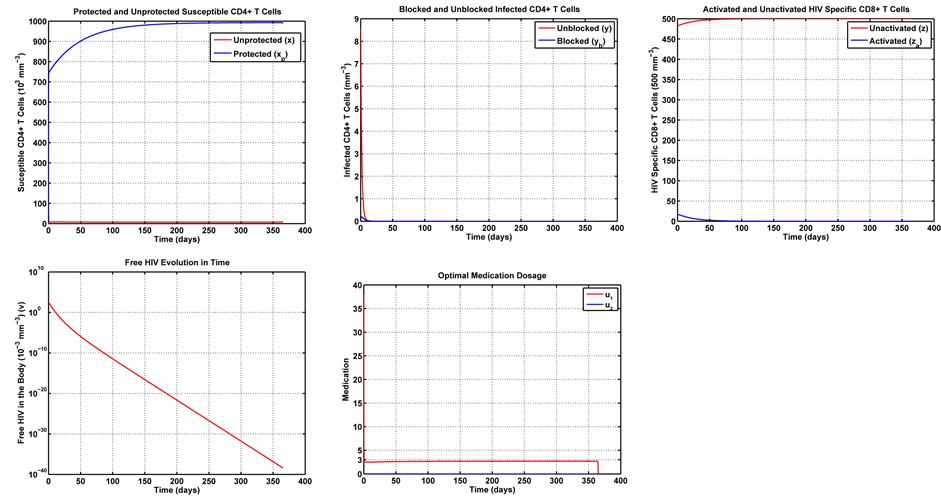
Figure 8. Optimal trajectories for Case 3: .
.
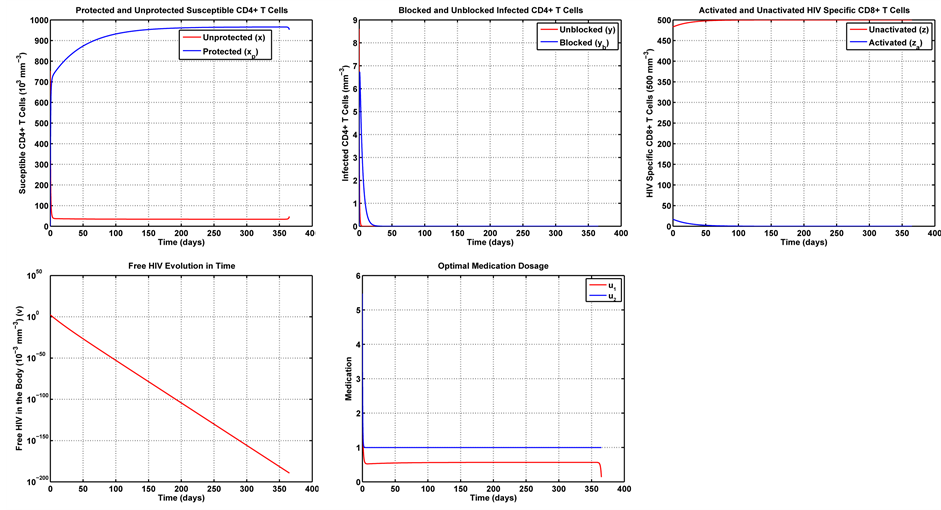
Figure 9. Optimal trajectories for Case 4: .
.
which prescribes an optimal treatment aimed at maximizing the benefits of the treatment, while also minimizing the side effects. The optimal control problem is solved by means of Pontryagin’s maximum principle and the optimal medication levels are numerically found by a standard gradient algorithm.
The proposed optimal control formulation is analyzed in the light of selected numerical examples, which provide insight into the behavior of the system under different compromises between medication effectiveness and side effects. We evaluate the sensitivity of the method with respect to the parameters in the optimal control functional by means of a series of examples, which shed light on the optimal trajectories of the variables with respect to different compromises between efficiency and side-effects. We analyze four different cases with distinct levels of side effect introduced by drugs  and
and , which give rise to different treatment policies that take into account the prescribed compromises between these side effects, with a view at keeping the drug benefits while keeping the side effects to the minimum.
Acknowledgements
The authors would like to thank FAPESP (Projeto temático Fapesp, 09/15098-0), and the Carlos Chagas Filho Foundation for Research Support of the State of Rio de Janeiro, FAPERJ, for supporting the research by means of grants APQ1 E-26/111.940/2012, E-26/110.379/2014 and E-26/110.087/2014. This work was partially sup- ported by the Coordination for the Improvement of Higher Education Personnel of Brazil―CAPES, under grant No. BEX2025/14-0, and by the National Council for Scientific and Technological Development―CNPq, under grant No.302716/2011-4.
References
- Eisele, E. and Siliciano, R. (2012) Redefining the Viral Reservoirs That Prevent HIV-1 Eradication. Immunity, 37, 377- 388. http://dx.doi.org/10.1016/j.immuni.2012.08.010
- Finzi, D., Blankson, J., Siliciano, J., Margolick, J., Chadwick, K., Pierson, T., Smith, K., Lisziewicz, J., Lori, F., Flexner, C., Quinn, T., Chaisson, R., Rosenberg, E., Walker, B., Gange, S., Gallant, J. and Siliciano, R. (1999) Latent Infection of CD4+ T Cells Provides a Mechanism for Lifelong Persistence of HIV-1, Even in Patients on Effective Combination Therapy. Nature Medicine, 5, 512-517. http://dx.doi.org/10.1038/8394
- Balamurali, M., Petravic, J., Loh, L., Alcantara, S., Kent, S.J. and Davenport, M.P. (2010) Does Cytolysis by CD8+ T Cells Drive Immune Escape in HIV Infection? The Journal of Immunology, 185, 5093-5101. http://dx.doi.org/10.4049/jimmunol.1002204
- Nowak, M. and Bangham, C. (1996) Population Dynamics of Immune Responses to Persistent Viruses. Science, 272, 74-79. http://dx.doi.org/10.1126/science.272.5258.74
- Perelson, A. (2002) Modelling Viral and Immune System Dynamics. Nature Reviews Immunology, 2, 28-36. http://dx.doi.org/10.1038/nri700
- Siewe, B., Wallace, J., Rygielski, S., Stapleton, J.T., Martin, J., Deeks, S.G. and Landay, A. (2014) Regulatory B Cells Inhibit Cytotoxic t Lymphocyte (CTL) Activity and Elimination of Infected CD4 T Cells after in Vitro Reactivation of HIV Latent Reservoirs. PLoS ONE, 9, e92934. http://dx.doi.org/10.1371/journal.pone.0092934
- Grégio, J., Caetano, M. and Yoneyama, T. (2009) State Estimation and Optimal Long Period Clinical Treatment of HIV Seropositive Patients. Anais da Academia Brasileira de Ciências, 81, 3-12. http://dx.doi.org/10.1590/S0001-37652009000100002
- Nowak, M. and May, R. (2000) Virus Dynamics: Mathematical Principles of Immunology and Virology. Oxford University Press, Oxford.
- Perelson, A. and Nelson, P. (1999) Mathematical Analysis of HIV-1 Dynamics in Vivo. SIAM Review, 41, 3-44. http://dx.doi.org/10.1137/S0036144598335107
- Perelson, A. and Ribeiro, R. (2013) Modeling the Within-Host Dynamics of HIV Infection. BMC Biology, 11, 96. http://dx.doi.org/10.1186/1741-7007-11-96
- Daugas, E. and Rougier, J. (2005) HAART-Related Nephropathies in HIV-Infected Patients. Kidney International, 67, 393-403. http://dx.doi.org/10.1111/j.1523-1755.2005.67096.x
- Sreenivasan, S. and Dasegowda, V. (2010) Adverse Effects after HAART Initiation in Resource-Limited Settings: A Prospective Study from Mysore, India. The Journal of Infection in Developing Countries, 4, 750-753. http://dx.doi.org/10.3855/jidc.934
- Torres, R. and Lewis, W. (2014) Aging and HIV/AIDS: Pathogenetic Role of Therapeutic Side Effects. Laboratory Investigation, 94, 120-128. http://dx.doi.org/10.1038/labinvest.2013.142
- Kirk, D. (1970) Optimal Control Theory: An Introduction. Prentice-Hall, Englewood Cliff.
- Adkinson Jr., N.F., Bochner, B.S., Busse, W.W., Holgate, S.T., Lemanske, R.F. and Simons, F.E. (2003) Middleton’s Allergy―Principles and Practice. Vol. 1, Mosby, Philadelphia.
- Kreysig, E. (1978) Introductory Functional Analysis with Applications. Wiley, New York.
- Dorf, R.C. and Bishop, R.H. (2001) Modern Control Systems. 9th Edition, Prentice Hall, Upper Saddle River.
- Lewis, F. and Syrmos, V. (1995) Optimal Control. John Wiley and Sons, New York.
- Pontryagin, L., Boltyanskij, V., GamKrelidze, R. and Mishchenko, E. (1961) The Mathematical Theory of Optimal Processes. Interscience Publishers, New York.
- Mclean, A. (2013) Infectious Disease Modeling. In: Kanki, P. and Grmes, D.J., Eds., Infectious Diseases, Springer, New York, 99-115. http://dx.doi.org/10.1007/978-1-4614-5719-0_5
- Chun, T., Carruth, L., Finzi, D., Shen, X., Digiuseppe, J., Taylor, H., Hermankova, M., Chadwick, K., Margolick, J., Kuo, Y., Brookmeyer, R., Zeiger, M., Barditch-Crovo, P. and Siliciano, R. (1997) Quantification of Latent Tissue Reservoirs and Total Body Viral Load in HIV-1 Infection. Nature, 387, 183-188. http://dx.doi.org/10.1038/387183a0
- Ho, P., Neumann, A., Perelson, A., Chew, W., Leonardo, J. and Markowitz, M. (1995) Rapid Turnover of Plasma Virions and CD4 Lymphocytes in HIV-1 Infection. Nature, 373, 123-126. http://dx.doi.org/10.1038/373123a0
- Lafeuillade, A., Poggi, C., Profizi, N., Tamalet, C. and Costes, O. (1996) Human Immunodeficiency Virus Type 1 in Lymph Nodes Compared with Plasma. Journal of Infectious Diseases, 174, 404-407. http://dx.doi.org/10.1093/infdis/174.2.404