Applied Mathematics
Vol.06 No.02(2015), Article ID:54269,6 pages
10.4236/am.2015.62041
Temperature Fluctuations in Photoionized Nebulae in Case of Oxygen and Nitrogen Abundances
S. Belay Goshu1, Derck P. Smits2
1Department of Physics, Dire-Dawa University, Dire-Dawa, Ethiopia
2Department of Mathematics, Astronomy and Computing Science, UniSA, Pretoria, South Africa
Email: belaysitotaw@gmail.com, Smitsdp@unisa.ac.za
Copyright © 2015 by authors and Scientific Research Publishing Inc.
This work is licensed under the Creative Commons Attribution International License (CC BY).
http://creativecommons.org/licenses/by/4.0/


Received 5 February 2015; accepted 24 February 2015; published 27 February 2015
ABSTRACT
We present the dependence of electron temperature fluctuations of O++ and H+ by the chemical abundances of oxygen and nitrogen. Models assume that hydrogen density is uniform in one case and non uniform in the second case, which vary with the distance from the central star. The abundances of oxygen and nitrogen change by scale factor 5 and 1/5. Our analysis suggests that temperature fluctuations are consistent with photoionization. Using the cloudy photoionization code, we found a reasonable close agreement of the computed value with the one that was done before this work. Our simulation also shows that how change of abundances affects temperature fluctuations and its value is less than 0.01.
Keywords:
H II Region, Planetary Nebulae, Abundances

1. Introduction
Accurate abundances of heavy metals are essential for solving astrophysical problems, including stellar and galactic chemical evolution. This was tested by different authors like [1] . The problem of the existence of temperature fluctuations in H II regions was first noted by [2] , suggested that those measured in ionized gaseous nebulae depend on the ionization radiation field, hydrogen density and elemental abundances.
The gas temperature obtained from the observed O[III] line ratio is greater than the one from the Balmer discontinuity [3] . Different authors like [4] [5] tried to estimate the value of temperature fluctuations t2 on photoionization in H II region. These values in H II region varying from 0.02 to 0.09 were found and yielded significant effects on element abundances.
The abundance determination in H II region and the planetary nebula have positive impacts of temperature fluctuations given by [2] . The abundances of H, He, C, O, N, Ne, S, and Ar are included to determine the temperature fluctuations of electron by changing the abundances of oxygen and nitrogen elements by scale factor 5 and 0.2. These are the most important elements which have a great impact on cooling.
Cloudy is an impressive code offering a vast amount of possibilities to model wide variety of objects. The contents of physics and the basic numerical framework of the codes are explained in the documents given by [6] with the version of C10.00 to explain all the phenomena.
In this paper, we will try to analyze the effect of hydrogen density and chemical abundances on temperature structure of electrons and its temperature fluctuations of both hydrogen and oxygen ions. In §2, we present the problem formulation of temperature fluctuations. In §3 we describe the models and present our calculations. In §4 we present the results and finally we present the conclusion.
2. Formulation of the Problem
Temperature in homogeneities on the emission lines, based on statistical approximation introduced by [2] , which quantifies the brightness increase or decrease of each line in terms of the departure of the temperature from the average temperature T0 and is given by
 (1)
(1)
For homogeneous metalicity nebulae characterized by small temperature in homogeneities, ne is the electron density, T is the electron temperature, and V is the volume over which the integration is carried out. The rms amplitude t of the temperature in homogeneities is defined as
 (2)
(2)
We simplified the expression presented by [2] , in which t2 depends on the density of ionic species considered while in the above equation. We implicitly consider only ionized H (by setting ).
).
The nature of temperature fluctuations is one of the important question in nebular astrophysics. CLOUDY predicts that they should be very small because of the abundance of cooling function of temperature, while some observations indicate a very large value of t2 [7] . Density fluctuations could be a source of temperature fluctuations, due to increased collisional deexcitation in zones of higher density, but photoionization models including such density fluctuations also fail to return large enough values of t2 [1] and [8] .
3. Model Parameters
We consider two different models for this photoionized region in H II regions. The first one correspond to a dense nebulae ionized by a star that is very hot and its temperature is  = 75,000 K and its density n(H) = 104 cm−3. The second correspond to a more diluted nebulae ionized by a hot star. We assumed the density of the gas in neutral medium within the galaxy is that of power law decrease in the gas density with the distance from the center given by
 (3)
(3)
where no is the gas density at r = ro and ro is the scale length describing the rate of decay of this with radius. We have chosen hydrogen density, n(H) = 103 cm−3, change by , and
, and  = 105 K. The stars are assumed to radiate as a blackbody. The inner radius of the nebulae is chosen to be 1016 cm for the former case and 5 × 1016 cm for the latter one. In both cases we assume that the total number of H Lyman continuum photons emitted by the star, Q(H) = 1048 photons per second and the filling factor is unit.
An additional set of a nebular parameters is the chemical composition of gas, usually taken to be 105, 776, 437, 182, 110, 75, and 36 atoms of He, C, O, N, Ne, S, and Ar, respectively per 106 H atoms is shown in Table 1. This is taken from the average composition of elements are taken from [9] , whereas the chemical composition of Ar and S are taken from the solar composition given by [10] . The most important of these abundances are that of C, O, which we assume that these elements as the principal coolant [11] and [12] . This model is constructed with different values of oxygen and nitrogen. To investigate the temperature fluctuations of electron, we vary the total abundances of both oxygen and nitrogen by scale factor 5 and 1/5 to test separately. When the abundance of oxygen vary by scale factor 5 and 1/5 in H II region helps to estimate temperature of electron and very useful for obtaining estimates of abundance gradients in spiral galaxies and of oxygen abundances of star- forming regions in the distant universe [13] . The parameters are given in Table 2 and Table 3.
4. Result and Discussion
We can easily observe from the result given in Table 4 and Table 5, variations of temperature with inhomogeneities abundances of O and N. This result of this paper strongly suggests that abundances change produce temperature fluctuations. When the abundances of O rises by scale factor 5, the magnitude of its temperature is

Table 1. Elemental abundances used in the nebular model.
Table 2. First model parameters.
Table 3. Second model parameters.
Table 4. Elemental abundances used in the model and the result obtained.
lower than the normal abundances given by [9] . Whereas the abundances decreases by scale factor 1/5, its peak temperature greater than the normal one. Similarly, when the abundances increases, t2 ≈ 0.007 whereas t2 ≈ 0.004 when the O abundances decrease by scale factor 1/5. This result shows that there is slight variation with the result obtained by [3] for uniform density distribution. This shows that when the abundances increases, its temperature fluctuations increases. In similar way T(O++), the rise of the abundances and temperature of ionized O are in the contrary. When it increases by scale factor its temperature is 7430 K and drops by 1/5, its temperature rises to 11,200 K.
When the abundances of O is increased by a scale factor 5, the temperature of H (T(H+)) is decreased by 26.5% and its temperature fluctuation t2(O++) is slightly increased by 0.001. But it drops by scale factor 1/5, temperature of H rises to 10 900 K and its fluctuation is t2(H+) = 0.004.
Similarly, when the abundance of nitrogen increases by scale factor 5, its temperature of T(O++) decreases by 3.7%. This is much smaller than the previous one. Its temperature fluctuation t2(H+) of H and O when the abundances of N increases by scale factor 5 are 0.05 and 0.0032 respectively. But when the abundance of nitrogen drops by scale factor 1/5, its temperature is slightly greater than the normal abundances given by [9] .
In the first model, we have more diluted nebulae ionized by a hot star. We have chosen hydrogen density n(H) = 104 cm−3, change by , and
, and  = 75,000 K. The result is shown in Figure 1 describes the
Table 5. Elemental abundances used in the this model and the result obtained.
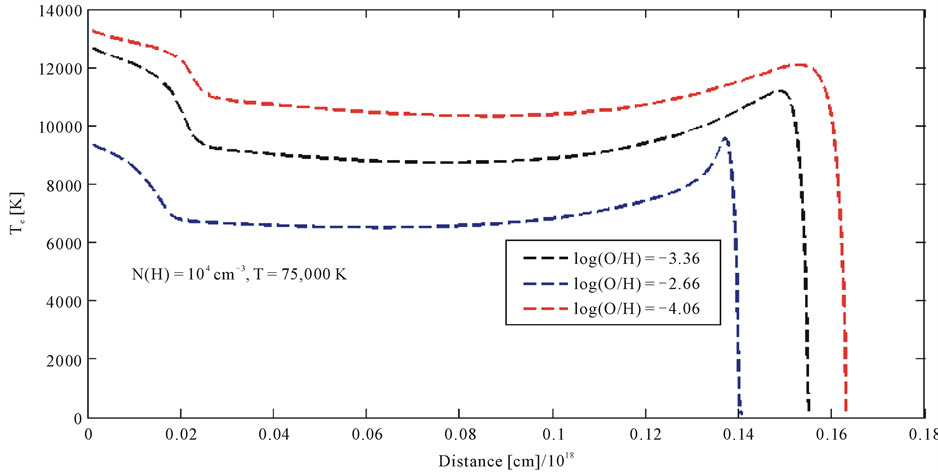
Figure 1. Temperature structure for the first model. Green broken line is the abundances of oxygen increase by scale factor 5, whereas black dot line is the abundances decrease by scale factor 1/5 and red broken line is for the normal abundances given by [9] ,  = 75,000 K, and n(H) = 103, α = −0.5.
temperature of electrons drops when the abundances of the most cooling elements increase by scale factor 5. The higher the abundances of oxygen elements, its peak temperature drops faster than the other two cases. Similarly the abundances of nitrogen shown in Figure 2 increase by the scale factor 5, its variation of temperature fluctuation is significant relative to oxygen abundances. But this does not mean that, nitrogen abundances have not impacts on changing the temperature. At a distance around 0.145 pc, the variations of temperature are high relative to other points.
In the second model, we have more diluted nebulae ionized by a hot star and we have chosen hydrogen density n(H) = 103 cm−3, change by , and
, and  = 105 K. The result shown in Figure 3 and Figure 4
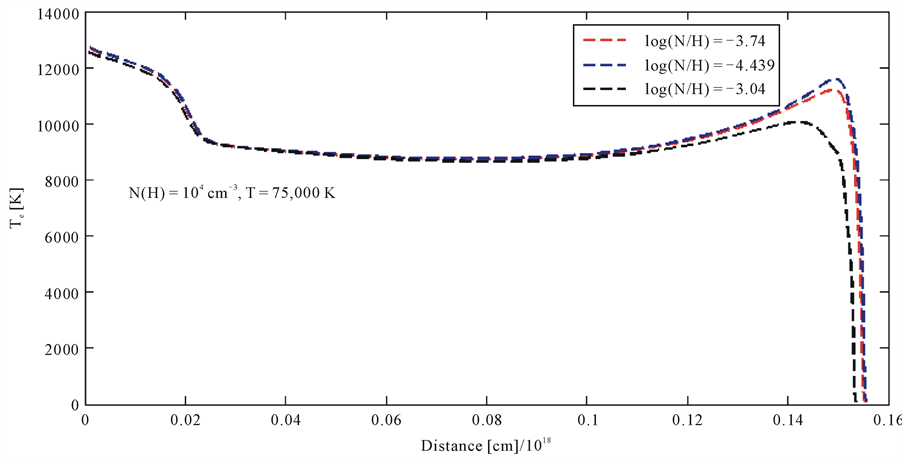
Figure 2. Temperature structure for the first model. Green broken line is the abundances of nitrogen decrease by scale factor 1/5, whereas black dot line is the abundances increase by scale factor 5 and red broken line is for the normal abundances given by [9]  = 75,000 K, and n(H) = 103, α = −0.5.
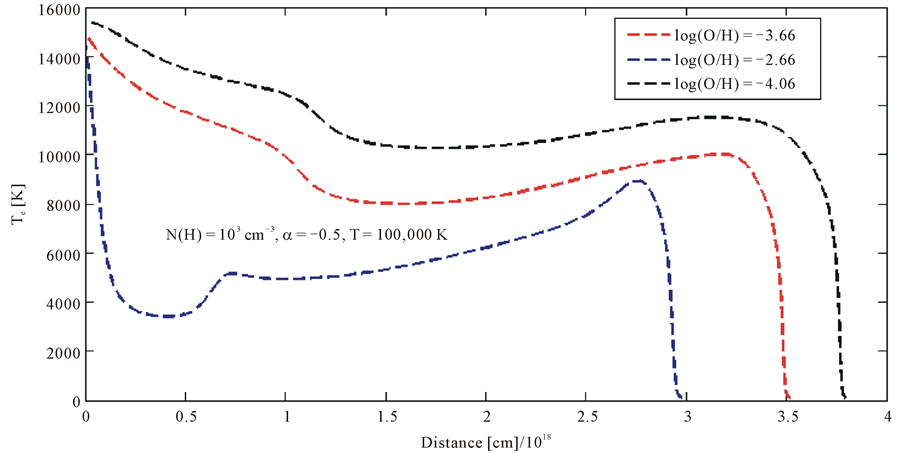
Figure 3. Temperature structure for the second model. Green broken line is the abundances of oxygen increase by scale factor 5, whereas black dot line is the abundances decrease by scale factor 1/5 and red broken line is for the normal abundances given by [9] ,  = 100,000 K, and n(H) = 104.
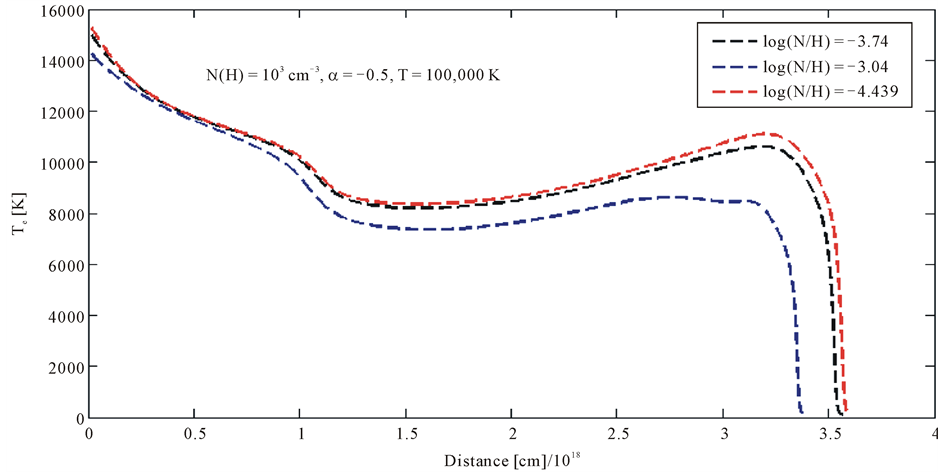
Figure 4. Temperature structure for the first model. Green broken line is the abundances of oxygen increase by scale factor 5, whereas black dot line is the abundances decrease by scale factor 1/5 and red broken line is for the normal abundances given by [9] ,  = 100,000 K, and n(H) = 104.
describe the temperature of electron is greatest when the abundances of both O and N are smallest. Since these elements are the main cooling agents, its temperature structure shows that through the processes temperature drops in both cases. Temperature fluctuations of O and N are smaller in this model.
5. Conclusion
In this paper we present a study of temperature fluctuation on two different cases, for uniform and non uniform hydrogen density at two different temperatures of 75,000 and 100,000 K. This was done by in homogeneities on the emission lines, based on statistical approximation introduced by [11] , which quantities the brightness increase or decrease of each line in terms of the departure of the temperature from the average temperature T0 described by Equation (1). The main results are based on the analysis of chemical abundances of oxygen and nitrogen on different mechanism to test such change. Temperature fluctuations are obtained from the photoionization models generated by the spectral synthesis code CLOUDY (C10.00), calculated using the recombination theory for hydrogenic ions. Accurate t2 values have been obtained by comparing the O++ abundances derived from recombination lines with those derived from collisionally excited lines. It is clear from the result that temperature variations t2 < 0.01 value as described in [14] . The main causes of temperature fluctuations are chemical inhomogeneities of heavy metals, density variations and temperature of central stars.
Acknowledgements
We thank our supervisor Prof. Dreck Smith, the Editor and the referee for their comments. This research is funded by the Dire-Dawa University and My Friend Mr. Yared Ayele who arrived at the right time. This support is greatly appreciated.
References
- Knigdon, J. and Ferland, G. (1998) Temperature Fluctuations in Photoionized Nebulae. II. The Effect of Inhomogeneous Abundances. The Astrophysical Journal, 506, 323-328.
- Peimbert, M. and Torres-Poembert, S. (1971) Planetary Nebulae III. Chemical Abundances. The Astrophysical Journal, 168, 413-421. http://dx.doi.org/10.1086/151097
- Gruenwald, R. and Viegas, S.M. (1995) Temperature Fluctuations in Planetary Nebulae. A & A, 303, 535.
- Gonzalez-Delgado, R.M., et al. (1994) Temperature Fluctuations in H II Region. ApJ, 287, 116.
- Esteban, RevMexAA(Sc) (2002) Temperature Fluctuations in H Regions.
- Ferland, G.J. (2011) Hazy: Introduction to Cloudy c10.00.
- Knigdon, J. and Ferland, G. (1995) Temperature Fluctuations in Photoionized Nebulae I. The Astrophysical Journal, 450, 691-704.
- Giammanco, C. and Beckman, J.E. (2005) Temperature Fluctuations in H Regions: Ionization by Cosmic Rays as a Key Mechanism. A & A, 437, L11-L14.
- Smith, D. (2011) Model of Hydrogen Deficient Nebulae. Astrophysics Journal.
- Grevesse, N.A.E. (1989) Solar System Abundances of the Elements. In: AIP conf. proc.183. Cosmic Abundances od Matter.
- Torres-Peimbert A & A, 223-540, 1990.
- Pequignot.D, J.F.M.M..M.P., W.J. (2002) Henney Ionized Gaseous Nebulae. In: Editors, Eds., Conference Series of the Revisita Mexican de Astrnomiya Y Astrofisica, in Press.
- Bresolin, F., Garnett, D.R. and Kennicutt Jr., R.C. (2004) Abundances of Metal-Rich H II Regions in M51. The Astrophysical Journal, 615, 228-241.
- Torres-Peimbert, S. and Peimbert, M. (2002) Temperature Variations and Abundances Determinations in Planetary Nebulae. Instituto de Astronom’ia, Universidad Nacional Auto’noma de Me’xico.