American Journal of Plant Sciences
Vol.4 No.3(2013), Article ID:29150,13 pages DOI:10.4236/ajps.2013.43081
Variation in Catechin Composition of Popularly Cultivated Tea Clones in East Africa (Kenya)
![]()
1Institute of Biotechnology Research (IBR), Jomo Kenyatta University of Agriculture and Technology, Nairobi, Kenya; 2Tea Research Foundation of Kenya, Kericho, Kenya; 3Tea Research Institute of Tanzania, Dar Es Salaam, Tanzania; 4Office Des Cultures Industrielles du Rwanda The’ (OCIR The’), Kigali, Rwanda; 5Department of Chemistry, Maseno University, Maseno, Kenya.
Email: leonidacherotich@yahoo.co.uk, samson.kamunya@yahoo.com, skamunya@tearesearch.or.ke, aealakonya@gmail.com, msomba2000@yahoo.com, smsomba@trit.or.tz, u-ange@yahoo.com, owuorpo@africaonline.co.ke
Received January 6th, 2013; revised February 17th, 2013; accepted February 27th, 2013
Keywords: Tea; Health; Camellia sinensis; Catechins; Variation; Kenya
ABSTRACT
Tea polyphenols and catechins have gained prominence in determination of tea quality. Tea leaves contain large amounts of catechins and their derivatives and these have shown positive effects on human health. An experiment was carried out to determine the level of catechins and polyphenols in 20 new clones found in two distinct tea growing areas. The trial comprising twenty clones was established in two distinct sites in Kenya using randomized complete block design with three replicates and consisted of 10 popular cultivars widely cultivated in the Lake Victoria Basin and additional 10 newly improved clones. Tea leaf samples were collected across two seasons; dry and wet seasons. Tea quality parameters entailing catechins, caffeine and total polyphenols was generated for the 20 clones across the two seasons and sites. The ISO 14502-1 and ISO 14502-1:2005 procedures were used for polyphenol and catechin analyses, respectively. The ANOVA results generated indicated that the level of catechins and polyphenols in tea were significantly different (p < 0.05) and varietal dependent. Generally, the assam varieties had higher levels of catechins and polyphenols than the chinary and cambod varieties, indicating why they are popularly cultivated in the East African region and whose tea quality is highly regarded. Furthermore, the results from principle component analysis (PCA) grouped the clones into three major clusters with one comprising of high quality assam varieties, a mixture of moderate quality assam, cambod and chinary varieties and low catechin content assam anthocyanin-rich variety. It is concluded that the level of catechins in tea plants are varietal dependent, although environmental stress has effects on the synthesis of flavanoids. The results demonstrated that the differences in the accumulation of catechins among the tea clones could be important for the discrimination of clonal diversity.
1. Introduction
Tea, camellia sinensis (L) O. Kuntze, the most popular universal beverage contains a wide range of the Flavanoids [1]. The main flavanoid compounds found in tea are: epigallocatechin (EGC), epicatechin (EC), epigallocatechin gallate (EGCG), epicatechin gallate (ECG) and other compounds [2]. Flavonoids in tea have been reported to be the major source of antioxidants, which have a variety of physiological functions to the body [3]. Catechins in tea have been reported to promote energy consumption by activating Beta-oxidative enzymes of lipids and so weight loss [4]. Reportedly, catechins in tea, especially (-)-epigallocatechin gallate (EGCG), inhibit the angiotensin converting enzyme, suppress the production of angiotensin II, which has strong hypertensive activity, and induce antihypertensive activity [5]. Catechin compounds have been of focus for an anticancer [6]. Biochemicals in tea also relieve allergy symptoms and are shown to improve the body’s immunity [7]. Studies have shown that catechins in tea inhibit diabetes including hyperglycaemia by reducing elevated sorbitol decreasing protein glycosylation and lipid peroxidation and also through inhibiting diabetic cataracts [8]. Catechin compounds have been proven to have a variety of physiological functions, such as those enacting in the duodenum, colon, skin, lung, breast, oesophageal, pancreatic and prostate cancer function [6]. In addition to prophylactic activity, catechins have been found to inhibit the growth of food borne pathogenic bacteria, and do not have adverse effects on the beneficial bacteria [3].
Given the importance of tea to the economy of many countries and human health, the use of suitable tea cultivars that are well endowed in both yield and phytochemicals like flavonoids is paramount. The tea improvement programme at the Tea Research Foundation of Kenya (TRFK) has resulted in many new tea varieties, but exploitation of only a few popular clones accounting for about 60% of tea in the country may have resulted in narrowing of the clones which could be exploited for the commercializable germplasm [9]. Although the level of genetic relatedness of these clones has been elucidated by DNA markers, the application of their biochemical interrelationships remains largely unknown. As has been demonstrated by previous studies [10], biochemical composition of tea plant can be used as markers to elucidate diversity of the tea clones. The green tea leaf contains 30 to 42% polyphenols on the dry weight basis while a cup of green tea contains about 30% to 40% of polyphenols [11]. Polyphenols have aromatic rings with multiple hydroxyl residues. The major polyphenols in tea are the catechins [12]. This group of compounds is derived from the phenylpropanoid and flavanoid biosynthetic pathways. Different tea clones have different number, relative amounts and diversity in their level of catechins. An understanding of the biochemical composition in the plant system might yield information for plant genetic manipulation and crop management strategies that might improve crop value in future [13]. Catechins also play a key role in quality determination in black tea and fruits [14]. The aim of this study was to determine the level of catechins in the 20 improved clones of tea, 10 of which are widely cultivated in the East African tea growing areas.
2. Methodology
2.1. Description of Study Sites
The trial comprising twenty clones was established in April 2009 in two major tea growing areas: at the Timbilil Estate of the TRFK, Kericho and Kipkebe in Sotik Ltd (Table 1). The trial was set up in a randomized complete block design with three replications in plots of 30 plants spaced at 0.61 m within rows and 1.22 m between rows (i.e. 13,448 plants/ha). The trial received 150 Kg N per hectare per year in the form of NPK 25:5:5 compound fertilizer. Each replicate was surrounded by a guard row of clone TRFK 301/4. The tea was brought into bearing following the recommended agronomic practices [7].
2.2. Description of Genetic Materials
The trial consisting of 10 popular cultivars widely cultivated in the Lake Victoria Basin covering Kenya, Rwanda, Uganda and Tanzania and an additional 10 newly improved clones was initiated in 2009 as one of two separate studies entailing “Evaluation of tea cultivars to different growing environments in East African countries” and “Evaluation of response of clone TRFK 6/8 to nitrogen rates and harvesting intervals in East African countries” [15]. The current study however, covered the two Kenyan sites. The cuttings from the mother bushes were propagated in April 2008 and reared in the nursery for one year. Nursery materials were transplanted into the field in April/May 2009 at Kipkebe (Sotik) and Timbilil (Kericho) and brought into bearing following the recommended agronomic practices [7]. The various attributes and status of the clones are summarized in the Table 2.
2.3. Laboratory Analysis of Catechins and Polyphenols
2.3.1. Leaf Sampling and Sample Processing
About 500 g of fresh shoots in form of two leaves and a bud were plucked from each of the clonal entries and placed in appropriately labelled khaki bags. These were then transferred into a cool box containing ice packs and transported to the lab for processing. The clones were sampled twice under different environmental conditions (wet and dry seasons) as shown in Table 3. The samples were transported to the laboratory and immediately dried using a microwave for 5 minutes, which also deactivated the oxidizing enzyme polyphenol oxidase. The dry samples were then ground using a coffee miller and placed in aluminium bags, before moving them to a dark, dry environment for later laboratory analysis [10].
2.3.2. Extraction and Purification of Catechins and Polyphenols
Catechin analysis was done following the protocol and the procedure described by the International Organization for Standardization (ISO) 14502-1:2005. Two hundred milligrams of ground samples were extracted with 5 ml of warm (70˚C) 70% methanol. The mixture was then warmed in a water bath (70˚C) for 10 minutes and vortexed in between after five minutes interval and then cooled. The cool mixture was centrifuged at 3500 rpm for 10 minutes, and the extract was decanted into a 10 ml cylinder. The samples were then reextracted and the extract decanted to the initial 10 ml cylinder topped-up to 10 ml. One millilitre of the extract was diluted 5-fold using stabilizer reagent and passed through a 0.5 mm pore filter before injection into the HPLC C-6 column for catechin analysis. The mobile phase A consisted of 9% (volume fraction) acetic acid, and mobile phase B was made of 80% (volume fraction) acetonitrile. The flow rate was controlled at 1.0 ml/min, with an injection volume of 20 ml. The column was operated at 40˚C and UV spectra peaks were detected at 278 nm. The chromatographic peaks in the samples were identified by comparing their retention times with chemical standards used.
Table 1. Location, elevation and climatic characteristics of the two experimental sites in Kenya.
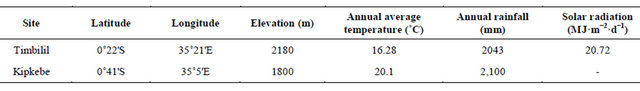
Table 2. Attributes of the 20 clones under investigation found in two distinct areas.
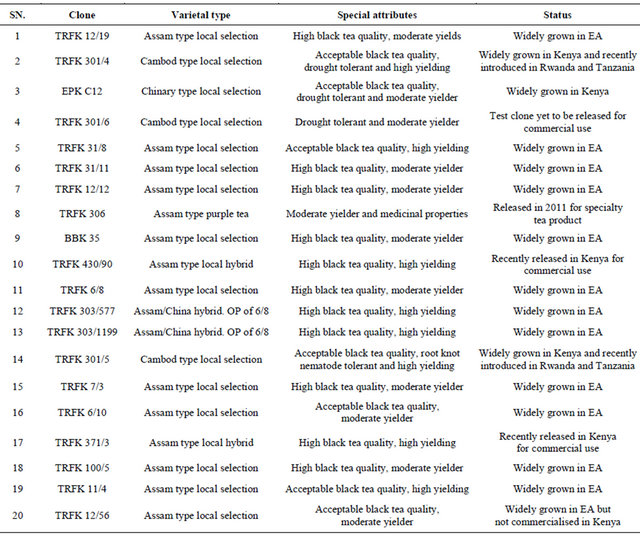
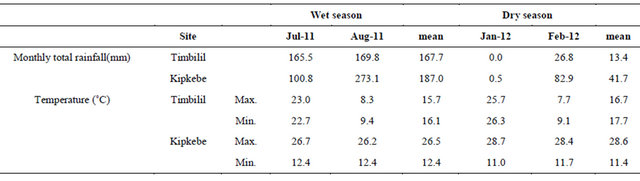
Table 3. Monthly rainfall and temperature data for Kipkebe and Timbilil during the wet and dry season.
For polyphenols analysis, the method described by the International Organization for Standardization (ISO) 14502-1 was used for polyphenols. 1.0 ml of the garlic acid standard solutions were transferred into separate glass tubes labelled A, B, C, D and E in triplicates. Subsequently, 1.0 ml of the diluted sample extract was transferred into separate triplicate tubes. 5.0 ml of 10% Folin-Ciocalteu’s reagent was added. Then immediately, 4.0 ml of a sodium carbonate solution (7.5% w/v) was added. The tubes were vortexed and then allowed to stand at room temperature for 60 min before absorbance was determined at 765 nm against the blanks using a spectrophotometer.
2.4. Statistical Analysis
The various catechins and polyphenols contents in the clones were analyzed using M-Stat-C statistical software for ANOVA. Principle component analysis (PCA) on the concentration of catechins in different clones was done using GENSTAT software [16].
3. Results
3.1. Variations in Catechins among the Cultivars
The catechins were eluted in the following order Gallic Acid (GA), Epigallo catechin (EGC), Caffeine (Caff), Epicatechin (EC), Epigallocatechingalate (EGCG), Catechin(C) and Epicatechin galate (ECG). An example of eluted catechins following HPLC analysis is presented in Figure 1.
A recapitulation of mean squares of the measured parameters is shown in Table 4. It is apparent from the Table that the parameters measured showed varying levels of significance with variations attributed to clones, interactions between (clones × season), and (clone × season × site), being highly significant (p < 0.001). The effect due to seasons was significant (p < 0.01) for all but one parameter EGC. Similarly the effect due to site was significant (p < 0.05) for nearly all the parameters except EGCG, ECG, and TCT. The significance variation of season × clone interactions indicated that clones responded differently to different seasons and sites. The variations in levels of various catechins and total polyphenols (TPs) with respect to seasons and sites are presented in Tables 5-13.
3.1.1. Seasonal Variations of Total Polyphenols (TP) at Timbilil and Kipkebe
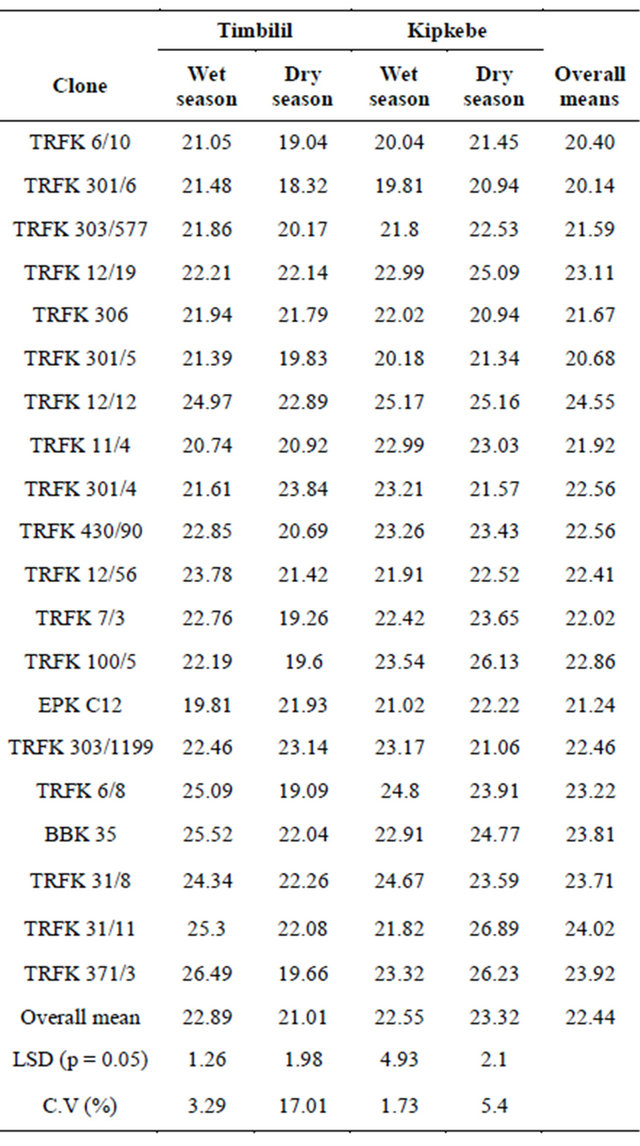
The TP contents in the 20 clones presented in Table 5, varied significantly across different sites and seasons (p < 0.05). The mean of the TP across four seasons also varied significantly. Considering the overall means, clone
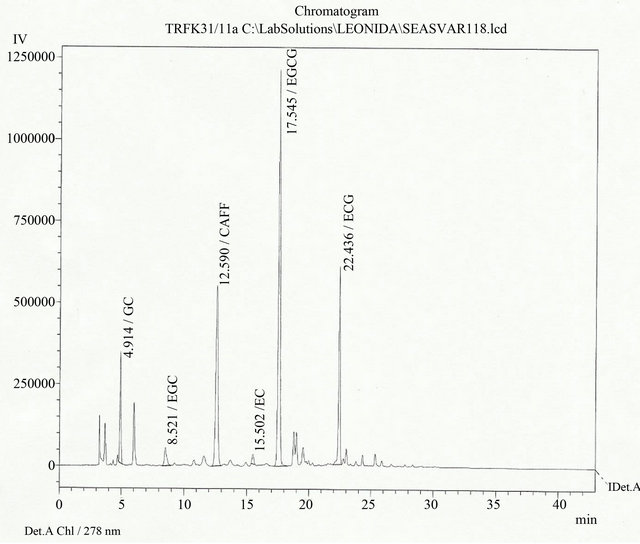
Figure 1. Chromatogram of clone TRFK 31/11 indicating the elution time and the order of the elution of the individual catechins.
Table 4. Summary of mean squares for assessed catechins and total polyphenols.
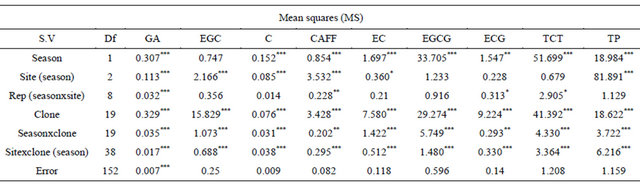
NB: Asterisks *, **, and *** denote significance level at p < 0.05, p < 0.01 and p < 0.001 respectively.
TRFK 12/12, had significantly higher levels of TP at 24.52%, while clone TRFK 301/6 had the least levels, with a mean of 20.14%. However, clones TRFK 31/11, TRFK 371/ 3, BBK 35, had similar TP content at 24.02%, 23.92%, and 23.80% respectively. There was no notable differences in the mean total polyphenols across four environments for clones TRFK 301/4, TRFK 430/90, and TRFK 303/1199.
At the Timbilil site, clone TRFK 371/3 had the highest level of TP at 26.49% during wet season, while clone EPK C12 had the least content of polyphenols at 19.81%. In the dry season, clone TRFK 303/1199 had the highest level of polyphenols of 23.84%, while clone TRFK 301/6 had the least at 18.32%. Although most of the clones showed some slight drop in total polyphenols from wet to dry seasons, the drop by clone TRFK 6/8 and TRFK 371/3 of 6% was rather drammatic.
At the Kipkebe site, clone TRKF 12/12 had the highest level of TP at 25.17% during the wet season, while clone TRFK 301/6 had the least at 19.81%. Clone TRFK 31/11 had the highest level polyphenols of 26.89%, while clone TRFK 301/6 had the least at 20.94% during dry season. Interestingly, clone TRFK 306 had the least level of TP during both seasons. It is worth noting that, unlike for Timbilil, the level of total polyphenols in Kipkebe rose on average from wet to dry season. Clones TRFK 100/5, TRFK 31/11 and TRFK 371/3 appeared to have responded more positively by the onset of stress visited by the dry season.
3.1.2. Seasonal Variations in Total Catechins (TC) at Timbilil and Kipkebe
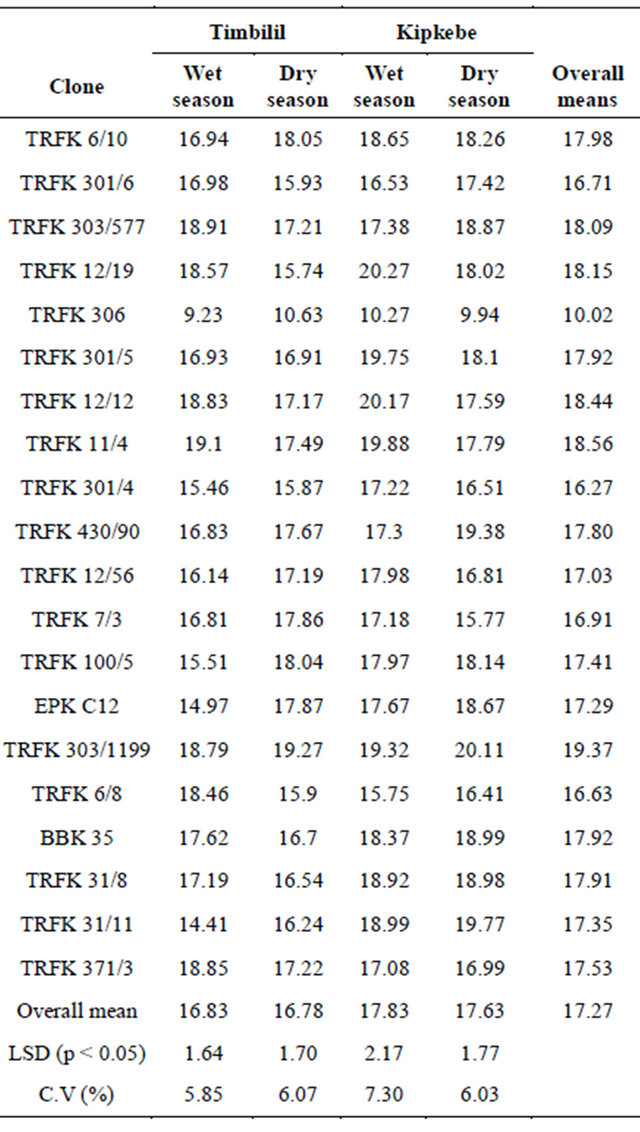
The total catechin content in the 20 clones presented in Table 6, varied significantly across the four environments. Considering the overal means, clone TRFK 303/ 1199 had significantly higher content of catechins at 19.37%, while clone TRFK 306 had the least catechins content at 10.02%. However, clone TRFK 12/19, TRFK 303/577, TRFK 12/12 and TRFK 11/4 had similar higher catechin content.
At the Timbilil site, clone TRFK 371/3 had the highest total catechins at 18.85%, while clone TRFK 306 had the least at 9.23% in wet season. In the dry season clone TRFK 6/10 had the highest catechins content at 18.05%, while clone TRFK 306 had the least at 10.63%. Although most of the clones showed significant decrease in total catechins during dry season, it is worth noting that clones TRFK 100/5, TRFK 6/8, and TRFK 12/19 showed a more decrease at the onset of water stress.
At the kipkebe site, clone TRFK 12/19 had the highest level of catechins at 20.27%, while clone TRFK 306 had the least at 10.27%, during wet season. During dry season, clone TRFK 303/1199 had the highest catechin content at 20.11%, while TRFK 306 had the least at 9.94%. The drastic decrease in total catechin content for clones TRFK 12/19, TRFK 11/4, TRFK 7/3 and TRFK12/12 during dry season is notable. Conversly, clone TRFK 430/90 showed a considerable increase in total catechins due to water stress. Thus, the clones were not affected in the same way by the changes in weather.
3.1.3. Seasonal Variations in Gallic Acid (GA) at Timbilil and Kipkebe
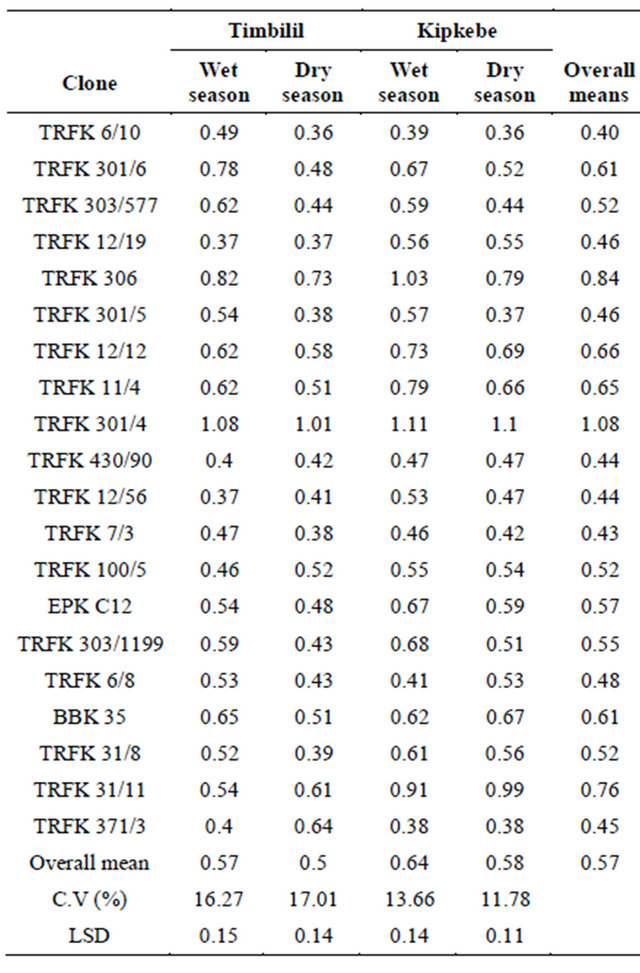
Garlic Acid content among the 20 clones varied signifycantly (p < 0.05) (Table 7). The mean of Garlic acid varied across the four environments. In regards to the overall means, clone TRFK 301/4, had the highest GA content at 1.08%, while clone TRFK 6/10 had the least at 0.40%. Interestingly, Clones BBK 35 and TRFK 301/6; clones TRFK 301/5 and TRFK 12/19; clones TRFK 430/90 and TRFK 12/56; and clones TRFK 303/577, TRFK 100/5 and TRFK 31/8 had equal GA content.
At the Timbilil site wet season, clone TRFK 301/4 the highest GA content while, clone TRFK 12/19, had the least in both seasons (Table 6). There was a decline in GA content in dry season for all the clones except for clones TRFK 12/19, TRFK 430/90, TRFK 31/11, TRFK 100/5 and TRFK 371/3, which had higher GA during dry season. In Kipkebe, clone TRFK 301/4 had the highest GA content, while clones TRFK 6/10 and TRFK 371/3
Table 5. Seasonal variations of total polyphenols (TP) at the Timbilil and Kipkebe sites.
had the least in both seasons. There was significant decline in GA content as a result of water stress for all the clones except for clones TRFK 6/8, BBK35 and TRFK 31/11 which had significant increase. It is noteworthy that clones TRFK 430/90 and TRFK 371/3 were not affected by the changes in environment.
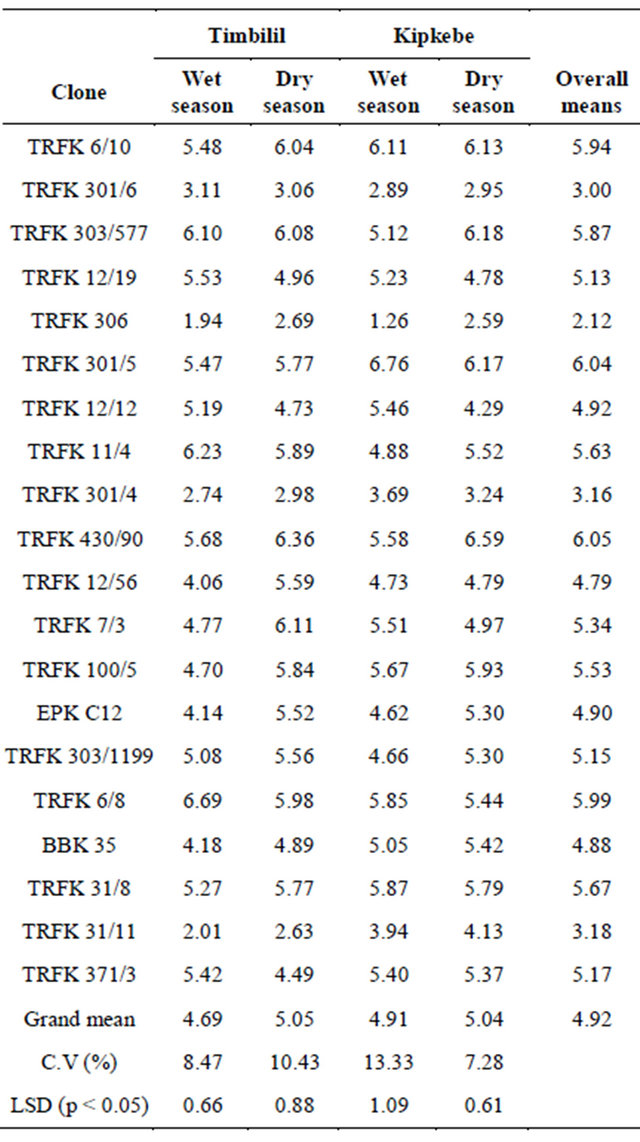
3.1.4. Seasonal Variations in Epigallocatechin (EGC) at Timbilil and Kipkebe
EGC content varied significantly with sites and seasons for the 20 clones presented in Table 8. Considering the overal mean clone TRFK 430/90 had the highest EGC content, while clone TRFK 306 had the least. Clones TRFK 6/8 and TRFK 301/5 had notably higher EGC content. At Timbilil site, wet season, clone TRFK 6/8 had the highest EGC content at 6.69%, while clone TRFK306 had the least at 1.94%. In the dry season, clone
Table 6. Seasonal variations in total catechins (TC) at Timbilil and Kipkebe sites.
TRFK 430/90 had the highest EGC content at 6.36%,while clone TRFK 31/11 had the least at 2.63%. All the clones except for clones TRFK 301/6, TRFK 303/577, TRFK 12/19, TRFK 11/4, TRFK 6/8 and TRFK 371/3 had a increase in EGC content during dry season.
At Kipkebe site, clone TRFK 301/5 had the highest EGC content at 6.76%, while clone TRFK 306 had the least at 1.26% during the wet season. In the dry season, clone TRFK 303/577 had the highest EGC content at 6.18% while clone TRFK 306 had the least at 2.59%. although most of the clones had an increase in EGC content in dry season, clone TRFK 306 and TRFK 430/90 had a drastic increase during dry season.
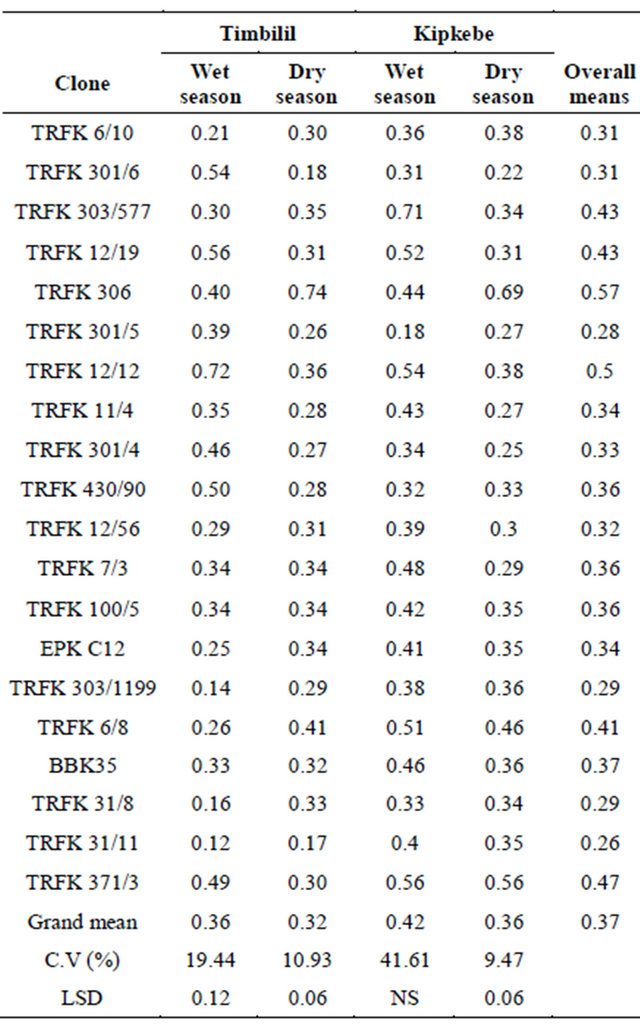
3.1.5. Seasonal Variations in Catechin (C) at Timbilil and Kipkebe
As shown in Table 9, catechin content varied significantly between sites and seasons except for Kipkebe wet
Table 7. Seasonal variations in garlic acid (GA) at Timbilil and Kipkebe sites.
season. Considering the means, clone TRFK 306 had the highest catechin content at 0.57%, while clone TRFK 31/11 had the least at 0.26%. Clones TRFK 6/10 and TRFK 301/6; clones TRFK 303/577 and TRFK 12/19; clones EPK C12 and TRFK 11/4; and clones TRFK 7/3, TRFK100/5 and TRFK 430/90 had equal catechin contents. At the Timbilil site, wet season, clone TRFK 12/12 had the highest catechin (+C) at 0.72%, while clone 31/11 had the least at 0.12%. Conversely during the dry season, clone TRFK 306 had the highest (+C) at 0.74% while clone TRFK 31/11 had the least at 0.17%. At the Kipkebe site, wet season, clone TRFK 303/577, had the highest catechin at 0.71%, while clone TRFK 301/5 had the least at 0.18%. In dry season, clone TRFK 306 had the highest catechin content, while clone TRFK 301/6 had the least at 0.22%. It is worth noting that most of the clones had lower catechins during dry season. However, clone TRFK 306 had considerable increase in catechin content during the dry season for both sites.
3.1.6. Seasonal Variations in Caffeine at Timbilil and Kipkebe
The level of caffeine varied considerably among the 20 clones presented in Table 10. Taking into account the overall means, clone TRFK 12/12 had the highest caffeine content at 4.11%, while clone TRFK 306 had the least at 1.94%. At the Timbilil site, clone TRFK 371/3 had the highest caffeine level at 3.93%, while clone TRFK 306 had the least at 1.76% during wet season. In the dry season, clone TRFK 6/10 had the highest caffeine content at 4.53%, while clone TRFK 306 had the least at 2.10%. At the Kipkebe site, wet season, clone TRFK 12/12 had the higest caffeine content at 3.25% while clone TRFK 306 and TRFK 303/577 had the least at 1.91%. Majority of the clones had a significant increase in caffeine level as a result of water stress in both sites as shown in Table 9. However, clone TRFK 303/577 and TRFK 12/12 had a drastic increase in caffeine level at the Kipkebe site. It is particularly worth noting that the caffeine content generally rose by 15.6% and 44.8% from wet to dry seasons for Timbilil and Kipkebe respectively.
Table 8. Seasonal variations in epigallocatechin (EGC) at Timbilil and Kipkebe sites.
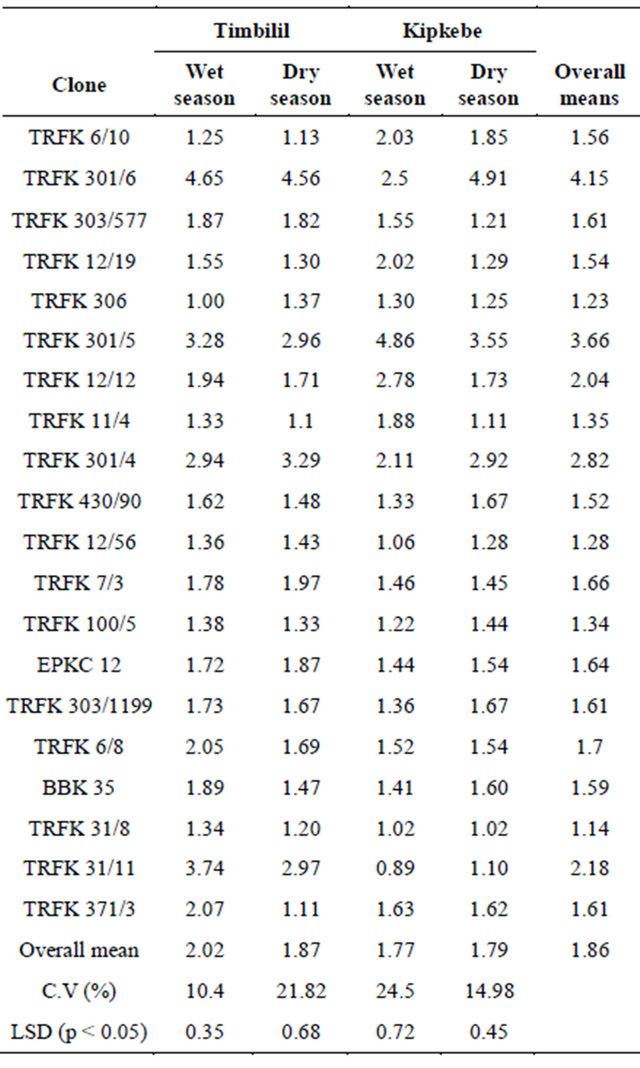
3.1.7. Seasonal Variations in Epicatechin (EC) at Timbilil and Kipkebe
There was a substantial variation (p < 0.05) in EC content among the 20 clones presented in Table 11. With reference to the overall means, clone TRFK 301/6 had the highest EC content at 4.15%, while clone TRFK 31/8 had the least at 1.14%. Clones TRFK 430/90 and TRFK 371/3 had equal EC content. Furthermore, the Cambod clones TRFK 301/5 and TRFK 301/4 had notably higher EC than the other clones. At the Timbilil site, during the wet season, clone TRFK 301/6 had the highest EC content at 4.65%, while clone TRFK 306 had the least at 1.00%. In the dry season clone TRFK 301/6 still had the highest EC content at 4.56%, while clone TRFK 11/4 had the least at 1.10%. Though most of the clones had lower EC content in dry season, clones TRFK 306, TRFK 301/4, TFK 12/56, TRFK 7/3 and EPKC12 had higher EC in the dry season. At kipkebe site, during wet season, clone TRFK 301/5 had the highest level of EC at 4.86%, while clone TRFK 31/11 had the least EC content at
Table 9. Seasonal variations in catechin (C) at Timbilil and Kipkebe sites.
NS: denotes non-significant.
0.89%. On the other hand, during the dry season, clone TRFK 301/6 had the highest EC content at 4.91%, while clone TRFK31/8 had the least at 1.02%. At this site, most of the clones had an increase in EC content. It is worth noting that at the two sites, Cambod clones TRFK301/5, TRFK 301/4 and TRFK 301/6 generally had high EC content than the Assam clones.
3.1.8. Seasonal Variations in Epigallocatechin Gallate (EGCG) at Timbilil and Kipkebe
EGCG content in the 20 clones presented in Table 12 varied considerably across four environments. Taking into account the overall means, clones TRFK 303/1199 had the highest EGCG content at 9.01%, while clone TRFK 306 had the least at 3.74%. Clones TRFK 12/12 and clone TRFK 31/11 had equal mean EGCG contents. At the Timbilil site, wet season, clone TRFK 11/4 had the highest EGCG content at 8.86%, while clone TRFK 306 had the least at 3.34%. In the dry season, clone TRFK 371/3 had the highest EGCG content at 8.78%, while clone TRFK 301/6 had the least at 3.25%. Most of
Table 10. Seasonal variations in caffeine (Caff) at Timbilil and Kipkebe sites.
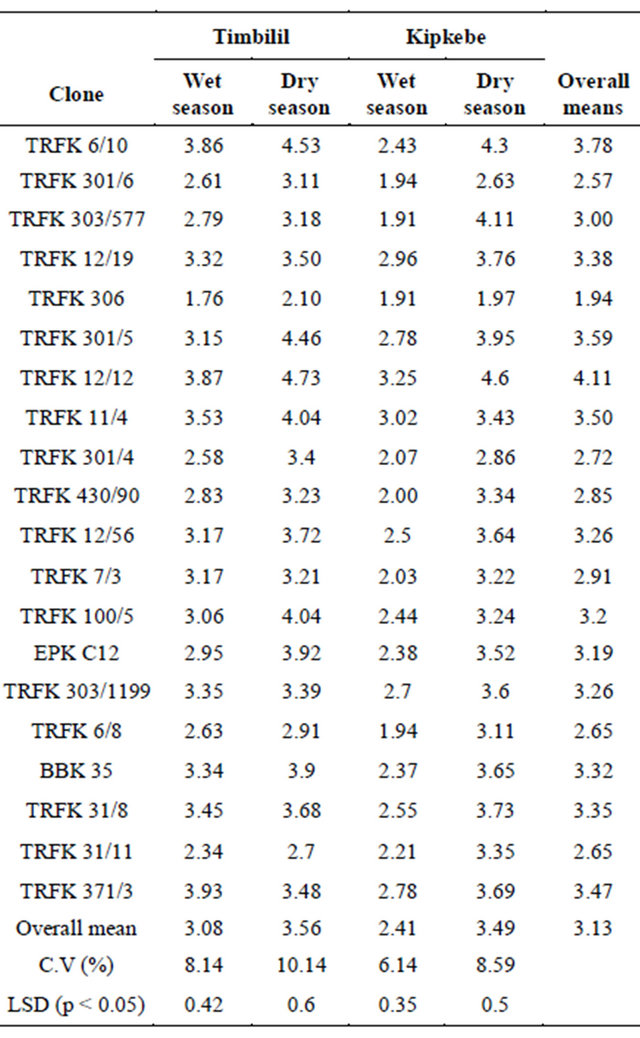
Table 11. Seasonal variations in total Epicatechins (EC) at Timbilil and Kipkebe sites.
the clones had a decline in their EGCG content during the dry season, although clones TRFK 6/8 and TRFK 31/11 showed more decrease. Nevertheless, at the Kipkebe site, clone TRFK 31/11 had the highest EGCG content at 10.38%, while clone TRFK 6/8 had the least at 5.93% during wet season. During the dry season, clone 31/11 had the highest EGCG content at 10.68%, while clone TRFK 301/6 had the least at 3.33%. Majority of the clones had EGCG content decline during the dry season.
3.1.9. Seasonal Variations in Epicatechin Gallate (ECG) at Timbilil and Kipkebe
There was significant variation in ECG content in the 20 clones presented in Table 13. In view of the overall means, clone TRFK 301/6 had significantly the highest ECG content at 5.03%, while clone TRFK 100/5 had the least at 1.96%. Clones TRFK 303/577 and TRFK 306 had equal ECG content. At the Timbilil site clone TRFK 301/6 had the highest ECG content at 5.14%, while clones TRFK 430/90 had the least at 1.87% during the wet season. In dry season, clone TRFK 301/6 had the highest ECG at 4.88%, while clone TRFK 31/8 had the least at 1.82%. Most of the clones in this site had lower ECG content in the dry season. However, at the Kipkebe site wet season, clone TRFK 301/4 had the highest ECG content at 4.71%, while clone TRFK 6/8 had the least at 1.93%. In the dry season, clone TRFK 301/6 had the highest ECG content at 6.02% while clone TRFK 100/5 had the least at 1.66%. Cambod varieties had higher level of digallated catechins such as EC and ECG.
3.2. Principle Component Analysis for the 20 Clones Using Mean Catechin Data across Two Sites and Seasons
The principle component analysis grouped the clones into three clusters (Figure 2). The first principle component accounted for 58.72% of the total variation, while the second principle component accounted for 21% variation, with an accumulation of 79.72% variation.
Table 12. Seasonal variations in Epigallocatechin gallate (EGCG) at Timbilil and Kipkebe sites.
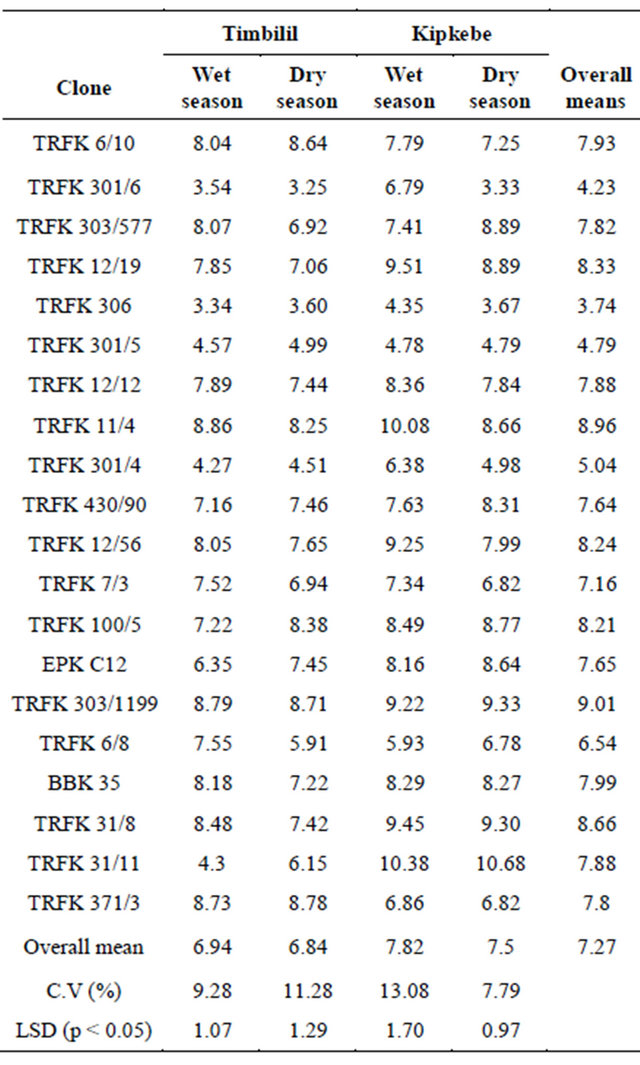
Table 13. Seasonal variations in Epicatechin gallate (ECG) at Timbilil and Kipkebe sites.

3.3. PCA for the Total Polyphenols for 20 Clones Using Mean Polyphenol Contents across Four Environments
The principle component analysis on the total polyphenols presented in Figure 3 similarly, revealed three distinct clusters. The first principle component accounted for 79.85% of the total variation, while the second principle component accounted for 11.03% variation. The cumulative variation was 90.88%.
4. Discussion
The results from catechin analysis indicate that the level of biochemical components in tea is varietal dependent. This is an indication that each individual clone is unique in the level of catechins. Most of the clones used showed some level of association between the total polyphenols and soil water content. There was lower polyphenols content in dry season compared to the wet season in most of the clones. This was expected because water is one of the raw materials for photosynthesis and it has direct impacts on organic synthesis of plants of both the primary and the secondary metabolites. The leaf is the major source of photo assimilates, which yields the major precursors of secondary metabolism such as malonylCoA and coumaroyl-CoA which are dependent on the light and the soil water content [10]. Previous results showed that phenolics in green tea shoots varied among clones [17], while other results revealed correlation between water content and biochemical parameters [13].
The clones had high level of caffeine during the dry season. This is because accumulation of secondary metabolites such as caffeine by plants is known to be a form of defence mechanism adopted by plants. This mechanism helps plants respond to and adapt to environmental stresses [18]. Water stress is one of the most important environmental factors that can regulate plant growth and development, limit plant production, and alter the physiological and biochemical properties of plants. Indeed, water stress is known to increase the amount of secondary metabolites in plants [19]. One of the responses to abiotic stress is the accumulation of non-toxic, low molecular weight compounds, called compatible solutes or osmolytes, such as caffeine. In response to abioitc stress there is increase in the level of caffeine during dry season. From the this study, it was observed that all the clones except for clone TRFK 306 increased significantly in their level of caffeine as a result of the dry season. The accumulation of caffeine could be due to the hydroxylation of p-ce toumaric acid to caffeic acid in the phenylpropanoid pathway through the influence of polyphenol oxidase (PPO’s) [20]. This could be the reason for the increase in the level of caffeine in the tea clones as a result of the dry season. Expression analysis done showed that polyphenol oxidase (PPO) was induced in response to water stress with the highest magnitude of induction in older leaves and corresponding abscission zones, which might facilitate cell death preferentially in these tissues [21].
The new improved clones had high levels of catechins like the other commercialized clones used in this study except for clone TRFK 306. The low levels of catechins in fresh leaves of clone TRFK 306 could be attributed to the up regulation of the anthocyanin synthase in biosynthetic pathway for anthocyanins rather than the leucoanthocyanin reductase in catechin biosynthetic pathway probably due to environmental stimuli [22]. This could imply that this variety clones could be commercialized for the production of purple tea which has been considered a medicine and a healthful beverage [23]. Furthermore, some clones had high levels of catechins, especially EGCG, which from the preceding studies done indicated that such high levels of EGCG are important health benefits [24].
The catechin content in some of the clones was not
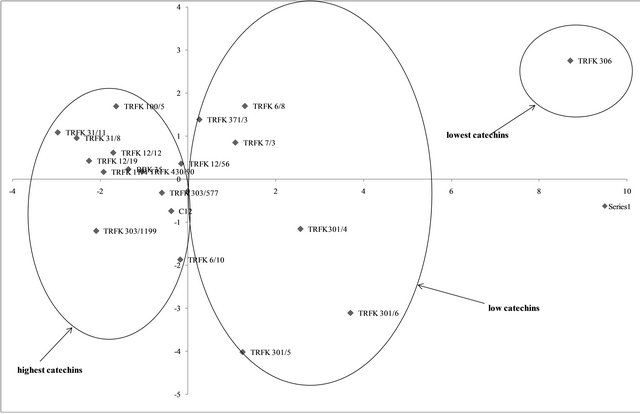
Figure 2. Principle component analysis for the 20 clones using mean catechin data across sites and seasons.
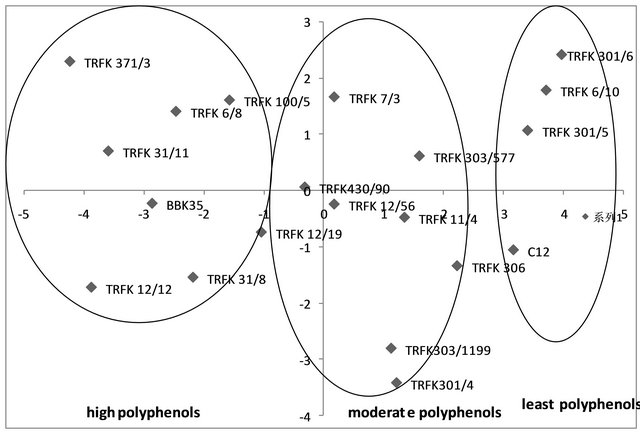
Figure 3. Scatter graph PCA for total polyphenols based on the mean polyphenol content across seasons and sites.
significantly affected by seasonal variation. This could be attributed to the slight changes in the catechin levels in individual clones, resulting from seasonal variation due to the principal amounts of the specific catechins in the leaf. However, organic compounds that are synthesized in small quantities, such as C, ECG, EGC and EC, could be expected to exhibit significant changes when the plant is under stress, but this was not the case for the results of some of the clones from this study. This observation rules out the influence of principal amount of catechins in plants as the basis of the differential water stress response of the plants. The results obtained from this study are corroborated by earlier result which indicated that the changes in soil water content did not have effects on the level of catechins [13].
On the other hand, the differences in the levels of catechins in the different clones could be attributed to the up regulation or down regulation of the enzyme flavanone 3-hydroxylase. Flavanone 3-hydroxylase (F3H) is an abundant enzyme in tea leaves that catalyses the stereo specific hydroxylation of (2S)-naringenin to form (2R, 3R)-dihydrokaempferol. In a study carried out to determine the concentration of catechins, and CsF3H gene expression found a positive correlation between the concentration of catechins, and CsF3H gene expression in leaves at different developmental stage. CsF3H expression was down-regulated in response to drought, abscisic acid and gibberellic acid treatment, but up-regulated in response to wounding. The concentration of catechins paralleled the expression data. In addition, they also reported that drought decreased the level of catechins in tea [13]. The decrease in catechins can be exemplified by percentage total catechins in clones TRFK 12/19, TRFK 12/12, and TRFK 11/4 during the season. In a recent study high flavanone-3-hydroxylase (F3H) activity in tea leaves was reported suggesting it as an important enzyme in the biosynthesis of catechins in tea [22]. These data indicate that catechin may serve as a feedback inhibitor of CsF3H expression [25]. Negative feedback regulation of CsF3H expression by catechins could explain the storage of catechins in the vacuole which would allow for their continuous synthesis [26]. This could explain the lack of change in the level of total catechins in some of the clones such as TRFK 371/3, TRFK 301/4, and TRFK 6/10 in the four environments.
From principle component analysis, a clear structure was observed within the different clones of tea with the identification of different clusters based on the catechins and polyphenols shown in Figures 2 and 3. The Assam teas have higher catechins content compared to the Cambod teas, which have moderate catechins. This could be attributed to the unique catechin profile of Cambod varieties. The Cambod clones were low in EGCG, medium low in EGC and high in EC and ECG content. These results are similar to the results obtained in a preceding study [6]. Catechin rich clones could be distinguished from the low catechins clones within the PCA plot. Thus individual catechins can be used in the identification and selection of high quality clones.
5. Conclusion
From this study it can be concluded that the level of catechins in tea plants are varietal dependent. Environmental stress has effects on the synthesis of Flavanoids as well as the levels of caffeine in plants. The results presented indicated that the differences in the accumulation of catechins among the tea clones, and by extension important for the discrimination of clonal diversity. The determination of the influence of wider climatic conditions on the biosynthesis and the content of Flavanoids could be explored as the subjects for further research.
REFERENCES
- M. Obanda, P. O. Owuor and C. K. Njuguna, “The Impact of Clonal Variation of Total Polyphenols Content and Polyphenol Oxidase Activity of Fresh Tea Shoots on Plain Black Tea Quality Parameters,” Tea, Vol. 13, No. 2, 1992, pp. 129-133.
- H. Wang and K. Helliwell, “Determination of Flavanols in Green Tea and Black Tea Leaves and Green Tea Infusions by High Perfromance Liquid Chromatography,” Food Reserves International, Vol. 34, No. 2-3, 2001, pp. 223-227. doi:10.1016/S0963-9969(00)00156-3
- Y. Hara, “Prophylactic Functions of Tea Catechins,” In: W. K. Jain, M. A. Siddiqi and J. H. Weisburger, Eds., Protective Effects of Tea on Human Health, CABI Publishing, Wallingford, 2006, pp. 16-24. doi:10.1079/9781845931124.0016
- M. Boschmann and F. Thielecke, The Effects of Epigallocatechin-3-Gallate on Thermogenesis and Fat Oxidation in Obese Men: A Pilot Study,” Journal of the American College of Nutrition, Vol. 26, No. 4, 2007, pp. 389-395.
- I. A. Persson, M. Josefsson, K. Persson and R. G. Andersson, “Tea Flavonols Inhibit Angiotensin-Converting Enzyme Activity and Increase Nitric Oxide Production in Human Endothelial Cells,” Journal of pharmacy and Pharmacology, Vol. 58, No. 8, 2007, pp. 1139-1144.
- G. Goodarznia and A. Abdollahi, “Superheated Water Extraction of Catechins from Green Tea Leaves: Modelling and Simulation,” Chemistry and Chemical Engineering, Vol. 16, No. 2, 2009, pp. 99-107.
- Tea Research Foundation of Kenya, “Tea Cultivation Manual for Good Agricultural Practices,” Inkit, Nairobi, 2012, p. 70.
- S. A. Laurie, V. A. Miller, S. C. Grant and M. G. Kris, “Phase I Study of Green Tea Extract in Patients with Advanced Lung Cancer,” Cancer and Chemotherapy Pharmacology, Vol. 55, No. 1, 2005, pp. 33-38. doi:10.1007/s00280-004-0859-1
- F. N. Wachira, J. Tanaka and Y. Takeda, “Genetic Variation and Differentiation in Tea (Camellia Sinensis) Germplasm Revealed by RAPD and AFLP Variation,” Journal of Horticultural Sciences and Biotechnology, Vol. 76, No. 5, 2001, pp. 557-563.
- G. N. Magoma, et al., “The Use of Catechins as Biochemical Markers in Diversity Studies of Tea (Camellia Sinensis),” Genetic Resources and Crop Evolution, Vol. 47, No. 2, 2000, pp. 107-114. doi:10.1023/A:1008772902917
- D. A. Balentine, S. A. Wiseman and L. C. Bouwens, “The Chemistry of Tea Flavonoids,” Food Science and Nutrition, Vol. 37, No. 8, 1997, pp. 693-704.
- K. Singh, et al., “An Early Gene of the Flavonoid Pathway, Flavonone 3-Hydroxylase, Exhibits a Positive Relationship with the Concentration of Catechins in Tea (Camellia Sinensis),” Tree Physiology, Vol. 28, No. 9, 2008, pp. 1349-1356. doi:10.1093/treephys/28.9.1349
- E. K. Cheruiyot, et al., “Polyphenols as Potential Indicators for Tolerance in Tea (Camellia Sinensis),” Bioscience, Biotechnology, and Biochemistry, Vol. 71, No. 9, 2007, pp. 2190-2197. doi:10.1271/bbb.70156
- H. P. Singh, S. D. Ravindranath and C. Singh, “Analysis of Tea Shoot Catechins: Spectrophotometric Quantification and Selective Visualization on Two Dimensional Paper Chromatograms Using Diazotized Sulphanilamide,” Journal of Agricultural and Food Chemistry, Vol. 47, No. 3, 1999, pp. 1041-1045. doi:10.1021/jf9807263
- B. O. Kwach, et al., “Effects of Location on Production Fertilizer Rates and Plucking Intervals on Mature Leaf Nutrients of Clone TRFK 6/8 in East Africa,” Tea, Vol. 32, No. 2, 2011, pp. 56-68.
- Genstat 5 Committee, “Principle Component Analysis and Hierachial Ascendance Classification. In Genstat Reference Manual,” Clarendon Press, Oxford, 1989, pp. 471-508.
- M. Obanda and P. Owuor, “Flavonols Composition and Caffeine Content of Green Leaf as Quality Potential Indicators of Kenyan Black Teas,” Journal of the Science of Food and Agriculture, Vol. 74, No. 2, 1997, pp. 209-215. doi:10.1002/(SICI)1097-0010(199706)74:2<209::AID-JSFA789>3.0.CO;2-4
- A. Kirakosyan, et al., “Applied Environmental Stresses to Enhance the Levels of Polyphenolics in Leaves of Hawthorn Plants,” Physiologia Plantarum, Vol. 121, No. 2, 2004, pp. 182-186. doi:10.1111/j.1399-3054.2004.00332.x
- S. M. A. Zobayed, F. Afreen and T. Kozai, “Phytochemical and Physiological Changes in the Leaves of St. John’s Wort Plants under a Water Stress Condition,” Environmental and Experimental Botany, Vol. 59, No. 2, 2007 pp. 109-116. doi:10.1016/j.envexpbot.2005.10.002
- G. Spagna, et al., “Characterization of a Tomato Polyphenol Oxidase and Its Role in Browning and Lycopene Content,” Journal of Agricultural and Food Chemistry, Vol. 53, No. 6, 2005, pp. 2032-2038. doi:10.1021/jf040336i
- M. R. Badger, et al., “Electron Flow to Oxygen in Higher Plants and Algae: Rates and Control of Direct Photoreduction (Mehler Reaction) and Rubisco Oxygenase,” Philosophical Transactions of the Royal Society B, Vol. 355, No. 1402, 2000, pp. 1433-1446. doi:10.1098/rstb.2000.0704
- P. A. N. Punyasiri, et al., “Flavonoid Biosynthesis in the Tea Plant Camellia Sinensis: Properties of Enzymes of the Prominent Epicatechin and Catechin Pathways,” Archives of Biochemistry and Biophysics, Vol. 431, No. 1, 2004, pp. 22-30. doi:10.1016/j.abb.2004.08.003
- C. Carmen, R. Artacho and R. Giménez, “Beneficial Effects of Green Tea-a Review,” Journal of the American College of Nutrition, Vol. 25, No. 2, 2006, pp. 79-99.
- G. Dale, et al., “Epigallocatechin-3-Gallate (EGCG): Chemical and Biomedical Perspectives,” Phytochemistry, Vol. 67, No. 17, 2006, pp. 1849-1855. doi:10.1016/j.phytochem.2006.06.020
- L. Britsch and H. Grisebach, “Purification and Characterization of (2s)-Flavanone 3-Hydroxylase from Petunia Hybrida,” European Journal of Biochemistry, Vol. 156, No. 3, 1986, pp. 569-577. doi:10.1111/j.1432-1033.1986.tb09616.x
- T. C. Fischer, H. Halbwirth and S. Roemmelt, “Nduction of Polyphenol Gene Expression in Apple (Malus × Domestica) after the Application of a Dioxygenase Inhibitor,” Journal of Plant Physiology, Vol. 128, No. 4, 2006, pp. 604-617. doi:10.1111/j.1399-3054.2006.00787.x