Theoretical Economics Letters
Vol.04 No.09(2014), Article ID:52446,12 pages
10.4236/tel.2014.49113
Disequilibrium Pricing―Greek Euro Crisis
Frederick Betz1,2
1SUNY Korea, Incheon, South Korea
2Portland State University, Portland, USA
Email: fbetz@venture2reality.com
Copyright © 2014 by author and Scientific Research Publishing Inc.
This work is licensed under the Creative Commons Attribution International License (CC BY).
http://creativecommons.org/licenses/by/4.0/


Received 11 November 2014; revised 1 December 2014; accepted 15 December 2014
ABSTRACT
Financial instability in Greece began in 2009 when the interest rates on Greek sovereign bonds surged; and this can be graphed in a “price disequilibrium” model. To explain how this came about, we create a systems-dynamics model of the Greek fiscal system. Government fiscal systems are not a kind of a “causal” system, but a “structural-functional” system instead. This approach is in the spirit of the Keynes-Minsky model of a financial market as a “dynamic” of the value of capital assets. Financial bubbles occur from “perceptions”―cognitive “reflexivity” in Soros’ term―as expectations of the future values in a financial market. The Greek government fiscal crisis is a “Min- sky moment”, which occurs at a time when traders in a financial market have moved from speculative finance to the unstable reflexivity in Ponzi finance. The governments in Greece had indulged in the dynamics of a budget policy of “Ponzi finance”. Unsound fiscal policy over many years had accumulated a very large and increasing government debt―until bond market “reflexive cognition” triggered the Greek fiscal crisis in 2010. The “reflexive perception” of bond traders was that either the Greek government must “default” or be “bailed out”.
Keywords:
Economic Crises, Financial Instability, Financial Models

1. Introduction
We apply a graphical analysis of a time-dependent-price-commodity graph to the case of the financial crisis of Greece in 2009. This will show that the time chart of Greek bond-interest-rates fits empirically upon the theoretical price-disequilibrium model. But while the model displays the outcome of “instability” in a financial market (financial bubbles), it does not explain the societal process leading up to the Greek fiscal bubble. To explain the process, we apply the modeling technique of systems dynamics, as depicting two sources of government finance: “tax revenues” and “sovereign bond issues”. As a system feed-back loop, we apply George Soros’ concept of market “reflexivity” between the bond-market and the government debt. The point of this analysis is to highlight the critical factors which lead to a government fiscal crisis.
2. Historical Case and Analysis: Greek Euro Crisis 2009
We review the beginning in 2009 of the Greek fiscal crisis. Then bond raters began the downgrading of Greek sovereign bonds, as Bill Koenig reported: “Fitch Ratings said it downgraded Greece’s long-term foreign currency and local currency issuer default ratings to A―from A. The outlook is negative.” [1] .
The financial market responded negatively to the ratings downgrade, as Helena Smith and Ashley Seager reported: “Financial markets around the world sold off, after Greece’s credit rating was cut amid mounting concerns about its fiscal health. European stock markets tumbled and the euro weakened sharply with investors becoming increasingly worried about dragging debt problems worldwide. The fallout also followed a ratings downgrade for six companies in Dubai, reinforcing fears of a global debt crisis. The Fitch rating agency cut Greece’s long-term debt to BBB+ from A minus. It marked the first time in 10 years that the country has seen its rating pushed below an A grade. The agency cited: ‘The weak credibility of fiscal institutions and the policy framework … (is) exacerbated by uncertainty over the prospects for a balanced and sustained economic recovery.’” [2] .
Since Greece was a part of the Euro fiscal union, the potential of its default in debt affected the whole of the Euro union. Smith and Seager reported: “After the (rating) decision, the euro slipped against the dollar and other major currencies, highlighting anxiety over the possible repercussions it could have for the eurozone if Greece defaulted, on what has become the most expensive debt in the EU. European stock markets also took fright, with the pan-European FTSEurofirst index slipping 1.5%, while in London the FTSE 100 shed 1.65% to close at 5223.13, down 87.53 points on the day. The euro fell by 2% against the yen and by 0.6% against the dollar to $1.472” [2] . Greece’s bonds went into “price-disequilibrium”, as the “interest rate” on new issues of Greek bonds accelerated, Figure 1.
The jump in interest rates on Greek Sovereign bonds in 2010 went from 3.47% in January to 9.73% in July. This is what Paul McCulley called a “Minsky moment”―the time when market speculators realize a recent rapid price rise is a financial bubble and that market collapses [3] . Bond traders’ confidence failed about the Greek government’s capability to solve its fiscal problem. Bonds must return both interest on the loan and principle at maturity. Suddenly, the market feared a debt default. The market for new Greek bonds collapsed, as traders demanded higher and higher interest rates on new bonds.

Figure 1. Interest rate of Greek two-year government bonds traded in the secondary market reflecting the markets’ assessment of investment risk (source: Bloomberg) (http://en.wikipedia.org/wiki/Greek_government-debt_crisis).
This kind of anticipation is what George Soros has called “reflexivity” in a financial market [4] . Anticipating a possible government default, traders would not buy new Greek sovereign bonds, except at very high interest rates. The interest rate on Greek bonds jumped from 12.27% in January 2011 to 26.65% in August 2011. Then in January 2012, it leapt to 129.9% and then 177.37%. This was a “price disequilibrium” in the Greek bond market―a market “reflexivity” anticipating future government bond default.
Price-disequilibrium is a basic phenomenon of financial markets. One may recall that John Maynard Keynes [5] and later Irvin Minsky [6] argued that financial markets differed from commodity markets because of the dimension of “time” in financial markets. In a commodity market, prices can reach an equilibrium between supply and demand, as commodities have only a single, immediate value of consumption by a consumer. However, in a financial market, capital assets have two values, an immediate value of rents and a future value of liquidity. This requires financial markets to be modeled with a time dimension; and the author constructed a price-disequilibrium model from the price-equilibrium model by adding the dimension of time [7] . Thus one can display the Greek bond “financial bubble” in the “rapid rise of interest rates” on a price-disequilibrium model, Figure 2.
One sees that the time chart of Greek bond interest rates fits empirically upon the Price-Time-Plane, of a three-dimensional financial market disequilibrium model. It was a classic Keynes-Minsky financial crisis. But this “Minsky movement” (from speculative finance to “Ponzi” finance) had occurred―not in bond-market spe- culation―but in the Greek government’s fiscal policy! This is different from a classic stock market bubble, such as the “dot.com” bubble in the US stock market in 2000, as shown in Figure 3.
The two financial bubbles are different, the first in a government sovereign bond market and the second in a stock equity market. Yet financial bubbles have occurred in both. How is it possible to have a financial bubble in government fiscal processes? A stock market disequilibrium occurs due to excessive leverage in stock speculation [6] [7] . What is the excess in government policy which creates a fiscal disequilibrium? For an explanation, we next turn to a “systems dynamics” model of the Greek government fiscal policy.
Systems Dynamics Model of Greece’s Fiscal Policy
One way to model system change is to use “systems dynamics” techniques. For example, earlier Michael J. Radzicki and Robert A. Taylor had sketched a systems dynamics model for the US Government deficit and debt, using one source of revenue, taxes. [8] We now extend their model, with two sources of revenue, taxes and bonds, and we also add feed-back loops for tax policy and market reflexivity. This is shown in Figure 4.
National debt can be indicated as a kind of “stock” in systems dynamics notation. When tax revenue is insufficient to fund a government budget, then the “stock” of national debt will accumulate. This occurs when a gov-

Figure 2. Greek sovereign bond interest rate as a price-disequilibrium chart.

Figure 3. Price-disequilibrium chart in the New York stock market in 2000.

Figure 4. System analysis of eu dollar crisis in Greece 2010.
ernment finances its budget deficits through issuing sovereign bonds. The interest rate on the sovereign bonds will vary, in the bond markets, about the risk of investments in government bonds. As shown in the figure, the Greek bond interest rates rose dramatically in and after 2009, when market confidence declined over the soundness of Greek government policy, about its fiscal responsibility. The level of “interest rate” operated as a kind of “control valve” on the “flow” of sovereign bonds into the “stock” of national debt.
Confidence in the future value of Greek bonds had been undermined by the size of the Greek debt to Greek tax revenue. Smith and Seager reported: “Greece has the highest debt ratio within the 16-member eurozone, with the finance minister, Giorgos Papaconstantinou admitting that “the fiscal situation is dramatic”. Next year, it is forecasted to reach 124.9% of gross domestic product.” [2] . Figure 5 shows the tax revenues and government budget expenditures in Greece over the early part of the twenty-first century. Over this decade from 2002 through 2013, net borrowing from abroad was needed to cover the annual budget deficit of the Greek governments. When the fiscal crisis occurred in 2009, it was because the international financial market had lost confidence in Greece’s government’s ability to honor its debt.

Figure 5. Greek government tax revenue and budget expenditure from 2002 to 2013. “Despite years of draconian austerity measures, greece has failed to reach a balanced budget as public revenues remain low.” (http://en.wikipedia.org/wiki/eurozone_crisis).
Frequently governments try to act, but usually only after a fiscal crisis begins. At the onset of the fiscal crisis in 2009, the Greek government was urged to try to face the problem. Smith and Seager reported: “The head of the European Central Bank, Jean-Claude Trichet, appealed to the prime minister, George Papandreou, to enact “courageous measures”. “The situation in Greece is very difficult”, Trichet told the European parliament’s economic committee. “This calls for very difficult, very courageous, but absolutely necessary measures”. Last week the country was formally put under EU supervision; (and it was) revealed ... that the public deficit was 12.7% of GDP―more than four times the EU’s permitted level... Appearing on CNN, Papandreou rejected the prospect of Greece going bankrupt, saying it was “a responsible country” and would not default on its debt. The socialists have announced that they will curb the deficit by cutting tax evasion and trimming public expenditure.” [2] .
Thus one of the system dynamic results of a continuing Greek government budget-deficit was to increase the national debt over time, as shown in Figure 6.
This continuing budget deficit acted as a second kind “valve” controlling the rate of accumulation of national debt, as shown in Figure 7. In systems dynamics terms, the national debt is a kind “stock”, which is increased or decreased by the “flow” of annual deficits (or surpluses) from the annual government budget process. We can place this charted information about the budget deficit as a “control valve” on the “flow line” from the tax revenue “source” to the “stock” of national debt (national debt chart). These charts add more information to the systems dynamics model of the Greek fiscal system.
One sees how the system’s “control valve” of the “Budget Deficit” kept, over time, increasing the nation’s “stock” of its “National Debt”. In every economic fiscal crisis, a government promises to take “courageous measures”, such as cutting tax evasion and trimming public expenditure. Often it has been both a wide-spread- tax-evasion and a high-public-expenditure which has led to governmental fiscal crises. An earlier example was the Argentine fiscal crisis in 1999 [9] ; and this was also the case in Greece, as we will next see.
In systems terms, how did this continuing situation, (of the Greek governments’ fiscal condition) finally trigger the bond market reaction (a Minsky moment of Greek fiscal crisis)? As we noted, this was a “reflexivity” in bond market perception; and we have indicated “reflexivity” as a “feed-back” loop from the perception of the status of Greek national debt back onto the “risk” in the Greek bond market. The “reflexivity” of bond traders cognition was their expectation about whether or not the Greek government could continue to honor their bonds or default on payments due on their sovereign bonds.
But how does one measure (or chart) indications of reflexivity in sovereign bond markets? One indicator of the “reflexive perception” is the so-called “debt roll-over”. A government often needs to issue new sovereign bonds to finance the paying off of previous bonds whose maturity date is reached. Debt roll-over is the issuing of new debt to pay off maturing debt; and for Europe in 2010, this is shown in Figure 8.
Internationally, Greece stood out as requiring 20% of it debt to require refinancing each year―by paying off old bonds coming due through issuing new bonds (roll-over). And over 80% of this bond refinancing would need international purchases of Greek bonds. This was a very difficult financial situation, and bond traders lost confidence in Greece being able to continue such annual “roll-overs”―refinancing.
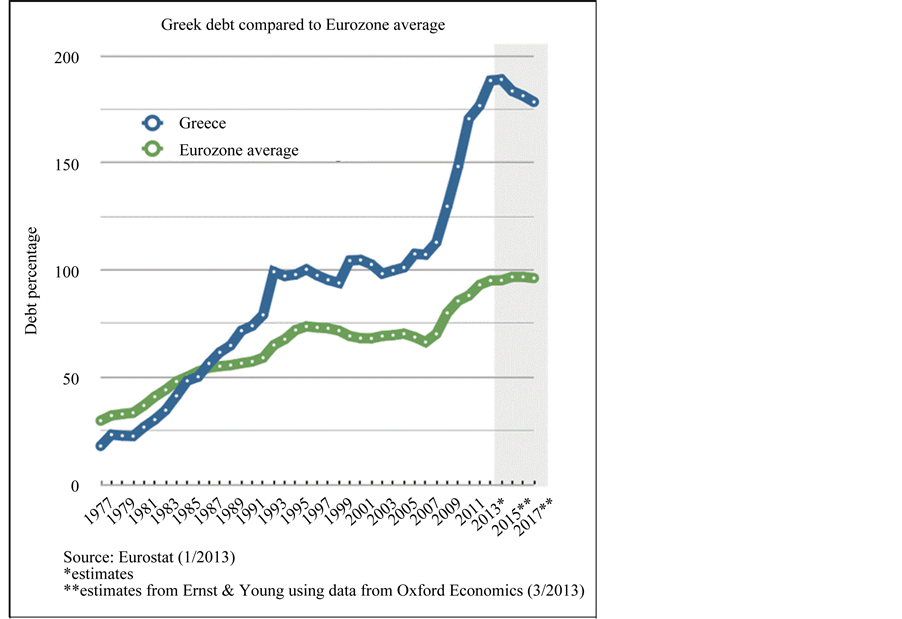
Figure 6. Greek debt compared to Eurozone average. http://en.wikipedia.org/wiki/Greek_government-debt_crisis.

Figure 7. Eu dollar crisis―Greece 2010 system analysis.
A second indicator of the “reflexive perception” about Greek finance by bond traders is how much national debt is being accumulated as a percentage of annual economic output or Gross Domestic Product (GDP). This indicates how many years of annual production could a country need to pay off its debt. Of course, no country could ever devote all of its production in one year (100% of GDP) to pay off debt. People would starve in that year. But if a country could devote 10% of its annual production (10% of economic revenue devoted to taxes), then a country could pay off in ten years. But even devoting 10% of production to paying off debt is unlikely, for this would be over and above the annual budget needs for government service. Accordingly, when national

Figure 8. Debt profile of eurozone countries 2010. http://en.wikipedia.org/wiki/Eurozone_crisis.
debt approaches the same value of GDP, bond traders get nervous about the ability of governments to continue to service their debt, to pay interest on their bonds, to refinance their debt―and not to default on debt. Figure 9 shows the Greek history of debt to GDP.
The important information on this chart is indicated by the red line. The red line is government debt as percentage of GDP. One sees that in 1995, total Greek government debt began to exceed (greater that 100%) total GDP. And then in 2010, debt jumped up to 140% of GDP, a sudden rise of 40% over the long period of excessive debt for the past fifteen years. This sudden rise contributed to the reflexive perception by the bond market that Greek government financing was unsustainable. It was in the fall of the preceding year (2009) that bond raters had begun rating down Greek sovereign bonds. When 2010 began, interest rates on new Greek bonds jumped higher.
Compared to other European countries, Greece’s high debt and large deficit was exceptional, as shown in Figure 10. This chart summarizes the “reflexive perceptions” about the unsoundness of Greek government fiscal policy. In 2009, the bond market began to see that Greece was in situation of an unsustainable debt-to-GDP ratio.
As shown in Figure 11, we can add all these charts about reflexivity to the systems diagram, on the system “feed-back loop” between stock of national debt and the sovereign bond market.
This graphic form of system-dynamics model (adding charts of information upon a system dynamics model) enables one to “sort out and relate” the relevant empirical information (which can often be found in the form of charts). Organizing (that is to say “pasting”) empirical charts into the system model facilitates the understanding of how the system components interact―system valves, system feeds, and system feed-back loops.
In the case of Greek fiscal policy, the government’s inability (unwillingness) to balance budgets, over time, had accumulated increasing national debt, serviceable only by new issues of sovereign bonds to foreign investors. This “feed-back loop” of national debt to international financial market operated over time―until perceptions in the bond market suddenly avoided future bond purchases―“reflexivity”. This market reflexivity triggered the fiscal crisis, but did not cause the crisis. There was no “cause” of the crisis―only a system dynamics of bad fiscal policy over time, which finally led up to a time of instability―a “Minsky moment” for the Greek government.
Unsound government policies can create government financial bubbles―as excessive market speculation can create stock market financial bubbles.
3. Austerity and Taxes
The Greek government response to the Greek fiscal crisis in 2010 was to seek outside help―rather than first

Figure 9. Combined charts of Greece’s GDP and debt, since 1970. Red is government debt as a percentage of GDP. http://en.wikipedia.org/wiki/Greek_government-debt_crisis.

Figure 10. Budget dificit and public debt to GDP-2009. Source: Eurostat. (http://en.wikipedia.org/wiki/Eurozone_crisis).

Figure 11. Eu dollar crisis―Greece 2010 system analysis.
trying to solve their own problem. Whether in government fiscal systems or financial market systems, it often happens in the “Minsky moments of financial bubbles” that the involved “speculators” seek “bail-outs”. Earlier, this had happened in the US Wall Street Bank Panic of 2008. In US case, banks sought “bail-out”, and in the European case, both banks and governments sought “bail-out”.
On April 23, 2010, the Prime Minister of Greece requested an emergency aid package from the European Union, European Central Bank and International Monetary Fund. On May 2, 2010, EU and IMF agree to a 110 billion euro aid package, over the next three years. The Greek government agreed to austerity measures of decreasing government employment and pensions and increasing tax collection. Greek sovereign bond ratings continued to decline. In 2011, both Moody’s and Fitch down list Greek bonds down to “junk” status, likely to default. In November 2011, the Greek Prime Minister resigned.
We will next add empirical data to the system “feed-back loop” of “tax policy”. As a condition of the aid package from the EU, the Greek government agreed to implement an austerity program. BBC News reported: “Greece is racing against time to enact profound changes to its economy, so as to reduce its debt mountain, clean up its public finances and avoid having to quit the eurozone. These changes are dictated by tough and controversial conditions set by the EU and IMF in return for two massive bailouts. The first (bailout) in May 2010, totaled 110 bn euros (£89 bn; $139 bn). The second, in March this year, totals 130 bn euros.” [10] . The Greek budget deficit was cut to 9.2% of GDP in 2011, down from 15.7% in 2009. Yet the Greek economy shrank by 11% over those two years.
Yet in tax reform, very little progress was actually made by the Greek government. Tax evasion and government corruption were not substantially addressed, as Phillip Inman reported: “Primary Greek tax evaders are the professional classes. Greece is riddled with corruption, but a study shows that banks, politicians and professional workers are largely to blame… There is a political dimension that is centre stage at the moment, following proposals for closer union and control from Brussels and, in Greece’s case, by the International Monetary Fund (IMF). Yet these economists ignore the challenges that beset a nation where very few people pay their taxes, where public-sector jobs are secured through family ties and where contracts for work, public or private, are rarely signed without someone in a position of power asking for a backhander. Greek banks are at the centre of the problem, as in Italy and Spain, where bankers perpetuate all the worst corrupt practices.” [11] .
Inman was basing his reporting partly upon a recent study of bank records by Artavanis Nikolaos, Adair Morse, and Margarita Tsoutsoura, who had gained access to records of one of the large banks in Greece. From that data, Nikolaos, Morese, and Tsoutsoura estimated the level unreported tax bases of professionals in Greece: “We begin with the new observation that banks lend to tax-evading individuals based on the bank’s perception of true income… We use household micro-data from a large bank in Greece and replicate bank models of credit capacity, credit card limits, and mortgage payments to infer the bank’s estimate of individuals’ true income. From this, we estimated a lower bound of 28 billion euros of unreported income for Greece. This foregone government-revenues amounted to 31 percent of the deficit for 2009. Primary tax evading occupations are doctors, engineers, private tutors, accountants, financial service agents, and lawyers.” [12] .
From this study, the Economist reported: “Nikolaos, Morse, and Tsoutsoura found that, when professionals approached the bank for a loan or mortgage, their tax returns showed their debts almost exceeded their incomes (debt payments ate up 82% of their incomes). For the beleaguered tax authority, this meant their income was too low to qualify for income tax. On average, they found the true income of self-employed people to be 1.92 times their reported income… (About) ?8 bn (£22.4 bn) of tax was evaded in 2009 by self-employed people alone. As GDP that year was ?35 bn and the total tax base was just ?8 bn, it is clear that this was a significant sum. At a tax rate of 40%, it amounted to almost half the country’s budget deficit in 2008, and 31% in 2009.” [13] . This sample was from one bank’s records. But it indicated the scale of the problem of “not-collected tax revenue”. Professionals had reported only about half their income; and that un-reported income could have contributed to (fixed) about one-half of the Greek annual budget deficit.
Data about uncollected taxes are very difficult to obtain. In another study, one on the “shadow economies” in Europe, Friedrich Schneider used electronic credit card data to estimate levels of unreported economies: “At an estimated ? trillion, the shadow economy in Europe is significant―ranging from 10 percent of gross domestic product (GDP) in the United Kingdom to almost 40 percent in some Central and Eastern European countries. Governments have formulated clear objectives to reduce this “other” marketplace, but with a range of causes and drivers, finding a solution is a complex task.” [14] . The Economist [13] used this report to chart an estimate of the underground economies Europe, including Greece, Figure 12.
This estimates that the size of the unreported economy (and hence untaxed) at about 25% of the reported Greek GDP. Adding the reported and unreported together indicated that 20% of the total Greek economy was completely untaxed {(25%/(100% + 25%) = 20%}.
Adding this information into the systems dynamics model in Figure 13, one can use this kind of information to gain an understanding of the lack of Reform in the Greek economy.
Also next to the tax revenue and sovereign bond sources, we have placed a map indicating “government insta-

Figure 12. Penumbral. Unofficial economies, % of GDP, 2010. Source: Friedtich Schneider, University of Linz. (http://www.economist.com/node/16792848_).

Figure 13. Eu dollar crisis―Greece 2010 system analysis.
Bility” in Europe, as a result of that Euro crisis which began in 2010. Many governments changed under the EURO crisis beginning in 2010. And many of these governments sought EU bailouts.
In 2010 in Greece the European Union began a bail-out of the Greek government fiscal crisis, imposing economic conditions of “austerity” on the Greek government. But even the EU’s “austerity” program for Greece, there occurred very little real “reform” of Greek tax policy and collection. An indication of this was the arrest and trial of a Greek journalist who dared to make public a list of tax evaders in Greece, as Mark Lowen reported: “Journalist Costas Vaxevanis has gone on trial in Athens for breach of privacy after publishing the names of 2000 Greeks with Swiss bank accounts. French authorities gave the names to their Greek counterparts two years ago, but documents were never investigated. Mr. Vaxevanis told the BBC that politicians should be prosecuted for keeping the names secret. But Greek officials have said there is no proof that those on the list have broken the law. Mr. Vaxevanis, 46, published the list in Hot Doc, the weekly magazine he edits. He is accused of breaking private data rules and faces up to two years in prison if convicted… Some of those named in the list, said to include many prominent Greeks, are suspected of using the HSBC accounts in Switzerland for tax evasion.” [15] .
Later Vaxevanis was acquitted of the charge. BBC News reported: “There was applause inside the court building as Mr. Vaxevanis was acquitted. A Greek journalist has been acquitted of breaching privacy for publishing the names of 2000 suspected tax evaders. Costas Vaxevanis published a list of Greeks with Swiss bank accounts, including a government minister and other prominent figures in public life. Lawyers for Mr. Vaxevanis, 46, argued that the charges were outrageous and said no-one on the list had actually complained of a breach of privacy. After a one-day trial, a court in Athens found Mr. Vaxevanis innocent... The BBC’s Mark Lowen in Athens says the swift ruling will be an embarrassment to the Greek government. Greece is being urged by international lenders to crack down on tax evasion as part of far-reaching reforms demanded in exchange for billions of euros of bailout money. The list of suspected evaders was reportedly leaked by an employee at the HSBC bank and passed to IMF chief Christine Lagarde when she was French finance minister in 2010. Ms. Lagarde apparently handed the list to the Greek authorities, but they took no action. Two of Greece’s former finance ministers have acknowledged seeing copies of the list. However, Yannis Stournaras, who took office in June, has told parliament he has not seen it. Mr. Vaxevanis said he had published the list because it was his job as a journalist to reveal the truth. “The three last governments have lied and have made a mockery of the Greek people with this list”, he said.” [16] .
In the earlier Figure 5, one sees that even by 2013, there was still a government deficit of 9 billion euros (the difference between the budget of 94 billion and the tax revenues of 85 billion). The feed-back loop of tax policy is the critical loop for sound government policy versus unsound government fiscal policy. If over time, tax revenues cannot support needed government services, then the financial system of a nation will be unstable in the long run.
4. Results
This systems-dynamics model of the Greek Fiscal Crisis in 2010 shows how to relate information (charts of data) one to another, to gain an explanation of the “dynamics” of the crisis―how the price disequilibrium in Greek bond interest rates occurred in 2009. This is not of a simple “causal” system; instead it is a “functional” model of a socio-technical system―government budget funding. And this is in the spirit of the Keynes-Minsky model of a financial market as a “dynamic” of the value of capital assets. Financial bubbles occur from “perceptions”― cognitive “reflexivity” in Soros’ term―expectations of the future values in a financial market. The Minsky “moment” occurs in the time when traders in a financial market have moved from speculative finance to the unstable reflexivity in Ponzi finance. The governments in Greece had indulged in the dynamics of a budget policy of “Ponzi” finance. Unsound fiscal policy over many years had accumulated a very large and increasing government debt―until bond market “reflexive cognition” triggered the Greek fiscal crisis in 2010. The “reflexive perception” of bond traders was that either the Greek government must “default” or be “bailed out”.
We have shown a system dynamics model only as a technique for organizing and connecting graphs of economic information. However in future research, data from such graphs could be embedded in more quantitative expressions, when functional correlations provide distinct linkages between empirical phenomena. But such detail goes beyond the intent of this paper. Here we only wished to show how to relate “price-disequilibrium models” to “system dynamic models” both in describe and explain government financial instability. System dynamics model can be used in “micro-economics” to explain the dynamics of economic systems―not only of econo- mic production [17] ―but also of national finance.
References
- Koenig, B. (2009) Fitch Downgrades Greece to A―From A. Bloomberg. http://www.bloomberg.com/apps/news?pid=munievents&sid=a6Y6T3olWgX0
- Smith, H. and Seager, A. (2009) Financial Markets Tumble after Fitch Downgrades Greece’s Credit Rating. The Guardian. http://www.theguardian.com/world/2009/dec/08/greece-credit-rating-lowest-eurozone
- McCulley, P. (2007) Teton Remarks. http://web.archive.org/web/20091124124300/http://www.pimco.com/LeftNav/Featured+Market+Commentary/FF/2007/GCBF+August-+September+2007.htm
- Soros, G. (1988) The Alchemy of Finance. Simon & Schuster, New York.
- Keynes, J.M. (1936) The General Theory of Employment, Interest, and Money. Harcourt Brace, New York.
- Minsky, H.P. (1982) Can “It” Happen Again? Essays on Instability and Finance. M.E. Sharpe Inc., New York.
- Betz, F. (2014) Disequilibrium Pricing Theory. Theoretical Economics Letters, 4, 60-67.
- Radzicki, M.J. and Taylor, R.A. (1997) Introduction to System Dynamics: A Systems Approach to Understanding Complex Policy Issues. US Department of Energy. http://www.systemdynamics.org/DL-IntroSysDyn/start.htm
- Betz, F. (2013) Macro and Micro-Economic Policies in Financial Crises: Argentina 2000 and South Korea 1998. Business and Management Research, 2. www.sciedu.ca/bmr
- BBC News (2012) Greece Austerity: How Far Still to Go? http://www.bbc.com/news/world-europe-18511963
- Inman, P. (2012) Primary Greek Tax Evaders Are the Professional Classes. The Guardian. http://www.theguardian.com/world/2012/sep/09/greece-tax-evasion-professional-classes?CMP=twt_gu
- Nikolaos, A., Morse, A. and Tsoutsoura, M. (2010) Tax Evasion Across Industries: Soft Credit Evidence from Greece. Chicago Booth Paper No. 12-25, University of Chicago, Chicago. http://ssrn.com/abstract=2109500
- Economist (2010) Southern Europe Will Have Trouble Increasing Its Tax Take. The Economist. http://www.economist.com/node/16792848
- Schneider, F. (2008) The Shadow Economy in Europe. Johannes Kepler Universitat Lintz, Linz. http://www.visaeurope.fr/media/images/shadow-economywhitepaper-58-8752.pdf
- Lowen, M. (2012) Greek Journalist Costas Vaxevanis on Trial over Bank List. BBC News. http://www.bbc.com/news/world-europe-20163430
- BBC News (2012) Greek Bank List Editor Costas Vaxevanis Acquitted. http://www.bbc.com/news/world-europe-20172516
- Forrester, J. (1961) Industrial Dynamics. Pegasus Communications, Waltham.