Paper Menu >>
Journal Menu >>
 Journal of Minerals & Materials Characterization & Engineering, Vol. 10, No.15, pp.1409-1428, 2011 jmmce.org Printed in the USA. All rights reserved 1409 Beneficiation and Characterization of Detrital Zircons from Beach Sand and Red Sediments in India Sunita Routray and R. Bhima Rao* Institute of Minerals and Materials Technology(Council of Scientific and Industrial Research) Bhubaneswar 751 013, India Corresponding Author: *bhimarao@immt.res.in, bhimarao@gmail.com ABSTRACT This paper deals with the recovery of zircon minerals from beach sand and red sediments of bad land topography and flow sheets with material balance are suggested. The experimental data reveal that the total heavy mineral content of red sediment sample is 43.9% in which zircon mineral concentrate is 2.75% by weight, where as for beach-dune sand sample the THM content is 16.7% in which zircon mineral concentrate is 0.16% by weight. It is found that U and Th and REE elements contents are much higher in red sediment zircon sample than beach sand zircon. Zircon concentrates recovered from beach-dune sand and red sediments contain 98 to 98.1% zircon with 79.6 to 80% recovery respectively. These zircon minerals from both the sources are suitable for industrial applications. Key words: Beach -Dune sand, Red Sediment, Zircon, Beneficiation, Characterization 1. INTRODUCTION Zircon has been recognised as a potential structural material because of its good combination of physical and mechanical properties, such as excellent chemical stability, thermal shock resistance, strength retention to high temperatures and low thermal expansion as well as low heat conductivity [1] . Owing to high demand of zircon, the exploitation of different deposits, which can be a potential source for this mineral, is a priority at present. Beach and dune sand deposits and red sediments of bad land topography are reported to be potential sources of heavy minerals along with zircon mineral [2, 3] . Hence, it has attracted the wide attention of scientists, engineers and users to exploit zircons from these deposits and in depth characterizations for end use. Zircon is used in industry in a wide range of applications, as zircon sand directly from the mine; as a milled product in the form of zircon flour (95 % micronized to <45µm used in the manufacturing of frit) and opacifier grade (100% micronized to <6 µm, used in ceramic glazes for tiles and sanitary wares). The most important market for zircon is as an opacifier for ceramic tiles and sanitary ware. Zircon finds its application in ceramics (54%) and refractory industries (14%), which account for 68% of zircon’s total world consumption of 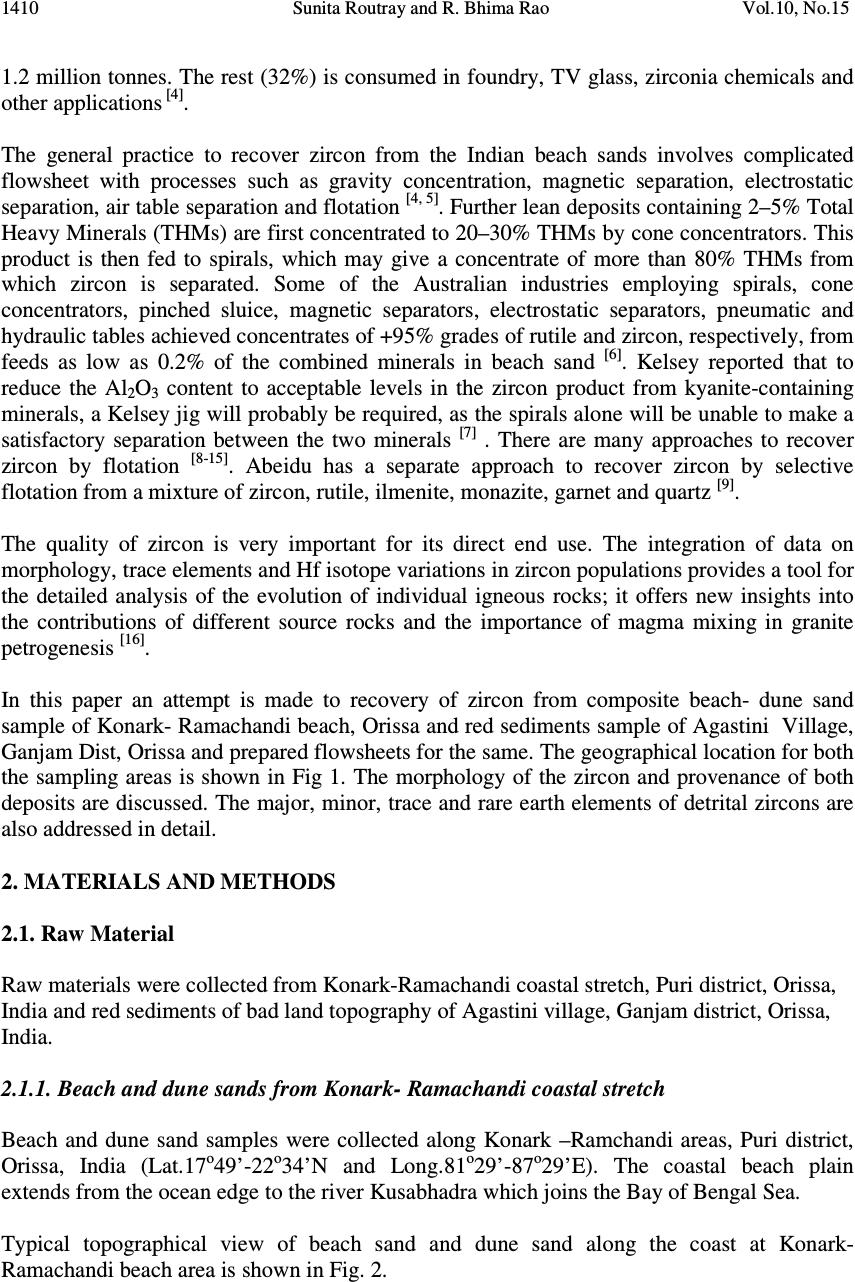 1410 Sunita Routray and R. Bhima Rao Vol.10, No.15 1.2 million tonnes. The rest (32%) is consumed in foundry, TV glass, zirconia chemicals and other applications [4] . The general practice to recover zircon from the Indian beach sands involves complicated flowsheet with processes such as gravity concentration, magnetic separation, electrostatic separation, air table separation and flotation [4, 5] . Further lean deposits containing 2–5% Total Heavy Minerals (THMs) are first concentrated to 20–30% THMs by cone concentrators. This product is then fed to spirals, which may give a concentrate of more than 80% THMs from which zircon is separated. Some of the Australian industries employing spirals, cone concentrators, pinched sluice, magnetic separators, electrostatic separators, pneumatic and hydraulic tables achieved concentrates of +95% grades of rutile and zircon, respectively, from feeds as low as 0.2% of the combined minerals in beach sand [6] . Kelsey reported that to reduce the Al 2 O 3 content to acceptable levels in the zircon product from kyanite-containing minerals, a Kelsey jig will probably be required, as the spirals alone will be unable to make a satisfactory separation between the two minerals [7] . There are many approaches to recover zircon by flotation [8-15] . Abeidu has a separate approach to recover zircon by selective flotation from a mixture of zircon, rutile, ilmenite, monazite, garnet and quartz [9] . The quality of zircon is very important for its direct end use. The integration of data on morphology, trace elements and Hf isotope variations in zircon populations provides a tool for the detailed analysis of the evolution of individual igneous rocks; it offers new insights into the contributions of different source rocks and the importance of magma mixing in granite petrogenesis [16] . In this paper an attempt is made to recovery of zircon from composite beach- dune sand sample of Konark- Ramachandi beach, Orissa and red sediments sample of Agastini Village, Ganjam Dist, Orissa and prepared flowsheets for the same. The geographical location for both the sampling areas is shown in Fig 1. The morphology of the zircon and provenance of both deposits are discussed. The major, minor, trace and rare earth elements of detrital zircons are also addressed in detail. 2. MATERIALS AND METHODS 2.1. Raw Material Raw materials were collected from Konark-Ramachandi coastal stretch, Puri district, Orissa, India and red sediments of bad land topography of Agastini village, Ganjam district, Orissa, India. 2.1.1. Beach and dune sands from Konark- Ramachandi coastal stretch Beach and dune sand samples were collected along Konark –Ramchandi areas, Puri district, Orissa, India (Lat.17 o 49’-22 o 34’N and Long.81 o 29’-87 o 29’E). The coastal beach plain extends from the ocean edge to the river Kusabhadra which joins the Bay of Bengal Sea. Typical topographical view of beach sand and dune sand along the coast at Konark- Ramachandi beach area is shown in Fig. 2. 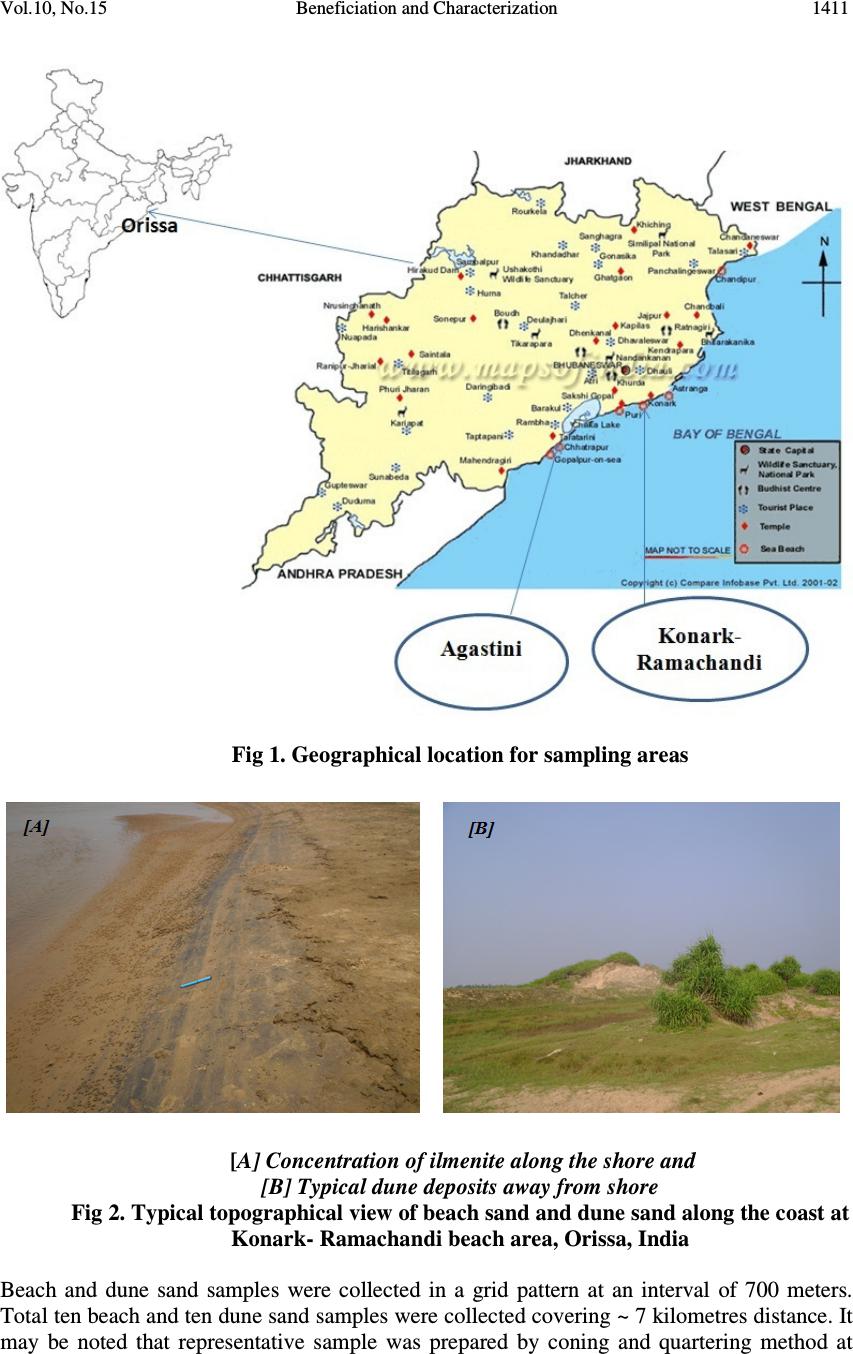 Vol.10, No.15 Beneficiation and Characterization 1411 Fig 1. Geographical location for sampling areas [A] Concentration of ilmenite along the shore and [B] Typical dune deposits away from shore Fig 2. Typical topographical view of beach sand and dune sand along the coast at Konark- Ramachandi beach area, Orissa, India Beach and dune sand samples were collected in a grid pattern at an interval of 700 meters. Total ten beach and ten dune sand samples were collected covering ~ 7 kilometres distance. It may be noted that representative sample was prepared by coning and quartering method at 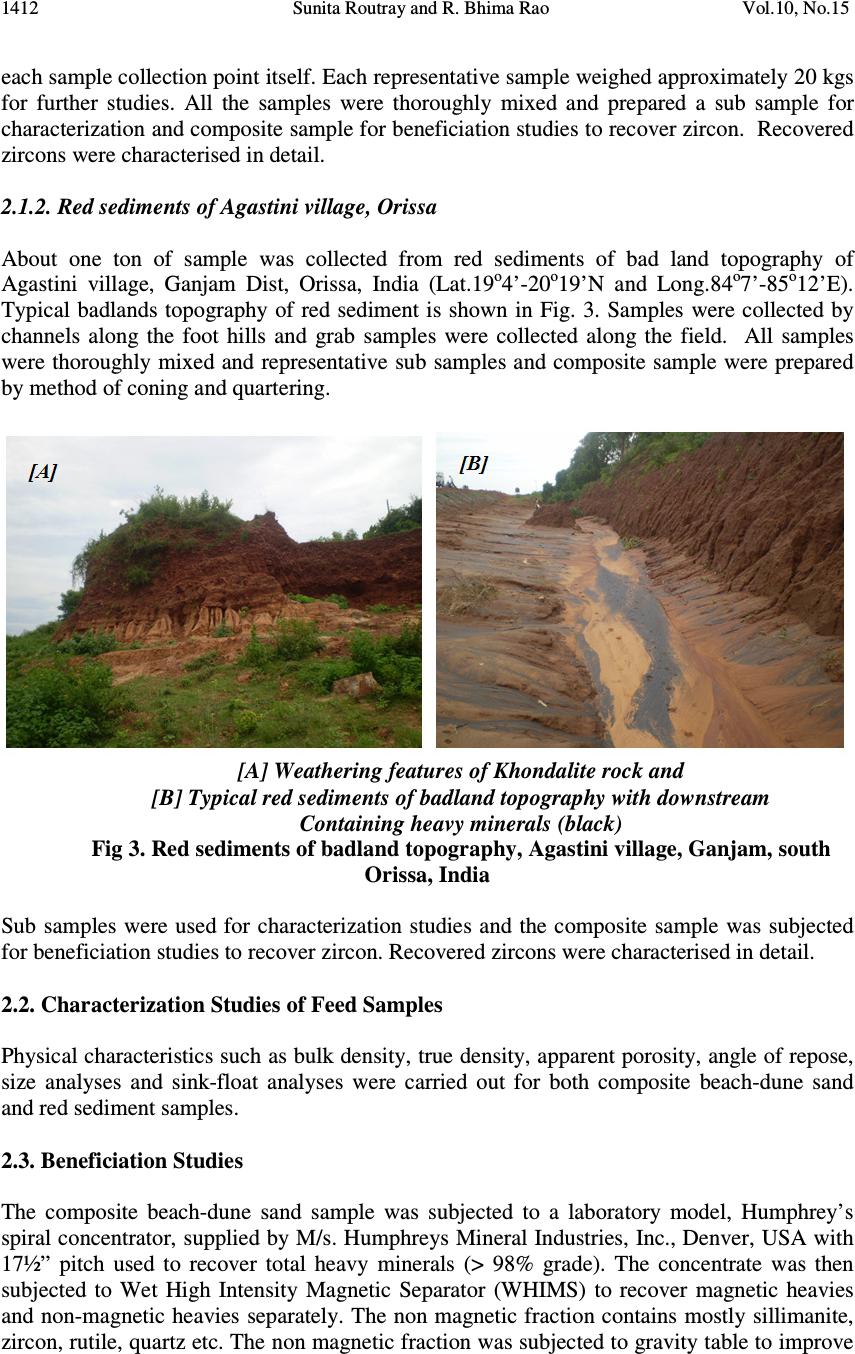 1412 Sunita Routray and R. Bhima Rao Vol.10, No.15 each sample collection point itself. Each representative sample weighed approximately 20 kgs for further studies. All the samples were thoroughly mixed and prepared a sub sample for characterization and composite sample for beneficiation studies to recover zircon. Recovered zircons were characterised in detail. 2.1.2. Red sediments of Agastini village, Orissa About one ton of sample was collected from red sediments of bad land topography of Agastini village, Ganjam Dist, Orissa, India (Lat.19 o 4’-20 o 19’N and Long.84 o 7’-85 o 12’E). Typical badlands topography of red sediment is shown in Fig. 3. Samples were collected by channels along the foot hills and grab samples were collected along the field. All samples were thoroughly mixed and representative sub samples and composite sample were prepared by method of coning and quartering. [A] Weathering features of Khondalite rock and [B] Typical red sediments of badland topography with downstream Containing heavy minerals (black) Fig 3. Red sediments of badland topography, Agastini village, Ganjam, south Orissa, India Sub samples were used for characterization studies and the composite sample was subjected for beneficiation studies to recover zircon. Recovered zircons were characterised in detail. 2.2. Characterization Studies of Feed Samples Physical characteristics such as bulk density, true density, apparent porosity, angle of repose, size analyses and sink-float analyses were carried out for both composite beach-dune sand and red sediment samples. 2.3. Beneficiation Studies The composite beach-dune sand sample was subjected to a laboratory model, Humphrey’s spiral concentrator, supplied by M/s. Humphreys Mineral Industries, Inc., Denver, USA with 17½” pitch used to recover total heavy minerals (> 98% grade). The concentrate was then subjected to Wet High Intensity Magnetic Separator (WHIMS) to recover magnetic heavies and non-magnetic heavies separately. The non magnetic fraction contains mostly sillimanite, zircon, rutile, quartz etc. The non magnetic fraction was subjected to gravity table to improve  Vol.10, No.15 Beneficiation and Characterization 1413 the grade of sillimanite. The concentrate from gravity table was subjected to flotation cell to recover sillimanite in flotation process. The flotation tailing subjected to High Tension Separator (HTS) to recover zircon in non conducting fraction. The composite red sediment sample was subjected to scrubbing for desliming. The deslimed feed was subjected to beneficiation studies as explained above for composite beach-dune sand sample. All products and tailings obtained from spiral concentrator, magnetic, flotation and HTS units were subjected to sink and float tests to assess the quality of the products. Initially sink float tests were carried out with bromoform (2.89 sp.gr) to assess the total heavy minerals content. Methylene iodide (3.3 sp.gr) was used to assess the sillimanite content in the total heavy minerals. 2.3. Characterization of Zircon Powdered feed zircons were subjected to X-ray diffraction (XRD) using PANanalytical (X’pert) powder diffractometer, (scan speed- 1.2°/min from 10° to 90°, by Mo Kα radiation) to identify the mineral phases in the corresponding fractions. The morphological studies of zircon minerals were carried out using scanning electron microscope (SEM). The grains were mounted on a SEM brass stub. The mounted quartz grains were coated with gold in a vacuum evaporator while the sample was being slowly rotated. Usually 15-20 grains were studied in detail and typical micrographs were taken by using JEOL JSM-5800 scanning electron microscope. The characterization of minerals on a sub-micron or nanometer scale was done by using in Via Raman microscopes, supplied with Renishaws at ambient pressure. Trace and REE analysis were carried out using ICP-OES at AMD, Hyderabad. Major elements analysis was also carried out by wet chemical methods at AMD, Hyderabad. 3. RESULTS AND DISCUSSION 3.1. Physical Characterization of Feed Samples Physical characterization of both composite beach-dune sand sample and red sediment samples are shown in Table 1. Red sediment sample contain high amount of slime (27.6% by weight). It is understood from the d 80 passing size data that the ROM red sediment sample is finer than the ROM composite beach-dune sand sample. The heavy mineral concentration is significant in red sediment sample which can be seen from the data given in Table 1 that the THM content of red sediment sample is 43.9% where as for beach-dune sand sample the THM content is 16.7% by weight. Typical results on size analysis followed by sink-float studies on close size fractions for beach-dune and red sediment samples are presented in Tables 2 and 3 respectively. Data presented in Table 2 reveals the coarser fraction +600 µm also contain small amount of total heavy minerals. Maximum percent of THM accumulated at below 100 µm size fraction 91.7 % to 97.9 % by weight.  1414 Sunita Routray and R. Bhima Rao Vol.10, No.15 Table 1. Physical properties of composite beach-dune sand and red sediment samples Properties details Co mposite beach - dune sand sample Red sediment sample Bulk density, g/cm 3 1.7 2.3 True density, g/cm 3 2.8 3.5 Porosity ,% 41.5 34.3 Angle of repose, º 32.6 41.0 d 80 passing size, µm 430 310 Total Heavy Minerals (THM), % 16.70 43.9 Total Magnetic Heavy Minerals (TMM), % 12.74 34.9 Total Non - Magnetic Heavy Minerals (TMM),% 3.96 9.0 Very Heavy Minerals (VHM >3.3 g/cm 3 ),% 0.63 39.7 Light Heavy Minerals (LHM <3.3 g/cm 3 ), % 3.33 4.2 Slimes, % - 27.6 Table 2. Typical results on size analysis followed by sink-float studies on close size fractions of composite beach-dune sand sample Table 3. Typical results on size analysis followed by sink-float studies on close size fractions of red sediment sample Size, µm Weight, % THM, % THM Distribution, % -1000+500 4.6 4.6 0.2 - 500+300 18.7 17.3 3.2 - 300+210 12.4 62.8 7.8 -210+150 31.7 88.7 28.1 -150+100 3.1 90.2 2.8 -100+75 1.9 92.4 1.8 -75 27.6 - - Total 100.0 - 43.9 Size, µm Weight, % THM, % THM Distribution, % -1000+600 6.2 2.2 0.1 -600+420 15.6 2.6 0.4 -420+300 20.0 4.2 0.8 -300-210 38.3 9.6 3.7 - 210+150 12.1 43.6 5.3 - 150+100 5.0 74.4 3.7 - 100+75 1.6 91.7 1.5 -75+45 0.7 94.4 0.7 -45 0.5 97.9 0.5 Total 100.0 - 16.7  Vol.10, No.15 Beneficiation and Characterization 1415 The data in Table 3, indicate that the highest size frequency contained in the sample is at – 210+150 µm (31.7 %) and lowest is at –100 +75 µm (1.9 %). The sink-float (minerals >2.89 g/cm 3 ) analytical data indicate that the size fraction -1000 + 500 µm size fraction contain almost 100% heavy minerals mostly garnet which has high industrial value. At finer size fraction it is seen that around 90 % of the sink fraction (heavy minerals) is concentrated in the size range 210 to 75 µm. 3.2. Beneficiation Studies 3.2.1. Recovery of Zircon from the composite beach-dune sand sample Zircon recovery flowsheet has been developed for composite sample collected from Konark- Ramachandi beach, which contains 0.16% zircon out of 16.7% THM. The flowsheet essentially consists of spirals, wet high intensity magnetic separator, flotation, gravity table and high tension separator. The results are given in Table 4. Table 4. Beneficiation studies on composite beach-dune sand sample to recover zircon Table 4a. Results of spiral concentrator Fraction Weight, % Wt. Distribution, % Zircon, % Recovery of zircon, % Concentrate Tailings 15.8 84.2 15.8 84.2 0.94 0.02 92.8 7.2 Total 100.0 100.0 0.16 100.0 Table 4b. Results of WHIMS on concentrate obtained in spiral concentrator (Table 4a) Fraction Weight, % Wt. Distribution, % Zircon, % Recovery of zircon, % Magnetic Non magnetic 10.8 5.0 68.4 31.6 0.07 2.82 4.7 88.1 Total 15.8 100.0 0.94 92.8 Table 4c Results of gravity table on non magnetic obtained in WHIMS (Table 4b) Fraction Weight, % Wt. Distribution, % Zircon, % Recovery of zircon, % Concentrate Tailings 3.8 1.2 76.0 24.0 3.6 0.2 86.6 1.5 Total 5.0 100.0 2.82 88.1 The data given in Table 4a indicates the results of spiral concentrator. Data reveals that the concentrate is 15.8 % by weight, contains 0.94 % zircon with 92.8 % recovery. The rejectable tailing contains only 0.02 % zircon. Results of WHIMS on concentrate obtained in spiral concentrator are presented in Table 4b. Results of this table reveals that 5.0 % non magnetic contain 2.82 % zircon with 88.1 % recovery. Magnetic fraction which is 10.8 % by weight contains only 0.07 % zircon. Table 4c shows the results of gravity table on non magnetic  1416 Sunita Routray and R. Bhima Rao Vol.10, No.15 fraction obtained in WHIMS. The concentrate contains 3.6 % zircon with 86.6 % recovery. Gravity table concentrate is subjected to flotation studies. Table 4d. Results of rougher flotation on concentrate obtained in gravity table (Table 4c) Fraction Weight, % Wt. Distribution, % Zircon, % Recovery of zircon, % Froth Tailings 3.3 0.5 86.8 13.2 0.2 26.6 3.5 83.1 Total 3.8 100.0 3.6 86.6 Table 4e. Results of scavenger flotation on tailings obtained in rougher flotation (Table 4d) Fraction Weight, % Wt. Distribution, % Zircon, % Recovery of zircon, % Froth Tailings 0.26 0.24 52 48 1.7 53.5 2.8 80.3 Total 0.5 100.0 26.6 83.1 Table 4f. Results of HTS on tailings obtained in scavenger flotation (Table 4e) Fraction Weight, % Wt. Distribution, % Zircon, % Recovery of zircon, % Conducting Non conducting 0.13 0.11 54.2 45.8 98.0 1.0 79.6 0.7 Total 0.24 100.0 53.5 80.3 After two stage flotation froth and tailing fractions are 0.26 and 0.24 % by weight respectively. The tailing fraction which is expected to contain mostly zircon contains 53.5 % zircon with 80.3 % recovery. Table 4e shows results of HTS on tailings obtained in flotation. Zircon concentrate which is recovered in the non conducting fraction contains 98.0 % zircon with 79.6 % recovery. The conceptual flow sheet with material balance on recovery of zircon is shown in Fig. 4. 3.2.2. Recovery of zircon from red sediment sample The red sediment sample contains 2.75% of zircon mineral. During scrubbing, 27.4 % of slimes are removed and THM percent enriches from 43.9 % in the feed to 60.6 % in the scrubbed feed, in which the zircon concentration is 3.8% by weight. The weight, % of the scrubbed feed sample becomes 72.4 %. But for convenience, the weight, % of the sample is considered 100% in all mass balance for the flow sheet development. The results of beneficiation studies are presented in Table 5.  Vol.10, No.15 Beneficiation and Characterization 1417 Fig. 4 Flow sheet with material balance to recover zircon concentrate from composite beach –dune sand sample of Konark- Ramachandi beach sand, Orissa Table 5. Beneficiation studies on scrubbed red sediment sample to recover zircon Table 5a. Results of spiral concentrator Fraction Weight, % Wt. Distribution, % Zircon, % Recovery of zircon, % Concentrate Tailings 60.00 40.00 60.00 40.00 6.00 0.50 94.7 5.3 Total 100.00 100.00 3.80 100.00 Table 5b. Results of WHIMS on concentrate obtained in spiral concentrator (Table 5a) Fraction Weight, % Wt. Distribution, % Zircon, % Recovery of zircon, % Magnetic Non magnetic 47.40 12.60 79.00 21.00 0.40 27.00 5.30 89.40 Total 60.00 100.00 6.00 94.70  1418 Sunita Routray and R. Bhima Rao Vol.10, No.15 Table 5c. Results of gravity table on non magnetic obtained in WHIMS (Table 5b) Fraction We ight, % Wt. Distribution, % Zircon, % Recovery of zircon, % Concentrate Tailings 12.00 0.60 95.23 4.77 28.10 3.80 88.80 0.60 Total 12.60 100.00 27.00 89.40 Table 5d. Results of Flotation cell on concentrate obtained in gravity table (Table 5c) Fraction Weight, % Wt. Distribution, % Zircon, % Recovery of zircon, % Froth Tailings 7.60 4.40 63.33 36.67 2.90 71.70 5.80 83.00 Total 12.00 100.00 28.10 88.80 Table 5e. Results of HTS on concentrate obtained in gravity table (Table 5d) Fraction Weight, % Wt. Distribution, % Zircon, % Recovery of zircon, % Conducting Non conducting 1.30 3.10 29.54 70.46 8.80 98.10 3.00 80.00 Total 4.40 100.00 71.70 83.00 The mass balance table can be explained as explained above for composite beach-dune sand sample. Final zircon concentrate which is recovered in the non conducting fraction contains 98.1 % zircon with 80.0 % recovery. The conceptual flow sheet with material balance on recovery of zircon from red sediment is shown in Fig. 5. 3.3. Characterization of Zircon Concentrate 3.3.1 Physical characterization The physical properties of zircon concentrate obtained from composite beach-dune sand and red sediment samples are shown in Table 6. The bulk and true densities for beach sand zircon are 2.74 gm/cc and 4.67 gm/cc respectively. Red sediment zircon also shows approximately same values for bulk and true densities. Table 6. Physical properties of zircon concentrate Details Zircon of beach- dune sand Zircon of red sediment Bulk density, g/cm 3 2.74 2.72 True density, g/cm 3 4.67 4.68 Porosity ,% 41.3 41.8 d 80 , µm 202 182  Vol.10, No.15 Beneficiation and Characterization 1419 Fig 5. Flowsheet with material balance to recover zircon concentrate from Red sediments of Agastini Village The wet size analyses of both beach-dune and red sediment samples are presented in Tables 7. It is seen from the tables that beach-dune sand zircon is slightly coarser than red sediment zircon. The +300 µm size fractions for beach sand also contain 0.6 weight % zircon. Table 7. Wet size analysis of zircon concentrate obtained from composite beach-dune sand sample and red sediments Size, µm Beach-dune sand sample Red sediments Weight, % Cumulative weight % passing Weight, % Cumulative weight % passing - 600+420 - 100.0 - - - 420+300 0.6 99.4 - 100.0 - 300 - 210 15.4 84 9.5 90.5 -210+150 36.3 47.7 49.2 41.3 -150+100 43.8 3.9 33.5 7.8 -100+75 3.6 0.3 7.4 0.4 -75+45 0.3 0.0 0.4 0.0 Total 100.0 - 100.0 -  1420 Sunita Routray and R. Bhima Rao Vol.10, No.15 3.3.2 Chemical characterization The wet chemical analysis of zircon is shown in Table 8. From this table it can be seen that the ZrO 2 % of beach sand zircon (63.33 %) is slightly higher than red sediment zircon (62.7 %). Table 8. Wet chemical analysis of beach sand and red sediment zircon HfO 2 content for beach sand and red sediment zircon is 1.2% and 0.9% respectively. U and Th contents of red sediment zircon sample are much higher than beach sand zircon. So, it can be concluded that the metamictization effect is more in red sediment zircon than beach sand zircon. 3.3.3. Mineralogical characterization 3.3.3.1 modal analysis The modal analysis of beach sand and red sediment zircon concentrate is presented in Figs 6 and 7respectively. Fig 6. Modal analysis of zircon concentrate recovered from composite beach-dune sand sample Fig 7. Modal analysis of zircon concentrate recovered from red sediment sample Samples SiO 2, % ZrO 2, % HfO 2, % Al 2 O 3, % TiO 2, % FeO, % Fe 2 O 3, % P 2 O 5, % Beach sand zircon 31.3 63.33 1.2 2.46 0.25 0.14 0.72 0.14 Red sediment zircon 29.7 62.70 0.9 4.3 0.1 0.4 0.8 0.2  Vol.10, No.15 Beneficiation and Characterization 1421 3.3.3.2 XRD analysis Zircon concentrates are subjected to XRD analysis and the diffraction patterns of beach sand and red sediment zircon are shown in Figs. 8 and 9 respectively. The beach sand zircon concentrate consists of only zircon phase revealing the quality of zircon minerals are high grade. Red sediment zircon along with zircon phase, shows some goethite and hematite phases. This is due to the fact that the feed red sediment sample contains a significant amount of iron. So, some amounts of iron may report in the product, zircon concentrate. Red sediment zircon shows minor amount of goethite and hematite iron bearing mineral phases along with zircon phase. In spite of physical separation processes involved in wet circuit for separation of individual heavy minerals, the end products contain small amount of ferrous coating. Due to this fact small amount of ferrous coating minerals are seen in the XRD. Fig 8. XRD of zircon concentrate recovered from composite beach sand sample Fig 9. XRD of zircon concentrate recovered from red sediment sample  1422 Sunita Routray and R. Bhima Rao Vol.10, No.15 3.3.3.3 SEM / EDAX The separated zircons are examined under optical microscope for documenting the morphological characteristics based on its colour, elongate, euhedral, spherical to rounded nature and inclusions of fluid and other minerals. SEM photomicrographs of zircons of composite beach sand sample are shown in Fig 10. The zircon mineral shown in Fig 10a is euhedral in nature. Well developed fractures found on this zircon surface are probably due to collision mechanisms during transportation. Euhedral characteristics of grains denote the igneous nature of parentage and are usually found in the massive charnockite suites [17] . Inclusions are also found in zircon minerals of Konark – Ramachandi beach (Figs. 10a, 10b, 10c & 10d). Murthy suggests that euhedral zircons (Figs. 10a) with dust inclusions suggest the possibility of their derivation from the granites and gneisses [18] . The inclusions of sillimanite in zircon (Fig. 10c) support metamorphic growth [19] . Sillimanite is a high rank metamorphic source [20] ; incorporated in the zircon mineral as inclusions; indicate that the zircons are from Talchir Basin of Barakar Formation. Thus, the zircon grains presents in Konark deposit exhibit evidence of parentage of igneous and metamorphic sources. Elongated and spherical zircon minerals with inclusion are also found in Konark deposits (Figs. 10b & 10d). Fig 10. SEM photomicrographs of zircons of composite beach sand sample  Vol.10, No.15 Beneficiation and Characterization 1423 SEM photomicrographs of zircons of red sediment samples are shown in Fig 11.As seen earlier for beach sand zircon, these minerals are also exhibits euhedral characteristics of grains. Fig.11 SEM of zircon from Agastini red sediment sample General view of all zircon grains (x60 magnification) can be seen in Fig 11a, where as Fig 11b zircon grains seen at x100 magnification shows some of the grains are broken, some of grains are well rounded and some are semi rounded. Most of the grains exhibit cracks (Fig. 11c) and few of them exhibits pits within the grains (11d). Surface corrosion is very common (11d). Since these grains are releasing out from the red sediments, it involves in the chemical weathering at a constant time and source. Hence it is expected more of surface corrosions. The zircon mineral grains expected are of same source of beach sand of Konark Ramachandi coastal area. Zircon minerals from both the sources are analyzed using EDAX and the results are shown in Table 9. The analysis shows major contents of zircon and silicon in zircon minerals of various strengths. Table 9. Distribution of Zr and Si in beach sand and red sediment zircon by SEM-EDAX Beach sand zircon Red sediment zircon Zr %Wt Si %Wt Zr %Wt Si %Wt 42.24 16.80 39.67 17.52 58.63 25.31 55.36 23.67  1424 Sunita Routray and R. Bhima Rao Vol.10, No.15 The results showed Zr ranging from 48.24 % to 58.63 % in weight and Si ranging from 16.8 % to 25.31 % for beach sand zircon. In case of red sediment zircon, Zr varies from 39.67 % to 55.36 % and Si varies from 17.52 % to 23.67 %. 3.3.4. Trace element analysis by ICP-OES Zircon minerals recovered from both the sources are subjected to ICP-OES analysis to assess REE abundance and patterns to discuss the provenance. In general, REE of zircons are widely used to interpret the geological environments by many scientists. The data acquired by ICP- OES for trace elements are summarized in Table 10 and data for REE elements are shown in Table 11. Trace element contains for both the samples show approximately similar values except ThO 2 , Cu and Zn. Data in Table 11 shows that REE elements of red sediment zircon are much higher than beach sand zircon. REE elements like La and Ce are 93 ppm and 238 ppm respectively present for beach sand zircon. Whereas for red sediment zircon, La content is 10630ppm and Ce content is 16980 ppm. Remaining REE elements also show higher values for red sediment zircon than beach sand zircon. These results also confirm that metamictization effect is more in red sediment zircon than beach sand zircon. Table 10. Trace elements of beach sand and red sediment zircon beach sand Samples ThO 2,, % U, ppm Nb 2 O 5,, % V ppm Cr ppm Cu ppm Zn ppm Ga ppm Sr ppm Ba ppm Beach sand zircon 0.05 322 <0.05 <20 225 <10 <10 112 <10 <50 Red sediment zircon 0.7 364 <0.05 <20 222 270 85 132 <10 <50 Table 11. REE abundance and patterns of beach sand and red sediment zircon Samples La Ce Pr Nd Sm Eu Gd Tb Ppm Ppm Ppm Ppm Ppm Ppm Ppm Ppm Beach sand zircon 93 238 12 58 13 6 37 8 Red sediment zircon 10630 16980 2176 8814 1195 35 453 100 Sample s Dy Ho Er Tm Yb Lu Y Sc, Ppm Ppm Ppm Ppm Ppm Ppm Ppm % Beach sand zircon 83 35 120 26 207 43 1048 <1 Red sediment zircon 210 55 149 33 224 44 1533 <1  Vol.10, No.15 Beneficiation and Characterization 1425 3.3.5. Raman spectrometry Raman spectrum of beach sand and red sediment zircon samples are shown in Figs 12 and 13 respectively. Beach sand zircon shows three main raman peaks: one at 349 cm -1 (ν 4 bending mode) , a second at 433 cm -1 (ν 2 bending mode) and a third at 999 cm -1 (antisymmetric stretching of the SiO 4 group) [21] . Beach sand zircon exhibits a trend of increasing raman spectrum peak intensities from core to rim of a crystal, which indicates a decrease in metamictization degree from core to rim. This corresponds to a trend of decreasing U+Th concentration from core to rim of a crystal based on the direct positive relationship between metamictization degree and U+Th concentration established by Nasdala [22] . Fig 12. Raman spectrometry of zircon from beach sand sample Fig13. SEM of zircon from red sediment sample Raman peaks for red sediment zircon shows three significant peaks. First peak at 355 cm -1 (ν 4 bending mode) , the second peak at 439 cm -1 (ν 2 bending mode) and the third peak at 1005 cm - 1 (ant symmetric stretching of the SiO 4 group). Red sediment zircon exhibits a trend of  1426 Sunita Routray and R. Bhima Rao Vol.10, No.15 decreasing raman spectrum peak intensities from core to rim of a crystal, which indicates a increase in metamictization degree from core to rim. This also corresponds to increasing U+Th concentration from core to rim of a crystal. 4. CONCLUSIONS The following conclusions are drawn from the beneficiation and characterization studies of beach sand and red sediment zircon. • The total heavy mineral content of red sediment sample (43.9%) is very high in comparison to beach-dune sand sample (16.7%). • Red sediment sample contains large amount of slimes (27.6%), whereas beach sand contain negligible amount of slimes. • Zircon concentrate recovered from beach-dune sand contains 98.0 % zircon with 79.6 % recovery. • Final zircon concentrate which is recovered from red sediment contains 98.1 % zircon with 80.0 % recovery. • ZrO 2 % of beach sand zircon (63.33 %) is slightly higher than red sediment zircon (62.7 %). • U and Th contents of red sediment zircon sample are much higher than beach sand zircon, which shows the metamictization effect is more in red sediment zircon than beach sand zircon. • Modal analyses shows beach sand zircon concentrate contains 98.0 % of zircon, 0.7 % rutile, 0.5 % sillimanite and 0.8 % other minerals and red sediment contains 98.1 % of zircon, 0.6 % rutile, 0.9 % sillimanite and 0.4 % other minerals. • XRD for beach sand zircon concentrate consists of only zircon phase whereas red sediment zircon along with zircon phase, shows some goethite and hematite phases. • REE elements of red sediment zircon are much higher than beach sand zircon. • Beach sand zircon exhibits a trend of increasing Raman spectrum peak intensities from core to rim of a crystal and red sediment zircon exhibits a trend of decreasing Raman spectrum peak intensities from core to rim of a crystal. • Metamictization effect is more in red sediment zircon than beach sand zircon. • These zircon minerals from both the sources are suitable for industrial applications. ACKNOWLEDGEMENTS The authors are thankful to Prof. B.K. Mishra, Director, Institute of Minerals and Materials Technology (CSIR), Bhubaneswar, for giving permission to publish this paper. Thanks also  Vol.10, No.15 Beneficiation and Characterization 1427 due to Mr. P.S.R Reddy, Head of Mineral Processing Department, for his constant encouragement to carry out this work for publication. One of the authors, Ms. Sunita Routray, is thankful to CSIR for granting SRF. REFERENCES 1. Singh, R.N., 1990, “High-Temperature Mechanical Properties of a Uniaxially Reinforced Zircon-Silicon Carbide Composite.” Journal of American Ceramic Society, Vol 73, No. 8, pp. 2399-2406. 2. Indian Minerals year book, 2008, Zircon. 3. Laxmi, T. and Bhima Rao, R., 2010, “Bad Land Topography of Coastal Belt Sediment Deposits of India: A Potential Resource for Industrial Minerals.” Mines and Minerals Reporter, Vol. 3, No. 7, pp.12-18. 4. Murtty Ch, V.G.K., Upadhyaya and Asokan, S., 2007, “Recovery of Zircon from Sattankulam Deposit in India- Problems and Prospects,” The 6 th International Heavy Minerals Conference “Back to Basics” The Southern African Institute of Mining and Metallurgy, pp. 69-74. 5. IREL Indian Rare Earths Ltd., 2005, OSCAM, IRE-TS. 6. TA, 1988, ‘Technology in Australia 1788–1988’, Mineral Sands, Chapter 10, Section IV, Australian Academy of Technological Sciences and Engineering, pp.762–764. 7. Jones, T.A. and Erasmus, W., 1999, “Efficient Enhanced Gravity Recovery of Zircon Using the Kelsey Centrifugal Jig.” The South African Institute of Mining and Metallurgy, DMS and Gravity Concentration Operations and Technology in South Africa, pp.87–108. 8. Bhima Rao, R., Reddy, P.S.R. and Misra, V.N., 2002, “Flotation Behaviors of Beach Sand Zircon in Association with Other Heavy Minerals”, All India Seminar on Zircons, Organized by IEI, Berhampur Center, Orissa, pp.1–7. 9. Abeidu, A.M., 1972, “The Separation of Monazite from Zircon by Flotation”, Journal of Less Common Metals, Vol. 29, No. 2, pp.113–119. 10. Bulatovic, S. and De Silvio, E., 2000, “Process Development of Impurity Removal from a Tin Gravity Concentrate”, Minerals Engineering, Vol. 13, Nos. 8–9, pp.871–879. 11. Gul, A., 2004, “Flotation Behaviours of Microlite and Zircon”, Minerals Engineering, Vol. 17, No. 4, pp.561–563. 12. Jiaying, T., Baoqi, S., Zhengbing, C. and Wenguang, L., 1993, “Study on New Technology of Separating Sea Beach Placer with Mixed Collectors”, XVIII International Mineral Processing Congress Sydney, Vol. 4, pp.1025–1030. 13. Manser, R.M., 1975, Handbook of Silicate Flotation, Warren Spring Laboratory, Stevenage, UK, p.58. 14. Pavez, O. and Peres, A.E.C., 1993, “Flotation of Monazite-Zircon-Rutile with Sodium Oleate and Hydroxamates”, XVIII International Mineral Processing Congress, Sydney, Vol. 4, pp.1007–1012. 15. Hosten, C., 2001, “Microflotability of Rutile and Zircon with Soap and Amine Type Collectors.” Physicochemical Problems of Mineral Processing, Poland, Vol. 35, pp.161– 170. 16. Belousova, E.A., Griffin, W.L., and O’Reilly, S.Y., 2006, “Zircon Crystal Morphology, Trace Element Signatures and Hf Isotope Composition as a Rool for Pertrogenetic Modelling: Examples from Eastern Australian Granitoids.” Journal of Petrology, Vol 47, No 2, pp. 329-353. 17. Ravindra Kumar, G.R. and Narayanaswamy, 1995, “Morphology of Zircons in Massive and Incipient Charnokites of Southern Kerala: Their Bearing on The Origin.” Current Science. 69(11), 941-944.  1428 Sunita Routray and R. Bhima Rao Vol.10, No.15 18. Murthy, M, V, N., 1969. Miscellaneous Publication 9 (Geological Survey of India. Calcutta), pp.246. 19. Zhang, Z., Shen, K., Xiao, Y., Hoefs, J., and Liou, J.G., 2006, “Mineral and Fluid Inclusions in Zircon of UHP Metamorphic Rocks from The CCSD-Main Drill Hole: A Record of Metamorphism and Fluid Activity.” Lithos, 92, 378-398. 20. Hota R, N, and Maejima, W., 2009, “Heavy Minerals of the Barakar Formation, Talchi Gondawana Basin, Orissa.” J. Geol. Soci. India. Vol.74, pp.375-384. 21. Dawson, P., Hargreave, M.M. and Wilkinson, G.R., 1971, “The Vibrational Spectrum of Zircon (ZrSiO 4 ).” Journal of Physics C.: Solid State Physics, Vol 4, pp.240-256. 22. Nasdala L, Pidgeon RT, Wolf D, 1996, “Heterogenous Metamictization of Zircon on Micro Scale.” Geochimica et Cosmochimica Acta, Vol. 60, No 6, pp.1091-1097. |