Paper Menu >>
Journal Menu >>
 Journal of Minerals & Materials Characterization & Engineering, Vol. 10, No.14, pp.1359-1377, 2011 jmmce.org Printed in the USA. All rights reserved 1359 Influence of Friction Stir Welding Parameters on Sliding Wear Behavior of AA6061/0-10 wt.% ZrB 2 in-situ Composite Butt Joints I. Dinaharan a* , N. Murugan b a Department of Mechanical Engineering, Karunya University, Coimbatore – 641114, Tamil Nadu, India. b Department of Mechanical Engineering, Coimbatore Institute of Technology, Coimbatore – 641014, Tamil Nadu, India. * Corresponding author: dinaweld2009@gmail.com ABSTRACT Over the last decade attempts have been made to fabricate aluminum matrix composites (AMCs) reinforced with several ceramic particles. Aluminum reinforced with ZrB 2 particles is one such AMC. The successful application of new kind of AMCs lies in the development of secondary processes such as machining and joining. Friction stir welding (FSW) is a relatively new solid state welding which overcomes all the setbacks of fusion welding of AMCs. An attempt has been made to friction stir weld AA6061/ 0-10 wt. % ZrB 2 in-situ composites and to develop empirical relationships to predict the sliding wear behavior of butt joints. Four factors, five levels central composite rotatable design has been used to minimize the number of experiments. The factors considered are tool rotational speed, welding speed, axial force and weight percentage of ZrB 2 . The effect of these factors on wear rate (W) and wear resistance (R) of the welded joints is analyzed and the predicted trends are discussed. Key words: Metal matrix composite, Friction stir welding, Wear. 1. INTRODUCTION The performance of soft aluminum alloys is enhanced with the reinforcement of hard ceramic particles. The resulting material is universally known as aluminum matrix composites (AMCs). The superior properties of AMCs have created an interest for feasible applications in several engineering fields including aerospace, automotive, marine and military [1, 2]. Variety of ceramic particles (SiO 2 , TiO 2 , AlN, Si 3 N 4 , TiC, B 4 C, TiB 2 and ZrB 2 ) has been tried in the recent past to fabricate AMCs apart from traditionally used Al 2 O 3 and SiC.  1360 I. Dinaharan, N. Murugan Vol.10, No.14 Adequate development of secondary processes such as cutting, forming, machining and joining of AMCs has not been fully established which limits its applications. The presence of ceramic particles reduces the weldability of AMCs. Attempts to join AMCs using established fusion welding processes resulted in porosity, coarse microstructure, segregation and decomposition of ceramic particles and formation of brittle intermetallic compounds. The high temperature attained in fusion welding increases the tendency of ceramic particles to react with aluminum matrix. Achieving homogeneous distribution of ceramic particles in the weld zone was found to be difficult. The mechanical properties of the joints were poor [3-6]. Friction stir welding (FSW) is a promising candidate to join AMCs without fusion welding defects. FSW was invented by The Welding Institute (TWI) in 1991. A non consumable rotating tool under sufficient axial force is plunged into the abetting edges of the plates to be joined and advanced along the line of the joint. The frictional heat generated by the tool softens the material and coalescence is achieved at the retreating side of the tool. The temperature rise during joining is well below the melting point [7]. Though FSW is primarily developed to join aluminum alloys intense research has been extended to join other alloys such as magnesium, copper, brass, steel, nickel and titanium [8]. Availability of limited literatures reveals the lack of exploration on all aspects of FSW of AMCs. Earlier works were focused on FSW of aluminum reinforced with either Al 2 O 3 or SiC [9-14]. Few works were reported on FSW of aluminum reinforced with B 4 C, TiB 2 , TiC and Mg 2 Si in the recent past [15-18]. Several researchers carried out FSW using a single set of parameters while few others attempted to study the influence of process parameters on joint properties. Prado et al. [9] examined the effect of rotational speed on tool wear of friction stir welded AA6061/20 vol % Al 2 O 3 and observed that the tool wear was non linear. Shindo et al. [10] estimated the effect of welding speed on tool wear of friction stir welded A359/20 vol % SiC and noticed different degree of weld zone hardening. Vijay and Murugan [16] assessed the effect of different tool pin profiles on microstructural evaluation of friction stir welded AA6061/10 wt % TiB 2 and found the square pin profile yielding higher tensile strength and finer grains in the weld zone. Nami et al. [17] analyzed the effect of tool rotational speed on microstructure and strength of friction stir welded Al/15 wt % Mg 2 Si and recorded different degree of weld zone hardening. Gopalakrishnan and Murugan [18] developed an empirical relationship to predict the strength of friction stir welded AA6061/ 3-7 wt % TiC and described the effect of welding speed, axial force, tool pin profile and weight percentage of TiC particles. Among feasible ceramic reinforcements ZrB 2 possesses strong covalent bonding, high melting point, high strength and hardness, good thermal conductivity and thermal shock resistance which make it a good promising candidate for extreme environments associated with aerospace industry [19]. Due to the unique properties of ZrB 2 it has the potential to be substituted for Al 2 O 3 and SiC [20].  Vol.10, No.14 Influence of Friction Stir Welding Parameters 1361 Lee et al. [21] compared the wear rate of friction stir welded AZ91/10 vol % SiC with parent composite and observed decrease in wear rate subsequent to FSW. However, he did not attempt to correlate the effect of FSW parameters on wear rate. This work is an attempt to develop empirical relationships to predict the sliding wear behavior of friction stir welded AA6061/0-10 wt % ZrB 2 butt joints and analyze the influence of process parameters on wear rate and wear resistance of the welded joints. AA6061 has been used as matrix. Experiments were conducted according to central composite rotatable design. A number of researchers utilized central composite rotatable design to conduct experiments and developed precise empirical relationships to predict the influence of process parameters on the responses [18, 22-24]. 2. SCHEME OF INVESTIGATION 2.1. Fabrication of AMCs The AA6061-T6 rods (Ø25 mm) were melted in an electrical furnace using a graphite crucible. The chemical composition of AA6061 rods is presented in Table1. The weighed quantities of inorganic salts K 2 ZrF 6 and KBF 4 were added into the molten aluminum to produce ZrB 2 . The temperature of the melt was maintained at 860 0 C. The melt was stirred intermittently for 30 minutes. After removing slag the melt was poured into a preheated die. Castings were obtained with different weight percentage (0, 2.5, 5, 7.5 and 10 %) of ZrB 2 . A detailed fabrication procedure and formation of in-situ ZrB 2 particles are available elsewhere [25]. Table 1: Chemical composition of AA6061-T6 Element Mg Si Fe Mn Cu Cr Zn Ni Ti Aluminum wt.% 0.95 0.54 0.22 0.13 0.17 0.09 0.08 0.02 0.01 Balance Figure 1: Dimensions of friction stir welding tool.  1362 I. Dinaharan, N. Murugan Vol.10, No.14 2.2. Identification of Process Variables The predominant FSW process parameters which influence the joint properties are tool rotational speed (N), welding speed (S) and axial force (F) [7]. The tool pin profile also plays a significant role on joint properties. A tool made of high carbon high chromium steel with square pin profile was used in this work [16]. The dimensions of the tool are shown in Fig.1. The weight percentage of ceramic particles in the composite was reported to influence the joint properties [15, 18]. Hence, the weight percentage of ZrB 2 particles (C) was also considered as a factor to understand its effects on sliding wear behavior. 2.3. Finding the Limits of the Process Variables The FSW window for producing sound welds in AMCs is narrower compared to unreinforced alloys due to the presence of ceramic particles [14]. A large number of trial welds were carried out to fix the working ranges of all selected process parameters. Each trial weld was inspected for smooth bead appearance and cross sectioned to verify the presence of defects such as pin hole, tunnel and worm hole in the weld zone. The limits of each process parameter were decided upon yielding defect free welds. The upper limit of a process parameter was coded as +2 and the lower limit was coded as –2 for the convenience of recording and processing experimental data. The coded values for intermediate values were calculated using the following relationship. X i = 2[2X – (X max + X min )] / (X max – X min ) (1) where X i is the required coded value of a variable X; X is any value of the variable from X min to X max ; X min is the lowest level of the variable; X max is the highest level of the variable. The decided levels of the selected process parameters with their units and notations are given in Table 2. Table 2: Friction stir welding parameters and their levels Levels No. Parameter Notation Unit -2 -1 0 1 2 1 Rotational speed N rpm 1000 1075 1150 1225 1300 2 Welding speed S mm/min 30 40 50 60 70 3 Axial force F kN 4 5 6 7 8 4 Zirconium boride C wt.% 0 2.5 5 7.5 10 2.4. Developing the Design Matrix The selected design matrix as shown in Table 3 is a central composite rotatable factorial design consisting of 31 sets of coded conditions. A detailed description of the design matrix is available elsewhere [22, 23]. 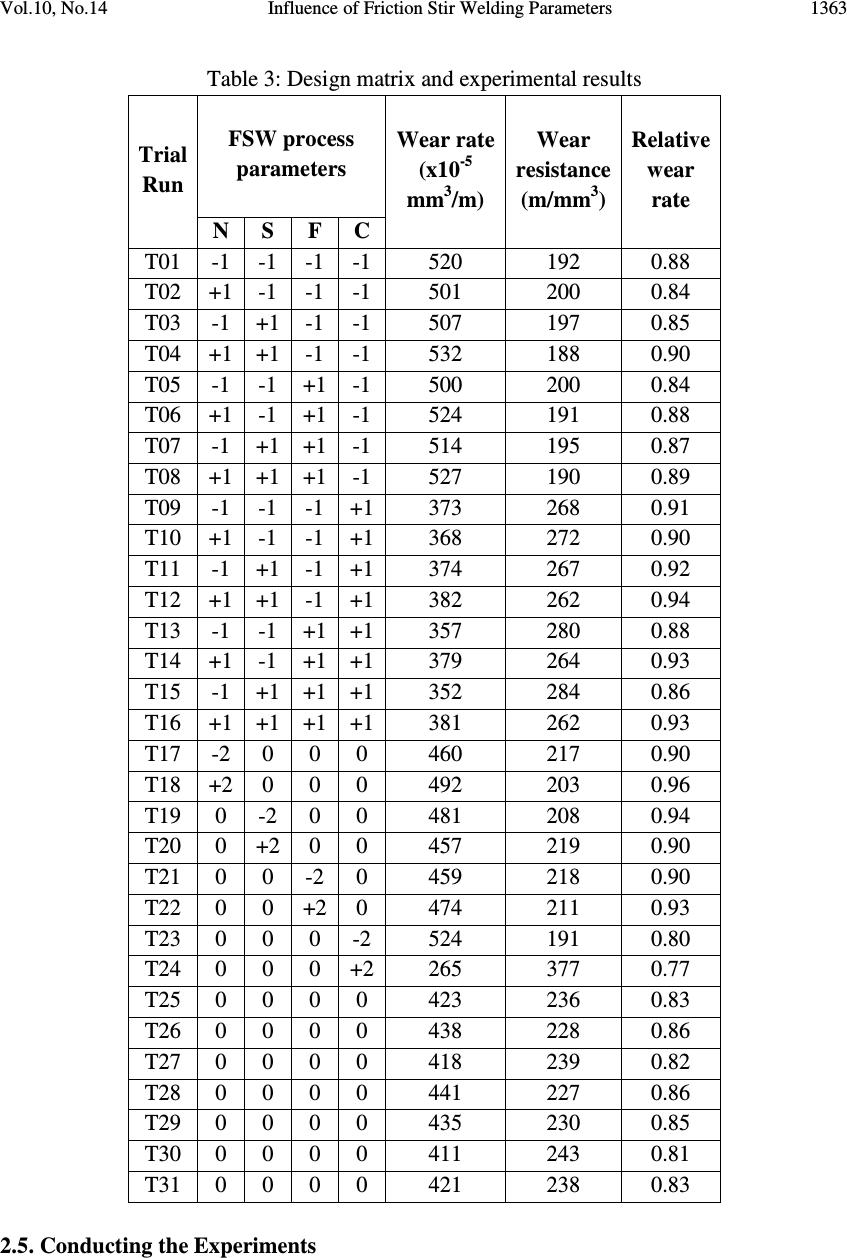 Vol.10, No.14 Influence of Friction Stir Welding Parameters 1363 Table 3: Design matrix and experimental results FSW process parameters Trial Run N S F C Wear rate (x10 -5 mm 3 /m) Wear resistance (m/mm 3 ) Relative wear rate T01 -1 -1 -1 -1 520 192 0.88 T02 +1 -1 -1 -1 501 200 0.84 T03 -1 +1 -1 -1 507 197 0.85 T04 +1 +1 -1 -1 532 188 0.90 T05 -1 -1 +1 -1 500 200 0.84 T06 +1 -1 +1 -1 524 191 0.88 T07 -1 +1 +1 -1 514 195 0.87 T08 +1 +1 +1 -1 527 190 0.89 T09 -1 -1 -1 +1 373 268 0.91 T10 +1 -1 -1 +1 368 272 0.90 T11 -1 +1 -1 +1 374 267 0.92 T12 +1 +1 -1 +1 382 262 0.94 T13 -1 -1 +1 +1 357 280 0.88 T14 +1 -1 +1 +1 379 264 0.93 T15 -1 +1 +1 +1 352 284 0.86 T16 +1 +1 +1 +1 381 262 0.93 T17 -2 0 0 0 460 217 0.90 T18 +2 0 0 0 492 203 0.96 T19 0 -2 0 0 481 208 0.94 T20 0 +2 0 0 457 219 0.90 T21 0 0 -2 0 459 218 0.90 T22 0 0 +2 0 474 211 0.93 T23 0 0 0 -2 524 191 0.80 T24 0 0 0 +2 265 377 0.77 T25 0 0 0 0 423 236 0.83 T26 0 0 0 0 438 228 0.86 T27 0 0 0 0 418 239 0.82 T28 0 0 0 0 441 227 0.86 T29 0 0 0 0 435 230 0.85 T30 0 0 0 0 411 243 0.81 T31 0 0 0 0 421 238 0.83 2.5. Conducting the Experiments  1364 I. Dinaharan, N. Murugan Vol.10, No.14 Plates of size 100 mm X 50 mm X 6 mm were prepared from the castings. The butt welding of AA6061- ZrB 2 composites was carried out automatically in an indigenously built FSW machine (M/s RV Machine Tools, Coimbatore, INDIA). The welding was carried out as per design matrix at random to eliminate any systematic errors creeping into the system. The tool was plunged into the abutting surfaces until the shoulder touched the surface of the plates. The machine table was advanced at the set welding speed after a short dwell period. The dwell period serves the purpose of generating the required heat to initiate plastic flow of the material. Typical welded plates of trial run 23 and 24 are shown in Fig.2. Figure 2: Photograph showing typical friction stir welded plates: a) T23 and b) T24. 2.6. Recording the Response Parameters Specimens of size 6 mm x 6 mm x 50 mm were extracted from each welded plate. The dry sliding wear behavior was measured using a pin-on-disc wear apparatus (DUCOM TR20-LE) at room temperature according to ASTM G99-04 standard. The polished surface of the pin was slid on a hardened chromium steel disc. The test was carried out at a sliding velocity of 1.5 m/s, normal force of 25 N and sliding distance of 2500 m. The wear parameters were selected to yield an appreciable steady state wear based on trial experiments. A computer- aided data acquisition system was used to monitor the loss of height. The volumetric loss was computed by multiplying the cross section of the test pin with its loss of height. The wear rate (W) and wear resistance (R) were calculated [26] as follows and given in Table 3. W (mm 3 /m) = Volumetric loss / Sliding distance (2) R (m/mm 3 ) = 1 / Wear rate (3) The sliding wear behavior of the parent composite was also measured at the same wear parameters and presented in Table 4. The relative wear rate was computed as given below and presented in Table 3. Relative wear rate = Wear rate of welded composite / Wear rate of parent composite (4)  Vol.10, No.14 Influence of Friction Stir Welding Parameters 1365 Table 4: Sliding wear behavior of AA6061/ZrB 2 in-situ composites ZrB 2 (wt.%) Wear rate (x10 -5 mm 3 /m) Wear resistance (m/mm 3 ) 0 657 152 2.5 594 168 5 510 196 7.5 408 245 10 345 290 2.7. Development of Empirical Relationships The response functions representing the wear rate and wear resistance of friction stir welded plates are functions of tool rotational speed (N), welding speed (S), axial force (F) and weight percentage of ZrB 2 (C) can be expressed as W = f (N, S, F, C) (5) R = f (N, S, F, C) (6) The second order polynomial regression equation used to represent the response surface ‘Y’ for K factors is given by k k k Y= b 0 + ∑ b i x i +∑ b ii x i2 +∑ b ij x i x j (7) i=1 i=1 i=1 where b 0 is the average of responses and b i , b ii and b ij are the coefficients which depend on respective main and interaction effects of the parameters. The values of the coefficients were estimated using the following expressions [27]. b 0 = 0.142857(∑Y) – 0.035714∑∑ (X ii Y) (8) b i = 0.041667 ∑ (X i Y) (9) b ii = 0.03125∑ (X ii Y) + 0.00372 ∑∑ (X ii Y) – 0.035714(∑Y) (10) b ij = 0.0625∑ (X ii Y) (11) The selected polynomial for four factors could be expressed as W = b 0 + b 1 (N) + b 2 (S) + b 3 (F) + b 4 (C) + b 11 (N 2 ) + b 22 (S 2 ) + b 33 (F 2 ) + b 44 (C 2 ) + b 12 (NS) + b 13 (NF) + b 14 (NC) + b 23 (SF) + b 24 (SC) + b 34 (FC) (12) R = b 0 + b 1 (N) + b 2 (S) + b 3 (F) + b 4 (C) + b 11 (N 2 ) + b 22 (S 2 ) + b 33 (F 2 ) + b 44 (C 2 ) + b 12 (NS) + b 13 (NF) + b 14 (NC) + b 23 (SF) + b 24 (SC) + b 34 (FC) (13) The coefficients were calculated using the software SYSTAT 12. The empirical relationships were developed after determining the coefficients. All the coefficients were tested for their significance at 95% confidence level. The insignificant coefficients were eliminated without  1366 I. Dinaharan, N. Murugan Vol.10, No.14 affecting the accuracy of the empirical relationships using t-test. The significant coefficients were taken into account to construct the final empirical relationships. The developed final empirical relationships with FSW parameters in coded form are given below. W = 426.714 + 6.708N – 0.042S + 0.292F – 69.875C + 10.936N 2 + 9.186S 2 + 8.561F 2 –9.439C 2 (14) R = 234.429 – 3.417 N + 0.25F + 40.75C – 5.857N 2 – 4.982S 2 – 4.732F 2 + 12.643C 2 (15) 2.8. Checking the Adequacy of the Empirical Relationships The statistical results of the developed empirical relationships are presented in Table 5. The predicted empirical relationship values will exactly match with the experimental results if R- Square value is 1. The higher values of ‘R-Square’ and lower values of standard error (SE) indicate that the empirical relationships are quite adequate and can be used to predict the responses (W and R) without appreciable error. The adequacy of the developed empirical relationships was also tested using the analysis of variance (ANOVA) technique which is presented in Table 6. The calculated values of F-ratio are greater than the tabulated values at 95% confidence level which means the developed empirical relationships are considered to be adequate. Further the validity of the empirical relationships is tested by drawing scatter diagrams as shown in Fig. 3. The experimental values and predicted values from the empirical relationships are scattered both sides and close to 45 0 line which indicate the perfect fitness of the developed empirical relationships. Table 5: Statistical results Response R-square Adjusted R-square Standard error W 0.976 0.967 12.002 R 0.976 0.968 7.26 Table 6: ANOVA results Response Source Sum of squares Degrees of freedom Mean- square F-ratio (calculated) F-ratio (tabulated) W Regression 129030.468 8 16128.81 111.97 2.40 Residual 3168.887 22 144.04 R Regression 47836.646 8 5979.581 113.45 2.40 Residual 1159.548 22 52.707 2.9. Validation of the Empirical Relationships Experiments were conducted to confirm the validity of the developed empirical relationships. Five weld runs were made using different values of tool rotational speed, welding speed and axial force other that those used in the design matrix and their wear rate and wear resistance were estimated. The results obtained are shown in Table 7. The error in prediction was  Vol.10, No.14 Influence of Friction Stir Welding Parameters 1367 calculated as [(experimental value – empirical relationship value) / empirical relationship value] X 100. It is found from the table that the error is within ± 7% which confirms the accuracy of the developed empirical relationships. Figure 3: Scatter diagram for the developed empirical relationships: (a) Wear rate and (b) Wear resistance. Table 7: Results of conformity experiments Wear rate (x10 -5 mm 3 /m) Wear resistance (m/mm 3 ) FSW process parameters Trial Run N S F C Experi mental Predicted Error (%) Experi mental Predicted Error (%) 1 1.25 -1.50 -1.25 -2 610.43 587.92 3.83 163.82 171.16 -4.29 2 0.75 -0.25 0.5 -1 525.78 501.20 4.90 190.19 199.10 -4.47 3 0.25 -0.75 1.5 0 425.05 453.97 -6.37 235.27 220.13 6.88 4 -0.5 0.75 0.75 1 378.56 356.95 6.05 264.16 282.79 -6.59 5 -1.5 -1.25 -0.5 2 270.35 280.15 -3.50 369.89 349.36 5.88 2.10. Wear Surface Morphology Wear surface of selected specimens were observed using scanning electron microscope (JEOL-JSM-6390). 3. RESULTS AND DISCUSSIONS The developed empirical relationships do not have any interaction terms (NS, NF, NC, SF, SC and FC).This reveals that the FSW parameters independently influence the sliding wear behavior of the welded composites over the entire region studied in this work. Compared to fusion welding the FSW parameters affect the joining process thermally as wells as  1368 I. Dinaharan, N. Murugan Vol.10, No.14 mechanically. Each parameter independently contributes to frictional heat generation in addition to stirring, extruding and forging the plasticized material. The effects of process parameters such as tool rotational speed, welding speed, axial force and weight percentage of ZrB 2 on sliding wear behavior of friction stir welded AA6061-ZrB 2 in-situ composites are evaluated using the developed empirical relationships. The trends obtained for each process parameter are represented in Figs.4-7. The possible causes for the effects of different process parameters on sliding wear behavior are elaborated as follows. 3.1. Effect of Tool Rotational Speed Fig.4 shows the sliding wear behavior of friction stir welded AA6061-ZrB 2 in-situ composites as a function of tool rotational speed. The wear rate decreases as tool rotational speed increases and reaches minimum at 1125 rpm. Further increase in tool rotational speed leads to increased wear rate. The wear resistance follows an inverse trend of wear rate as estimated. Figure 4: Effect of tool rotational speed on sliding wear behavior. The tool rotation generates frictional heat as well as stirring and mixing of material around the tool pin. Optimum stirring and sufficient heat generation is required to produce sound joints with fine recrystallized grains. When this condition is achieved during welding the joints produced will exhibit highest wear resistance. Increase in frictional heat generation is observed with increase in tool rotational speed. Lower heat input condition prevails at lower tool rotational speeds (1000 rpm and 1075 rpm) which are also associated with lack of stirring. The net result is poor consolidation of material which leads to poor wear resistance at lower tool rotational speeds. Higher tool rotational speeds (1225 rpm and 1300 rpm) lead to higher heat generation than required and release excessive stirred materials. Excessive stirring causes irregular flow of plasticized material. Micro level voids appear at higher tool rotational speeds. The frictional heat generated during welding affects the grain size [28]. Coarsening of grains takes place at higher tool rotational speeds which leads to poor wear resistance. Further the temperature distribution is influenced by tool rotational speed which may contribute to this trend.  Vol.10, No.14 Influence of Friction Stir Welding Parameters 1369 3.2. Effect of Welding Speed Fig.5 shows the sliding wear behavior of friction stir welded AA6061-ZrB 2 in-situ composites as a function of welding speed. The wear rate decreases as welding speed increases and reaches minimum at 50 mm/min. Further increase in welding speed leads to increased wear rate. The wear resistance follows an inverse trend of wear rate as estimated. The rotating tool stirs the material as discussed earlier. The welding speed prompts the translation of tool which in turn pushes the stirred material from front to the back of the tool pin and completes the welding. The rubbing of tool shoulder and pin with the work piece generates frictional heat. The welding speed determines the exposure time of this frictional heat per unit length of weld and subsequently affects the grain growth [28]. Optimum exposure time and translation of stirred material will lead to good consolidation of material with fine grains. Joints experience such condition during welding will exhibit higher wear resistance. Figure 5: Effect of welding speed on sliding wear behavior. 3.3. Effect of Axial Force Fig.6 shows the sliding wear behavior of friction stir welded AA6061-ZrB 2 in-situ composites as a function of axial force. The wear rate decreases as axial force increases and reaches minimum at 6 kN. Further increase in axial force leads to increased wear rate. The wear resistance follows an inverse trend of wear rate as estimated. Bonding occurs in FSW when a pair of surfaces is brought in the vicinity of inter atomic forces. Adequate axial force exceeding the flow stress of material is required to make defect free joints. Axial force propels the plasticized material in the weld zone to complete the extrusion process. Axial force is also responsible for the plunge depth of the pin [30].  1370 I. Dinaharan, N. Murugan Vol.10, No.14 Figure 6: Effect of axial force on sliding wear behavior. Frictional heat generated between the tool shoulder and the surface of the plate to be welded is dependent upon the coefficient of friction which is decided by the axial force. Optimum frictional heat coupled with sufficient extrusion of plasticized material is required to produce sound joints. When this condition is encountered during welding the joint will yield higher wear resistance. When axial force increases frictional heat generation also increases. Lower heat is generated at lower axial forces (4 kN and 5 kN) as well as cause improper consolidation of material. Micro voids appear at lower axial forces which leads to poor wear resistance at lower axial forces. Higher heat is generated exceeding the desired level at higher axial forces (7 kN and 8 kN). The plunge depth of the tool into the welded plate is higher at higher axial forces. Further the flash level increases with increased axial force. Increased flash level causes local thinning of welded plate leading to poor wear resistance at higher axial forces. 3.4. Effect of ZrB 2 Particles Fig.7 shows the sliding wear behavior of friction stir welded AA6061-ZrB 2 in-situ composites as a function of weight percentage of ZrB 2 particles. The wear rate decreases with increase in ZrB 2 content while the wear resistance follows an inverse trend as estimated. The joints fabricated at N = 1150 rpm, S = 50 mm/min and F = 6 kN show higher wear resistance. Good consolidation of material with optimum stirring and adequate heat generation may be taking place at this combination of parameters. It is evident from Table 4 that addition of in-situ formed ZrB 2 particles improved the wear resistance of AA6061. This can be attributed to the hardness imparted by the in-situ formed ZrB 2 particles due to the creation of strain fields around the particles during solidification. The increase in wear resistance of welded joints with increased ZrB 2 particles is due to increased presence of ZrB 2 particles in the weld zone. This leads to a conclusion that FSW resulted in homogeneous distribution of ZrB 2 particles irrespective of weight percentage studied in this work.  Vol.10, No.14 Influence of Friction Stir Welding Parameters 1371 Figure 7: Effect of weight percentage of ZrB 2 on sliding wear behavior. The inherent characteristic of applying FSW to ceramic particulate reinforced metal matrix composites is the ability to provide identical distribution of ceramic particles in the weld zone to that of parent composite. The weight percentage of ZrB 2 particles was considered as a process parameter to substantiate this statement. Figs.8-9 reveal the microstructure of parent composite and weld zone of joints which have different weight percentage of ZrB 2 particles. The specimens were prepared as per standard metallographic procedure and color etched with 1 g NaOH, 4 g KMnO 4 in 100 ml distilled water. ZrB 2 particles appear as white and circular in shape. The reaction of K 2 ZrF 6 with KBF 4 produced ZrB 2 particles at varying sizes. The uniform distribution of ZrB 2 particles in the welded joints irrespective of weight percentage is explicit. 3.5. Effect of FSW The effect of FSW on the developed AMCs is indicated by the relative wear rate. Table 3 shows the relative wear rate of all the welded composites which is observed to be less than one. The wear resistance of the composites improved subsequent to FSW which is described as follows. FSW closes the presence of micro porosities in the cast composite. The grain size of aluminum in the weld zone is reduced by dynamic recrystallization. It is evident from Figs.8-9 that FSW resulted in fragmentation of ZrB 2 particles. The weld zone is filled with more particles homogeneously dispersed compared to parent composite. Consequently the dislocation density in the weld zone increases. The age hardening and softening characteristics of cast composite is different to that of wrought/heat treated composite. The above factors contribute to hardening of weld zone. The degree of hardening is dictated by the process parameters [10, 17] which results in improved wear resistance of the AMCs.  1372 I. Dinaharan, N. Murugan Vol.10, No.14 Figure 8: Photomicrographs of base composites containing ZrB 2 : a) 0% (T23); b) 2.5% (T01); c) 5% (T29); d) 7.5% (T15) and e) 10% (T24). 3.6. Wear Surface Morphology Fig.10 reveals the SEM micrographs of wear surface of selected specimens with different weight percentage of ZrB 2 particles. A change in wear mode is observed with increase in weight percentage of ZrB 2 particles which can be attributed to the homogeneous distribution of ZrB 2 particles in the weld zone as a result of FSW. The wear mode changes from adhesion (Fig.10a-b) to abrasive wear (Fig.10c-e). Welded matrix alloy and composite containing 2.5 weight percentage of ZrB 2 particles exhibit adhesion wear mode. The frictional heat increases  Vol.10, No.14 Influence of Friction Stir Welding Parameters 1373 wear surface temperature which causes plastic deformation and dislocation in the inner surface of the composites. Figure 9: Photomicrographs of Weld zone of AMCs containing ZrB 2 : a) 0% (T23); b) 2.5% (T01); c) 5% (T29); d) 7.5% (T15) and e) 10% (T24). The congestion of dislocation results in stress concentration and initiation of cracks. Welded composites containing weight percentage of ZrB 2 particles above 2.5 exhibits abrasive wear mode. The abrasive wear is the result of ZrB 2 particles on the wear surface and the abrasive dusts between two surfaces. ZrB 2 particles bear the load initially. As sliding wear proceeds  1374 I. Dinaharan, N. Murugan Vol.10, No.14 the frictional heat softens the surface layer. The difference in thermal expansion coefficient between the matrix and the ZrB 2 particles creates the interface stress. When the interface stress exceeds the bond strength the particles are pulled off. The pulled off particles begin to act as wear particles in the sliding wear course. Figure 10: SEM micrograph of wear surface of specimens with: a) 0 wt.% ZrB 2 (T23); b) 2.5 wt.% ZrB 2 (T02); c) 5.0 wt.% ZrB 2 (T30); d) 7.5 wt.% ZrB 2 (T11) and e) 10 wt.% ZrB 2 (T24).  Vol.10, No.14 Influence of Friction Stir Welding Parameters 1375 4. CONCLUSIONS The following conclusions are derived from the present work: • Empirical relationships incorporating the welding parameters are developed to predict the sliding wear behavior of AA6061/0-10 wt.% ZrB 2 in-situ composite butt welded joints. • The process parameters independently influence the sliding wear behavior over the entire range of parameters studied. • The joints fabricated at N = 1150 rpm, S = 50 mm/min and F = 6 kN yields highest wear resistance. • A homogeneous distribution of ZrB 2 particles in the welded joints irrespective of weight percentage is observed. • FSW enhances the wear resistance of the developed AMCs • A change in the wear mode from adhesion wear to abrasive wear with the increase in weight percentage of ZrB 2 particles is observed. ACKNOWLEDGEMENT The authors are grateful to the Management and Department of Mechanical Engineering, Coimbatore Institute of Technology, Coimbatore, India for extending the facilities to carry out this investigation. The authors acknowledge the financial support rendered by All India Council for Technical Education, Govt. of India. The corresponding author acknowledges the INSPIRE fellowship awarded by Department of Science and Technology, Govt. of India. Authors are also thankful to Mr.S.J.Vijay, Mr.K.Kalaiselvan, Mr.B.Ashok Kumar, Mr.A.Raja, Mr. A. Samson Ratnakumar, Mr. S.Vijaya Ganesh, Mr. Palanisamy and Mr. Mahalingam for their assistance. REFERENCES [1] Miracle, D.B. , 2005, “Metal matrix composites – From science to technological significance”, Composites Science and Technology, Vol.65, pp. 2526–2540. [2] Rosso, M., 2006, “Ceramic and metal matrix composites: Routes and properties”, Journal of Materials Processing Technology, Vol.175, pp. 364–375. [3] Huang, R.Y. , Chen, S.C. , Huang, J.C., 2001,“Electron and Laser Beam Welding of High Strain Rate Superplastic Al-6061/SiC Composites”, Metallurgical and Materials Transactions A, Vol.32, pp.2575-2584. [4] Lean, P.P., Gil, L., Ureña, A. , 2003, “Dissimilar welds between unreinforced AA6082 and AA6092/SiC/25p composite by pulsed-MIG arc welding using unreinforced filler alloys” (Al–5Mg and Al–5Si), Journal of Materials Processing Technology, Vol.143– 144, pp. 846–850.  1376 I. Dinaharan, N. Murugan Vol.10, No.14 [5] Storjohann, D. , Barabash, O.M. , Babu, S.S., David, S.A., Sklad, P.S., Bloom, E.E., 2005, “Fusion and Friction Stir Welding of Aluminum-Metal-Matrix Composites”, Metallurgical and Materials Transactions A, Vol.36, pp.3237-3247. [6] Bassani, P., Capello, E., Colombo, D., Previtali, B., Vedani, M., 2007, “Effect of process parameters on bead properties of A359/SiC MMCs welded by laser”, Composites: Part A, Vol.38, pp.1089–1098. [7] Mishra, R.S., Ma, Z.Y., 2005, “Friction stir welding and processing”, Materials Science and Engineering R, Vol.50, pp.1–78. [8] Nandan, R., Roy, T.D., Bhadeshia, H. K. D. H., 2008, “Recent Advances in Friction Stir Welding – Process, Weldment Structure and Properties”, Progress in Materials Science, Vol.53, pp.980-1023. [9] Prado, R.A. , Murr, L. E. , Shindo, D. J., Soto, K.F., 2001, “Tool wear in the friction-stir welding of aluminum alloy 6061+20% Al2O3: a preliminary study”, Scripta materialia, Vol.45, pp.75-80. [10] Shindo, D. J., Rivera, A. R., Murr, L. E., 2002, “Shape optimization for tool wear in the friction-stir welding of cast AI359-20% SiC MMC”, Journal of Materials Science, Vol.37, pp. 4999 – 5005. [11] Marzoli L.M., Strombeck, A.V., Santos, J.F. D, Gambaro, C. , Volpone, L.M., 2006, “Friction stir welding of an AA6061/Al 2 O 3 /20 p reinforced alloy”, Composites Science and Technology, Vol.66, pp.363–371. [12] Amirizad, M., Kokabi, A.H., Gharacheh, M. A, Sarrafi, R., Shalchi, B., Azizieh, M., 2006, “Evaluation of microstructure and mechanical properties in friction stir welded A356+15%SiC p cast composite”, Materials Letters, Vol.60, pp.565–568. [13] Ceschini, L., Boromei, I., Minak, G., Morri, A., Tarterini, F., 2007, “Effect of friction stir welding on microstructure, tensile and fatigue properties of the AA7005/10 vol.%Al2O3p composite”, Composites Science and Technology, Vol.67, pp.605–615. [14] Feng, A.H., Xiao, B.L., Ma, Z.Y., 2008, “Effect of microstructural evolution on mechanical properties of friction stir welded AA2009/SiC p composite”, Composites Science and Technology, Vol.68, pp.2141–2148. [15] Chen, X.G., Silva, M. D., Gougeon, P., Georges, L. S., 2009, “Microstructure and mechanical properties of friction stir welded AA6063–B 4 C metal matrix composites”, Materials Science and Engineering A, Vol.518, pp.174–184. [16] Vijay, S.J., Murugan, N., 2010, “Influence of tool pin profile on the metallurgical and mechanical properties of friction stir welded Al–10 wt.% TiB 2 metal matrix composite”, Materials and Design, Vol.31, pp.3585–3589. [17] Nami, H., Adgi, H., Sharifitabar, M., Shamabadi, H., 2010 “Microstructure and mechanical properties of friction stir welded Al/Mg 2 Si metal matrix cast composite”, Materials and Design, Vol.32, pp.976–983. [18] Gopalakrishnan, S., Murugan, N., 2011, “Prediction of tensile strength of friction stir welded aluminum matrix TiC p particulate reinforced composite”, Materials and Design, Vol.32, pp.462–467. [19] Sonber, J.K., Murthy, T.S.R.C., Subramanian, C., Kumar, S., Fotedar, R.K., Suri, A.K., 2011, “Investigations on synthesis of ZrB 2 and development of new composites with  Vol.10, No.14 Influence of Friction Stir Welding Parameters 1377 HfB 2 and TiSi 2 ”, International Journal of Refractory Metals and Hard Materials, Vol.29, pp.21–30. [20] Guo, S.Q., Kagawa, Y., Nishimura, T., 2009, “Mechanical behavior of two-step hot- pressed ZrB 2 -based composites with ZrSi 2 ”, Journal of the European Ceramic Society, Vol.29, pp.787–794. [21] Lee, W.B., Lee, C.Y., Kim, M.K., Yoon, J., Kim, Y.J, Yoen, Y.M., Jung, S.B., 2006, “Microstructures and wear property of friction stir welded AZ91 Mg/SiC particle reinforced composite”, Composites Science and Technology, Vol.66, pp.1513–1520. [22] Elangovan, K., Balasubramanian, V., Babu, S., 2009, “Predicting tensile strength of friction stir welded AA6061 aluminum alloy joints by a mathematical model”, Materials and Design, Vol.30, pp.188–193. [23] Sundaram, N. S., Murugan, N., 2010, “Tensile behavior of dissimilar friction stir welded joints of aluminum alloys”, Materials and Design, Vol.31, pp.4184–4193. [24] Kumar, S., Balasubramanian, V., 2010, “Effect of reinforcement size and volume fraction on the abrasive wear behaviour of AA7075Al/SiCp P/M composites—A statisticalanalysis”, Tribology International, Vol.43, pp. 414–422. [25] Kumar, G.N., Narayanasamy, R., Natarajan, S., Babu, S.P. K., Sivaprasad, K., Sivasankaran, S., 2010, “Dry sliding wear behavior of AA 6351-ZrB 2 in situ composite at room temperature”, Materials and Design, Vol.31, pp.1526–1532. [26] Mandal, A., Chakraborty, M., Murty, B.S., 2007, “Effect of TiB 2 particles on sliding wear behaviour of Al–4Cu alloy”, Wear, Vol.262, pp.160–166. [27] Box, G.E.P., Hunter, W.H, Hunter, J.S., 1978, “Statistics for experiments”, Ed.10, Wiley, NewYork. [28] Karthikeyan, L., Senthilkumar, V.S., Padmanabhan, K.A., 2010, “On the role of process variables in the friction stir processing of cast aluminum A319 alloy”, Materials and Design, Vol.31, pp.761–771. [29] Cavaliere, P., Squillace, A., Panella, F., 2008, “Effect of welding parameters on mechanical and microstructural properties of AA6082 joints produced by friction stir welding”, Journal of Materials Processing Technology, Vol.200, pp.364–372. [30] Kumar, K., Kailas, S.V., 2008, “On the role of axial load and the effect of interface position on the tensile strength of a friction stir welded aluminum alloy”, Materials and Design, Vol.29, pp.791–797. |