Paper Menu >>
Journal Menu >>
 Journal of Minerals & Materials Characterization & Engineering, Vol. 10, No.14, pp.1307-1327, 2011 jmmce.org Printed in the USA. All rights reserved 1307 Study of Potentiodynamic Polarization Behaviour of Electroless Ni-B Coatings and Optimization using Taguchi Method and Grey Relational Analysis Suman Kalyan Das and Prasanta Sahoo* Department of Mechanical Engineering, Jadavpur University, Kolkata 700032, India *Corresponding author: psahoo@mech.jdvu.ac.in, psjume@gmail.com ) ABSTRACT Electroless nickel coatings are very popular for their corrosion resistant actions. The present article attempts to study the corrosion behaviour of electroless Ni-B coatings by varying the coating parameters viz. bath temperature, reducing agent concentration and nickel source concentration together with the annealing temperature. The electrochemical parameters viz., corrosion potential and corrosion current density are evaluated with the help of potentiodynamic polarization experimentation. Taguchi based Grey analysis is employed in order to optimize this multiple response problem and the optimal combination of parameters for maximum corrosion resistance for Ni-B coatings is presented. Moreover, analysis of variance reveals that bath temperature and concentration of nickel source have significant influence on the corrosion performance of the coating. The microstructure characterization of the coating is also conducted with the help of scanning electron microscopy, energy dispersive X-ray analysis and X-ray diffraction analysis. The Ni-B coating in general exhibits a nodular structure and turns crystalline with heat treatment. The corroded surface exhibits cracks and black spots which imply the occurrence of localized corrosion. Keywords: Electroless coatings, Ni-B, Corrosion, Grey Taguchi. 1. INTRODUCTION Electroless nickel coatings have received wide acceptance by the industrialists as well as the research community due to their ability to provide hardness, wear resistance, corrosion resistance and low friction coefficient [1, 2]. Moreover, the coating could be engineered to suit the need for a particular application. The properties of electroless nickel coatings are greatly affected by the type of reducing agent present in the bath. Hypophosphite reduced (Ni-P) electroless nickel coatings have already proved their mettle as a coating for tribological based applications [3-5] and attention has shifted towards borohydride reduced (Ni-B) coatings [5-12] as the latter can provide improved properties. Electroless Ni-B coatings are widely used in aerospace and automotive industries particularly due to their high hardness and hence splendid wear resistance [1]. Ni-B coatings are found to be harder than Ni-P coatings in as deposited phase [6]. With heat treatment, the hardness of Ni-B coating is found to increase even more [6, 7]. The increase of hardness of Ni-B coating with heat treatment is generally attributed to the modification of deposit structure allowing the  1308 Suman Kalyan Das and Prasanta Sahoo Vol.10, No.14 precipitation of Ni-B phases according to the Ni-B phase diagram [8]. With hardness, comes the ability to withstand wear and tear and Ni-B acquires high wear resistance particularly after heat treatment [6, 9]. Corrosion is a deteriorating phenomenon of materials, particularly metals, which often dictates the life of a product. By careful monitoring and devising newer methods to inhibit corrosion, device life could be improved preventing loss to the society. Applying coatings has been a popular way to make metals resistant to corrosion and electroless nickel coatings have proved to be suitable coatings in this regard. Several electrochemical studies have been conducted to evaluate the corrosion behaviour of electroless nickel coatings. Previous electrochemical studies used to quantify corrosion by measuring the loss of weight suffered by a material exposed to the corrosive environment. This is one of the easiest methods of evaluating the corrosion performance without the use of any sophisticated instrumentation and using the least of the resources. But with the development of technology, and sophisticated instruments being available, more precise investigations of the corrosion behaviour of a material is now possible. Present generation studies of the corrosion behaviour of electroless nickel coating are mainly conducted through electrochemical tests viz. potentiodynamic polarization studies and electrochemical impedance spectroscopy. The resistance of the coatings towards corrosion is evaluated on the basis of the corrosion parameters obtained from these studies viz. corrosion potential, corrosion current density, charge transfer resistance, double layer capacitance, corrosion rate, etc [9-11]. Although Ni-P coatings are reported to have a better corrosion resistance than Ni-B [6, 12], the properties of Ni-B are not bad, which is reported to prevent the contact of Ni-P under layer with the electrolytic solution in Ni-P/Ni-B coating [7]. The difference in corrosion resistance between electroless Ni-P and Ni-B coatings is mainly due to the difference in their structure. It is believed that the passivation films that form on Ni-B coated surfaces are not as glassy or protective enough as those that form on high phosphorous electroless nickel coatings. The phase boundaries present in Ni-B deposits might also be responsible for causing discontinuity of the passivation film, which are the preferred sites for the initiation of corrosion process [10]. Electroless Ni-B coating is applied to increase the corrosion resistance of steel. Contreras et al [13] have studied the corrosion behaviour of Ni-B coatings applied on commercial steel in both acidic and neutral environment and found that the coating protects the steel against corroding in both the environments although being more vulnerable in acidic environment. Increase in boron content also increases the corrosion resistance of Ni-B coatings [12]. In general, it is observed that corrosion resistance of as plated electroless Ni-B deposit is higher than the heat treated deposits [6, 9, 12]. This is assigned to the fact that heat treatment promotes crystallinity, which again provides grain boundaries that become favourable sites for attack by the electrolyte. The corrosion resistance of electroless Ni–P and Ni–B deposits is found to increase with the incorporation of an additional alloying element such as Cu, Zn, W, Mo, etc. or with the incorporation of second phase particles, such as silicon nitride, ceria and titania in the metal matrix [6]. Also presence of sodium hypophosphite in Ni-B bath enhances the corrosion resistance of Ni-B by forming Ni-B-P [9]. Ni-B coating being lesser corrosion resistant than Ni-P coating, an extensive study regarding the corrosion behavior of the former has remained neglected. But Ni-B coatings are often preferred in various tribological applications due to their superior hardness and wear resistance compared to Ni-P coatings. Thus, a systematic study of the electrochemical behavior of Ni-B coatings is necessary as the coatings in various applications would definitely encounter corrosion. The present study tries to study the effect of coating parameters (bath temperature, reducing agent concentration and nickel source concentration)  Vol.10, No.14 Study of Potentiodynamic Polarization Behaviour 1309 and annealing temperature on the corrosion behavior of electroless Ni-B coatings. The corrosion behavior of the coating is evaluated with the help of potentiodynamic polarization tests. Taguchi method together with Grey relational analysis is employed to optimize the process parameters in order to identify the combination of parameters that induce the maximum corrosion resistant properties in the coating. Analysis of variance is employed to observe the level of significance of the factors and their interactions. Finally, validation of the result obtained through the analysis is done with the help of confirmation test. The surface morphology and composition of Ni-B coatings are studied with the help of scanning electron microscopy, energy dispersed X-ray analysis and X-ray diffraction analysis. 2. TAGUCHI METHOD G. Taguchi introduced the Taguchi technique [14-16] and since then it has been widely used in the engineering domain to get the desired performance characteristics by optimizing the design parameters. In Taguchi technique, three-stages such as system design, parameter design, and tolerance design are employed. System design consists of the usage of scientific and engineering information required for producing a part. Tolerance design is employed to determine and to analyze tolerances about the optimum combinations suggested by parameter design. Parameter design is used to obtain the optimum levels of process parameters for developing the quality characteristics and to determine the product parameter values depending on the optimum process parameter values. Based on orthogonal arrays, the number of experiments which may increase the time and cost can be reduced by using Taguchi technique. Taguchi uses S/N ratio in order to identify the quality characteristics applied for engineering design problems. The S/N ratio characteristics can be divided on the basis of three criteria: lower-the-better (LB), higher-the better (HB) and nominal-the best (NB). The parameter level combination that maximizes the appropriate S/N ratio is the optimal level setting. 3. GREY RELATIONAL THEORY Taguchi method is well suited for optimization of single response problems. But for multiple response problems like in the present case, grey relational analysis is needed in conjunction with Taguchi method to obtain the optimized condition. The Grey system theory was first proposed by Deng in 1989 [17]. It is similar to fuzzy technique and is an effective mathematical tool to deal with system analysis characterized by imprecise and incomplete information. The theory is based on the degree of information known. If the system information is unknown, it is called a black system; if the information is fully known, it is called a white system. And a system with information known partially is called a grey system. Deng [17] had also proposed grey relational analysis (GRA) in the grey theory that was proved to be an accurate method for multiple attribute decision making problems. The GRA method is based on the minimization of maximum distance from the ideal referential alternative. The aim of GRA is to investigate the factors that affect the system. The method is based on finding the relationships of both independent and interrelating data series. By finding the GRA mathematically, the grey relational grade (GRG) can be used to evaluate the relational level between referential series and each comparative series. Grey relational analysis begins with the calculation of the grey relational generation in which the set of experimental results are normalized in between zero and one. Then grey relational coefficients are calculated from the normalized data to represent the correlation between the desired and actual experimental data. The next step is to find the grey relational grade by averaging the grey relational coefficients. The grey relational grade is treated as the overall  1310 Suman Kalyan Das and Prasanta Sahoo Vol.10, No.14 response of the process instead of the multiple responses of corrosion potential and corrosion current. Analysis of variance (ANOVA) [18] is performed with the grey relational grade in order to find which of the parameters significantly affects the process performance. Finally the optimal levels of process parameters are selected and confirmation test is employed to verify the optimal combination of the process parameters 4. EXPERIMENTAL METHODS 4.1 Coating Procedure Blocks (20 mm × 20 mm × 8 mm) of steel (AISI 1040) are used as substrates for the deposition of electroless Ni-B coating. The blocks are carefully prepared by a sequence of machining processes viz. shaping, parting and milling. Finally, the blocks are subjected to surface grinding process so that all the substrates have nearly equal roughness (centre line average value). It is important to note here that corrosion of Ni-P coatings is found to be dependent on the smoothness of the coating [19] which again depend on the smoothness of the substrate. Such behaviour is also suspected in case of Ni-B coatings [13] and hence to remove the effect of substrate roughness on the final response, all the substrates need to be of similar roughness. Before coating the substrates are cleaned of any foreign particles and corrosion products. Then the samples are cleaned with distilled water. The specimens after thorough cleaning are given a pickling treatment with dilute (18 %) hydrochloric acid for one minute to remove any surface layer formed like rust and other oxides. Finally, they are cleaned with distilled water prior to coating. A large number of trial experiments were performed before deciding on the bath composition with the ranges of the coating parameters. Three most important parameters are varied and others are kept constant for coating deposition. The bath for electroless Ni–B coatings has been prepared by mixing nickel chloride (NiCl 2 ), sodium borohydride (NaBH 4 ), ethylenediamine (C 2 H 8 N 2 ), sodium hydroxide (NaOH), lead nitrate (Pb(NO 3 ) 2 ) and distilled water in appropriate sequence (Table 1). The pH of the bath was maintained around 12.5 by adding required quantity of sodium hydroxide. The cleaned substrates are at first activated in palladium chloride solution maintained at temperature of 55°C and then placed in the electroless bath for a deposition time of two hours. The coating thickness is found to lie around 30 microns as evident from the micrograph of the cross section of the coating (Fig. 1). After deposition, the coated samples are taken out of the bath and cleaned using distilled water. Then the samples are subjected to annealing at various temperatures (250°C, 350°C, 450°C) according to the OA, in a box furnace. After annealing, the samples are allowed to cool down to the room temperature naturally. Table 1: Bath constituents and deposition conditions Parameters Ranges of parameters Nickel chloride 15 – 25 g/l Sodium borohydride 0.6 – 1.0 g/l Ethylenediamine 59 g/l Lead nitrate 0.0145 g/l Sodium hydroxide 40 g/l Bath temperature 85 – 95°C  Vol.10, No.14 Study of Potentiodynamic Polarization Behaviour 1311 Figure 1: Micrograph of the cross cut Ni-B coating 4.2 Design Factors The characteristics of electroless nickel coatings are dependent on several factors that include bath composition as well as the deposition conditions. But a thorough review of the existing literatures revealed that bath temperature (A), reducing agent concentration (B) and nickel source concentration (C) are the popular coating parameters used by the researchers to control the properties of electroless nickel coatings. Hence, these three factors are considered as the design parameters along with their interactions in the present study. Moreover, the effect of heat treatment on the corrosion resistance properties of electroless Ni-B coatings has remained a debatable issue. Thus, annealing temperature (D) is included as the fourth design parameter in the study in order to observe its effect on the electrochemical properties of Ni-B coating. The design factors along with their levels are shown in Table 2. Consideration of three levels enables the study of nonlinear effects present if any. Table 2: Design parameters and their levels Levels Design Factors Unit 1 2 3 Bath Temperature (A) ºC 85 90 a 95 Reducer concentration (B) (g/l) 0.6 0.8 a 1.0 Nickel source concentration (C) (g/l) 15 20 a 25 Annealing temperature (D) ºC 250 350 a 450 a: initial condition 4.3 Response Variables The present study attempts to assess the potentiodynamic polarization characteristics of electroless Ni-B coating. Hence, the two popular attributes obtained from the Tafel extrapolation method of the polarization curve, i.e. corrosion potential (E corr ) and corrosion current density (I corr ) are taken as the response variables for the current study. A nobler  1312 Suman Kalyan Das and Prasanta Sahoo Vol.10, No.14 (positive) E corr value and a lower I corr value indicate that a particular material has higher corrosion resistance. 4.4 Design of Experiments An experiment is a process that results in the collection of data. Usually, statistical experiments are conducted in which researchers can manipulate the conditions of the experiment and can control the factors that are irrelevant to the research objectives. Planning an experiment properly is very important in order to ensure that the right type of data and a sufficient sample size and power are available to answer the research questions of interest as clearly and efficiently as possible. As mentioned earlier, Taguchi method uses an OA (orthogonal array) to reduce the number of experiments for determining the optimal process parameters. Orthogonal arrays allow one to compute the main and interaction effects via a minimum number of experimental trials [15]. The choice of a suitable OA depends on the number of design factors and their interactions considered. In the present case, an L 27 OA which has 27 rows corresponding to the number of tests and 26 degrees of freedom (DOFs) with 13 columns at three levels is chosen. The factors and their interactions are assigned to the columns of the array according to the Triangular Table for 3-level OA [16]. The OA together with the column assignments are shown in Table 3. Values in each cell of the main parameter columns (A, B, C and D) in the array indicate their levels (1, 2 and 3). Again in case of interactions, two columns are assigned to a single interaction and the two cell values in a particular row indicate the levels of each of the factors involved in the interaction. The unassigned columns in the OA are kept for the errors terms. 4.5 Potentiodynamic Tests The potentiodynamic polarization tests are performed with a potentiostat (Gill AC) of ACM Instruments, UK. A 3.5% sodium chloride solution is taken as the electrolyte and the tests are conducted at an ambient temperature of about 25°C. The electrochemical cell consists of three electrodes. The coated specimen forms the working electrode which is actually the sample being interrogated. A saturated calomel electrode (SCE) forms the reference electrode which provides a stable “reference” against which the applied potential may be accurately measured. A platinum electrode serves as the counter electrode which provides the path for the applied current into the solution. The design of the cell is such that only an area of 1 cm 2 of the coated surface is exposed to the electrolyte. A settling time of 15 min is assigned before every experiment in order to stabilize the open circuit potential (OCP). The potentiostat is controlled via a PC which also captures the polarization data. The polarization plot is obtained from the dedicated software, which also possesses a special tool in order to manually extrapolate the values of E corr (corrosion potential) and I corr (corrosion current density) from the plot. As a fully developed linear portion was difficult to find, for an accurate extrapolation, two thumb rules [20] are followed: a) One of the branches of the polarization curve should exhibit Tafel (i.e. linear on semi- logarithmic scale) over at least one decade of current density . b) The extrapolation should start at least 50-100 mV away from E corr .  Vol.10, No.14 Study of Potentiodynamic Polarization Behaviour 1313 4.6 Microstructure Characterization Microstructure characterization becomes indispensable in a study involving corrosion which largely depends on the microstructure of the material. Scanning electron microscopy (JEOL, JSM-6360 and FEI, Quanta 200) is used to observe the surface morphology of the coating before and after heat treatment. This is done in order to analyze the effect of heat treatment on the Ni-B coatings. Energy dispersive X-ray analysis (EDAX Corporation) is made use of in order to determine the composition of the coating in terms of the weight percentages of nickel and boron. It has been demonstrated by previous studies [21] that the physical properties of the deposited film are greatly influenced by the concentration of boron in the film. This concentration in turn depends upon the amount of reducing agent added. Hence EDX analysis is done on the coatings developed from the bath consisting of different concentrations of sodium borohydride (reducing agent) in order to capture the range of boron content in the coatings. The different precipitated phases before and after heat treatment are detected by using X-ray diffraction analyzer (Rigaku, Ultima III). Table 3: L 27 Orthogonal Array with design factors and interactions Column numbers Trial No. 1 A 2 B 3 A×B 4 A×B 5 C 6 A×C 7 A×C 8 B×C 9 D 10 - 11 B×C 12 - 13 - 1 1 1 1 1 1 1 1 1 1 1 1 1 1 2 1 1 1 1 2 2 2 2 2 2 2 2 2 3 1 1 1 1 3 3 3 3 3 3 3 3 3 4 1 2 2 2 1 1 1 2 2 2 3 3 3 5 1 2 2 2 2 2 2 3 3 3 1 1 1 6 1 2 2 2 3 3 3 1 1 1 2 2 2 7 1 3 3 3 1 1 1 3 3 3 2 2 2 8 1 3 3 3 2 2 2 1 1 1 3 3 3 9 1 3 3 3 3 3 3 2 2 2 1 1 1 10 2 1 2 3 1 2 3 1 2 3 1 2 3 11 2 1 2 3 2 3 1 2 3 1 2 3 1 12 2 1 2 3 3 1 2 3 1 2 3 1 2 13 2 2 3 1 1 2 3 2 3 1 3 1 2 14 2 2 3 1 2 3 1 3 1 2 1 2 3 15 2 2 3 1 3 1 2 1 2 3 2 3 1 16 2 3 1 2 1 2 3 3 1 2 2 3 1 17 2 3 1 2 2 3 1 1 2 3 3 1 2 18 2 3 1 2 3 1 2 2 3 1 1 2 3 19 3 1 3 2 1 3 2 1 3 2 1 3 2 20 3 1 3 2 2 1 3 2 1 3 2 1 3 21 3 1 3 2 3 2 1 3 2 1 3 2 1 22 3 2 1 3 1 3 2 2 1 3 3 2 1 23 3 2 1 3 2 1 3 3 2 1 1 3 2 24 3 2 1 3 3 2 1 1 3 2 2 1 3 25 3 3 2 1 1 3 2 3 2 1 2 1 3 26 3 3 2 1 2 1 3 1 3 2 3 2 1 27 3 3 2 1 3 2 1 2 1 3 1 3 2  1314 Suman Kalyan Das and Prasanta Sahoo Vol.10, No.14 5. RESULTS AND DISCUSSION 5.1 Grey Analysis The responses (E corr and I corr ) obtained from the potentiodynamic tests are given in Table 4. For conversion of the multiple responses into a single response (grey relational grade) to be handled by Taguchi technique requires the following set of calculations: 5.1.1 Grey relational generation Grey relational generation involves the linear normalization of the experimental results (E corr and I corr ) in the range between 0 and 1. The normalization can be done based on three objectives which include (1) normalization by maximum value (lower-the-better), (2) normalization by minimum value (higher-the-better) and (3) normalization by objective value. The objective of the present study is to maximize the corrosion resistance of Ni-B coatings. Now, from Table 4, it is seen that E corr is always negative. As a nobler E corr value indicates that the material will have lesser tendency to corrode, the normalization is carried out for E corr with higher-the-better criterion. Moreover, since a lower value of corrosion current density indicates higher corrosion resistance, the normalization for I corr is carried out with lower-the-better criterion. The normalization expressions for both are given as follows: ( ) )(min)(max )(min)( kyky kyky kx ii ii i − − = ; (higher-the-better) (1) ( ) )(min)(max )()(max kyky kyky kx ii ii i − − = ; (lower-the better) (2) where ( ) kx i is the value after grey relational generation while )(min ky i and )(max ky i are respectively the smallest and largest values of )(ky i for the kth response; k being 1 (E corr ) and 2 (I corr ). The processed data after grey relational generation is given in Table 5. Larger normalized results correspond to the better performance and the best normalized result should be equal to 1. 5.1.2 Grey relational coefficient Grey relational coefficients are calculated to express the relationship between the ideal (best = 1) and the actual experimental results. The Grey relational coefficient ( ) k i ξ can be calculated as: ( )( ) max0 maxmin ∆∆ ∆ ∆ ξ rk r k i i + + = (3) where = i0 ∆ || ( ) ( ) kxkx i − 0 || = difference of the absolute value between ( ) kx 0 and ( ) kx i , min ∆ and max ∆ are respectively the minimum and maximum values of the absolute differences ( i0 ∆ ) of all comparing sequences and r is the distinguishing coefficient which is used to adjust the difference of the relational coefficient, usually r ∈ [0,1] [17]. The  Vol.10, No.14 Study of Potentiodynamic Polarization Behaviour 1315 distinguishing coefficient weakens the effect of max ∆ when it gets too big, enlarging the different significance of the relational coefficient. The suggested value of the distinguishing coefficient, r, is 0.5, due to the moderate distinguishing effects and good stability of outcomes. Therefore, r is adopted as 0.5 for further analysis in the present case. The values of i0 ∆ and grey relational coefficients (with Ψ =0.5) are given in Table 5. Table 4: Experimental results for corrosion potential and corrosion current density Sl. No. E corr (mV vs. SCE) I corr (µA/cm 2 ) Sl. No. E corr (mV vs. SCE) I corr (µA/cm 2 ) 1 -457.73 4.76 15 -340.54 1.08 2 -640.37 5.93 16 -319.15 3.06 3 -463.75 4.04 17 -309.87 1.60 4 -364.37 4.16 18 -315.07 1.01 5 -325.52 2.29 19 -331.66 1.36 6 -346.23 5.01 20 -342.32 1.53 7 -426.65 8.62 21 -303.64 2.33 8 -397.82 2.87 22 -328.41 1.56 9 -350.64 1.92 23 -306.05 0.64 10 -311.20 1.13 24 -275.31 0.11 11 -219.73 0.19 25 -377.45 1.79 12 -329.33 0.84 26 -290.71 0.89 13 -364.83 3.40 27 -348.52 0.76 14 -351.00 1.78 5.1.3 Generation of Grey relational grade In the grey relational analysis, the grey relational grade is used to show the relationship among the series. The overall multiple response characteristics evaluation is based on grey relational grade which is calculated as follows: ( ) ∑ = = n k ii k n 1 1 ξα (4) where n = number of performance characteristics (2 in present case). The results of grey relational grade are given in Table 6. Higher the grey relational grade, the closer is the experimental value to the ideal normalized value. Thus, higher grey relational grade indicates that the corresponding parameter combination is closer to the optimal. 5.1.4 Grey relational ordering In relational analysis, the practical meaning of the numerical values of grey relational grades between elements is not absolutely important, while the grey relational ordering between them yields more subtle information. The combination yielding the highest grey relational grade is assigned an order of 1 while the combination yielding the minimum grade is assigned the lowest order. The ordering of the present grey grades is shown in Table 6.  1316 Suman Kalyan Das and Prasanta Sahoo Vol.10, No.14 5.2 Analysis of Signal to Noise Ratio Taguchi method uses S/N ratio to convert the experimental results into a value for the evaluation characteristic in the optimum parameter analysis. In the present work, S/N ratio analysis is done with grey relational grade as the performance index. As grey relational grade is to be maximized, the S/N ratio is calculated using higher the better criterion and is given by: S/N = − ∑ 2 y 1 n 1 log10 (5) Table 5: Grey relational analyses for corrosion potential and corrosion current density Normalized data Values of ∆ 0i Grey relational coefficient Exp. No. E corr I corr E corr I corr E corr I corr 1 0.434196 0.453584 0.565804 0.546416 0.469129 0.477821 2 0 0.316099 1 0.683901 0.333333 0.422333 3 0.419884 0.53819 0.580116 0.46181 0.462913 0.519853 4 0.656143 0.524089 0.343857 0.475911 0.592517 0.512342 5 0.748502 0.743831 0.251498 0.256169 0.665338 0.661228 6 0.699268 0.424207 0.300732 0.575793 0.624428 0.464773 7 0.508083 0 0.491917 1 0.504074 0.333333 8 0.576621 0.675676 0.423379 0.324324 0.54149 0.606557 9 0.688784 0.787309 0.311216 0.212691 0.616358 0.701566 10 0.782546 0.880141 0.217454 0.119859 0.696908 0.806635 11 1 0.990599 0 0.009401 1 0.981546 12 0.739445 0.914219 0.260555 0.085781 0.657414 0.853561 13 0.655049 0.613396 0.344951 0.386604 0.591751 0.56395 14 0.687928 0.80376 0.312072 0.19624 0.615709 0.718143 15 0.712795 0.886016 0.287205 0.113984 0.635158 0.814354 16 0.763646 0.653349 0.236354 0.346651 0.679021 0.590562 17 0.785707 0.824912 0.214293 0.175088 0.699993 0.740644 18 0.773345 0.894242 0.226655 0.105758 0.688085 0.825412 19 0.733905 0.853114 0.266095 0.146886 0.652661 0.772934 20 0.708563 0.833137 0.291437 0.166863 0.631762 0.74978 21 0.800518 0.73913 0.199482 0.26087 0.714815 0.657143 22 0.741632 0.829612 0.258368 0.170388 0.65931 0.745837 23 0.794789 0.93772 0.205211 0.06228 0.709008 0.889237 24 0.867868 1 0.132132 0 0.790974 1 25 0.625048 0.802585 0.374952 0.197415 0.57146 0.716933 26 0.831257 0.908343 0.168743 0.091657 0.747672 0.845084 27 0.693824 0.923619 0.306176 0.076381 0.620212 0.867482 where y is the observed data and n is the number of observations. The S/N ratio is preferred to the traditional means as the former can capture variability within a trial condition. As the experimental design is orthogonal, the separation of each coating parameters at different levels is possible. For example, the mean of grey relational grade for factor A at levels 1, 2 and 3 can be calculated by taking the average of the grey relational grade for the experiments  Vol.10, No.14 Study of Potentiodynamic Polarization Behaviour 1317 1–9, 10–18 and 19–27, respectively. The mean of the grey relational grade for each level of other coating parameters can be computed in the similar manner. The mean of the relational grade for each level of the combining parameters is summarized in the multi-response performance index table (Table 7). In addition, the total mean of the grey relational grade of the twenty seven experiments is also calculated, as shown in Table 7. The response table also contains ranks based on the delta values. The delta value is calculated by subtracting the largest value from the lowest from among the values in each column. Basically, a design factor with a large difference in the grey relational grade from one factor setting to another indicates that the factor or design parameter is a significant contributor to the achievement of the performance characteristic. From the response table it is found that parameter A is the most significant factor in controlling the polarization characteristics of Ni-B coatings. Table 6: Grey relational grade and its order Exp. No. Grey relational grade Order Exp. No. Grey relational Order 1 0.4734 25 15 0.7247 9 2 0.3778 27 16 0.6347 19 3 0.4913 24 17 0.7203 10 4 0.5524 22 18 0.7567 5 5 0.6632 16 19 0.7127 11 6 0.5446 23 20 0.6907 13 7 0.4187 26 21 0.6859 14 8 0.5740 21 22 0.7025 12 9 0.6589 17 23 0.7991 3 10 0.7517 7 24 0.8954 2 11 0.9907 1 25 0.6441 18 12 0.7554 6 26 0.7963 4 13 0.5778 20 27 0.7438 8 14 0.6669 15 Table 7: Mean table for Grey relational grade Level A B C D 1 0.5283 0.6589 0.6076 0.6429 2 0.7310 0.6808 0.6977 0.6573 3 0.7412 0.6609 0.6953 0.7004 Delta 0.2129 0.0219 0.0901 0.0574 Rank 1 4 2 3 Total mean grey relational grade = 0.6668 Fig. 2 shows the main effect plot of grey relational grade. The main effect plot gives the optimal combination of coating parameters for maximum corrosion resistance. As the larger the grey relation grade is, the closer will be the product quality to the ideal value. Hence, the optimal combination of parameters is found to be A3B2C3D3. The main effects plot also gives a rough idea about the relative significance of the parameters on the system response. If the plot for a particular parameter has the highest inclination, then that parameter has the most significance. Whereas the plot which is near horizontal has no significance. From Fig. 2, it can be observed that parameter A has the most significance while parameter C is also quite  1318 Suman Kalyan Das and Prasanta Sahoo Vol.10, No.14 significant. In the interaction effect plots (Fig. 3), the non-parallelism of the plots indicates that some amount of significance exists between the two factors, whereas intersecting lines are an indication of strong interaction. From Fig. 3, it can be seen that lines intersect in all the plots. Hence, quite strong interaction is believed to be existent among all the factors as far as the potentiodynamic polarization characteristics of electroless Ni-B coatings are concerned. It may be noted that quality of Ni-B deposits are very much dependent on the ratio of concentrations of nickel and borohydride ions in the bath. An improper balance between the concentrations of nickel and borohydride can lead to poor and rough deposits [1]. The optimal levels of nickel source (C3) and reducing agent (B2) obtained from the present study may be helping in striking a proper balance between the two (nickel and borohydride ions) for achieving smoother deposits which may be aiding to the corrosion resistance of the coating. Moreover, bath temperature increases the deposition rate by accelerating the reaction mechanism. Thus, the surface morphology of the coating is very much dependent on the bath temperature, which controls the growth of the coating. Now, the present optimal level (A3) of bath temperature may actually be helping in attaining such a morphology which is suitable for resistant against corrosion. Figure 2: Main effects plot for mean S/N ratio 5.3 Analysis of Variance The analysis of variance (ANOVA) is employed in order to have a quantified idea about the effect of the design parameters (A, B, C, D) and their interactions (A×B, A×C, B×C) on the polarization characteristics of electroless Ni-B coating. The Taguchi experimental method could not judge the effect of individual parameters on the entire process, thus the percentage of contribution using ANOVA is used to compensate for this effect. ANOVA results for overall grey relational grade of friction and wear response is obtained through Minitab [22] and shown in Table 8. The ANOVA table also consists of F-values. By comparing the evaluated F values with the tabulated ones, the significance of the factors and their interactions can be readily understood. If the obtained F-value of a parameter or interaction is greater than the tabulated one, then that particular parameter or interaction has a significant influence over the process response. From Table 8, it can be observed that parameter A, i.e. bath temperature has the most significant influence over the polarization characteristics at the confidence level of 99% while parameter C (concentration of nickel source) is significant only at a confidence level of 75%. In case of interactions, it is found that only the interaction A×B is significant and at a confidence level of 90%.  Vol.10, No.14 Study of Potentiodynamic Polarization Behaviour 1319 (a) (b) (c) Figure 3: Interaction effects plot for mean grade (a) A vs B, (b) A vs C and (c) B vs C  1320 Suman Kalyan Das and Prasanta Sahoo Vol.10, No.14 Table 8: ANOVA table Source DOF SS MS F % contribution A 2 0.259661 0.129831 17.92 b 52.93 B 2 0.002633 0.001316 0.18 0.54 C 2 0.047405 0.023703 3.27 d 9.66 D 2 0.016088 0.008044 1.11 3.28 A×B 4 0.095066 0.023767 3.28 c 19.37 A×C 4 0.006696 0.001674 0.23 1.36 B×C 4 0.019558 0.004889 0.67 3.98 Error 6 0.043463 0.007244 Total 26 0.490571 b Significant at 99% confidence level (F 0.01,2,6 = 10.9) c Significant at 90% confidence level (F 0.10,4,6 = 3.18) d Significant at 75% confidence level (F 0.25,2,6 = 1.76) 5.4 Confirmation Test Once the optimal level combination of the design parameters have been found out, the final step is to verify if any improvement in the results actually occurs at the optimal condition compared to the initial condition. Also, an estimated grey relational grade ( γ ˆ ) is calculated at the optimal condition with the help of the following expression: ( ) ∑ = −+= o i m i m 1 ˆ γγγγ (6) Table 9: Results of confirmation test Optimal parameter Initial parameter Prediction Experimental Level A2B2C2D2 A3B2C3D3 A3B2C3D3 E corr (mV vs. SCE) -381.55 -275.31 I corr (µA/cm 2 ) 5.04 0.11 Grade 0.5142 0.7696 0.8954 Improvement of grey relational grade = 0.3812 where m γ is the total mean grey relational grade, i γ is the mean grey relational grade at the optimal level, and o is the number of the main design parameters that significantly affect the polarization characteristics of electroless Ni-B coating. The comparison of the predicted grey relational grade, experimental grey relational grade and the grey relational grade at the initial condition is shown in Table 9. The mid-level combination of coating parameters is assumed as the initial condition. From the table, it is found that the improvement of grey relational grade at the optimal condition is 0.3812 which is about 57% of the mean grey relational grade. This is considered to be a significant improvement. The polarization curves for the coatings developed at initial condition and at optimal condition are shown in Fig. 4. As  Vol.10, No.14 Study of Potentiodynamic Polarization Behaviour 1321 expected, the polarization curves showed that Ni-B coatings do not exhibit any passive behaviour. Figure 4: Polarization curves for coatings developed at (1) Initial condition, (2) Optimal condition 5.5 Study of Microstructure The chemical composition of electroless coatings are analysed using one of the latest EDX detectors without any Beryllium window, enabling the detection of light elements like boron with considerable accuracy. The beryllium window if present absorbs all the soft X-rays emanating from the lighter elements thereby preventing their detection. The EDX plots are shown in Fig. 5 and boron content in terms of weight percentages is found to be in the range of 5.72 - 7.46 while the remaining is mostly nickel. The SEM micrographs of the coating surfaces in as-deposited and heat treated (at 250°C, 350°C and 450°C for one hour) conditions are shown in Fig. 6. The surface exhibits a cauliflower like structure which strongly points towards the coating possessing a lubricious behavior [8]. Surface of the Ni-B coatings appears to be dense and matte grey in colour with low porosity. Also by careful observation, it can be noted that the Ni-B nodules are quite deflated and flat in as deposited condition but gradually grow in size with increase in heat treatment temperature giving rise to coarse grained structure. The XRD analysis (Fig. 7) shows that the Ni-B film is almost amorphous in as-deposited phase but turns crystalline with heat treatment. This is evident from the presence of microcrystalline peaks in as-deposited phase whereas broad peaks of Ni, Ni 2 B and Ni 3 B are found in samples heat treated at 450°C.  1322 Suman Kalyan Das and Prasanta Sahoo Vol.10, No.14 (a) (b) Figure 5: EDX plots of Ni-B coatings (a) 0.6 g/l NaBH 4 , (b) 1.0 g/l NaBH 4 5.6 Corrosion Mechanism Electroless Ni-B deposits demonstrate a moderate corrosion resistance in 3.5% sodium chloride solution. Some of the corroded samples are observed under SEM in order to get a rough idea about the corrosion process (Fig. 8). The effect of heat treatment on corrosion is attempted to capture by observing samples annealed at different temperatures (250, 350 and 450 ºC). A quick view of the pictures reveals that the samples are quite affected by the corrosion in saline environment. In almost every sample, localized cracks are found to be  Vol.10, No.14 Study of Potentiodynamic Polarization Behaviour 1323 (a) (b) (c) (d) Figure 6: SEM micrographs of the coating surfaces: (a) as-deposited, (b) annealed at 250ºC (c) annealed at 350ºC and (d) annealed at 450ºC. present which may be indicative of preferential dissolution at the boundaries of adjacent grains and columns (23). Also black spots can be observed which are more prominent for samples annealed at 250ºC (Fig. 8a) and 450ºC (Fig. 8c). These spots imply the occurrence of localized corrosion on the coating surface due to the presence of chloride ions in the solution. But since the coating does not display any passive behavior in the polarization curve, the probability of pitting is quite less. Crobu et al [24] have observed a similar occurrence and attributed the phenomenon to galvanic coupling due to composition heterogeneities in the coating. The heterogeneity may be due to the inhomogeneous distribution of boron throughout the coating providing areas of different corrosion potential on the surface, which would have lead to the formation of minute active/passive corrosion cells. 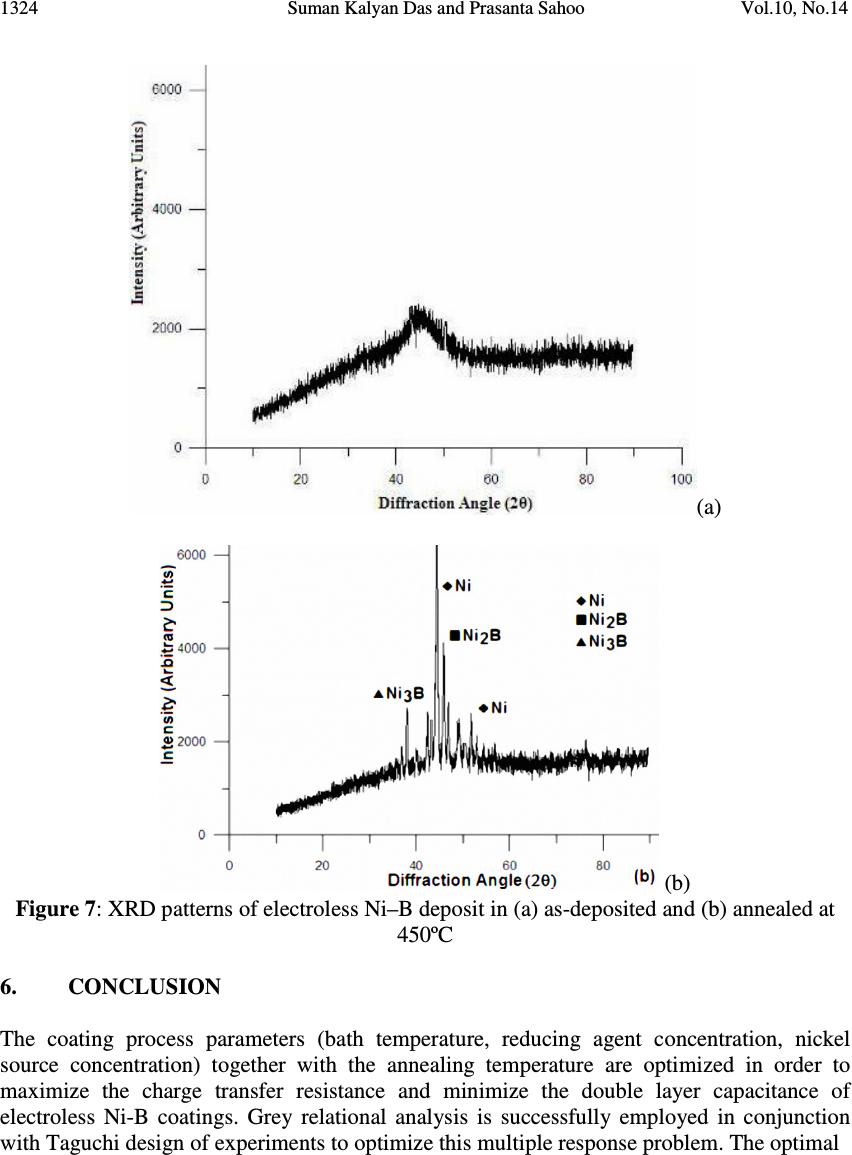 1324 Suman Kalyan Das and Prasanta Sahoo Vol.10, No.14 (a) (b) Figure 7: XRD patterns of electroless Ni–B deposit in (a) as-deposited and (b) annealed at 450ºC 6. CONCLUSION The coating process parameters (bath temperature, reducing agent concentration, nickel source concentration) together with the annealing temperature are optimized in order to maximize the charge transfer resistance and minimize the double layer capacitance of electroless Ni-B coatings. Grey relational analysis is successfully employed in conjunction with Taguchi design of experiments to optimize this multiple response problem. The optimal 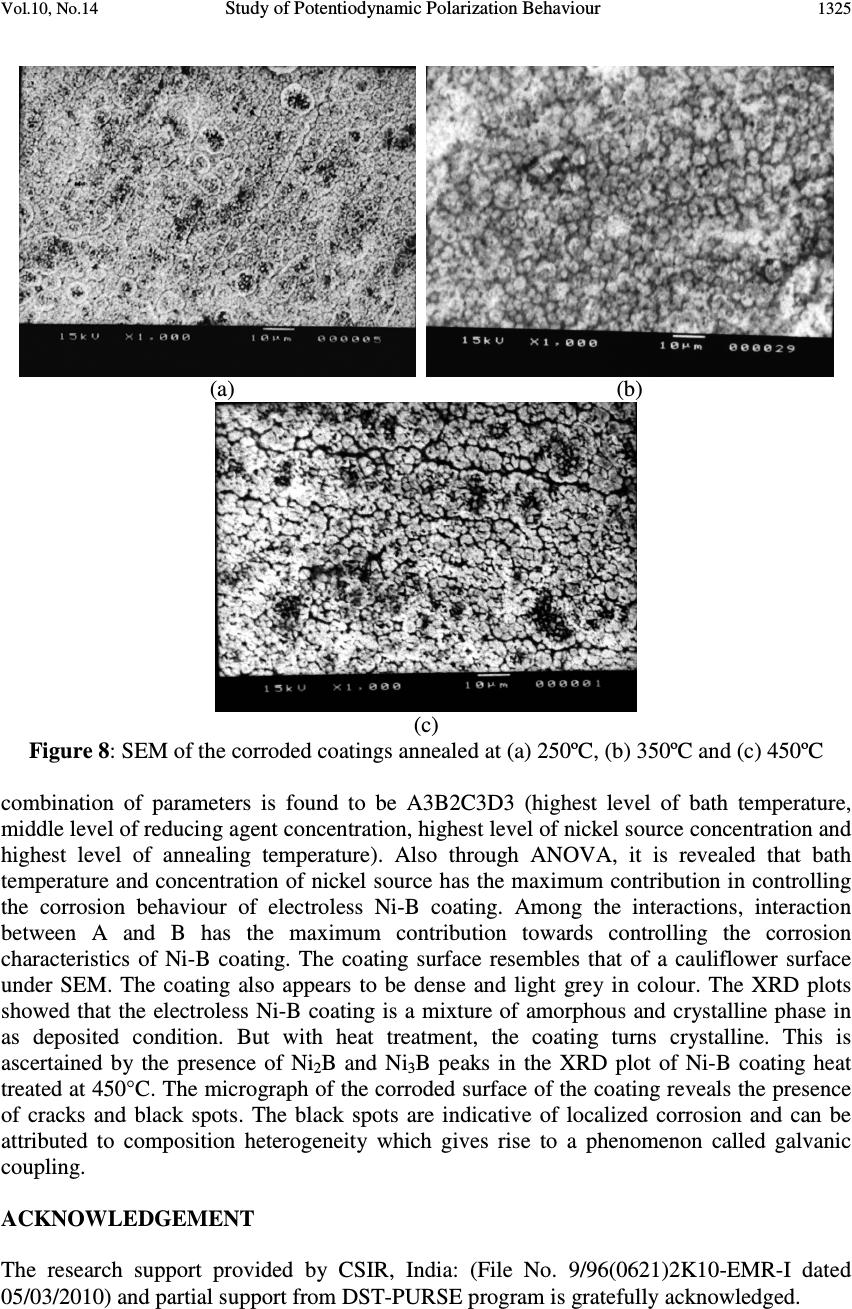 Vol.10, No.14 Study of Potentiodynamic Polarization Behaviour 1325 (a) (b) (c) Figure 8: SEM of the corroded coatings annealed at (a) 250ºC, (b) 350ºC and (c) 450ºC combination of parameters is found to be A3B2C3D3 (highest level of bath temperature, middle level of reducing agent concentration, highest level of nickel source concentration and highest level of annealing temperature). Also through ANOVA, it is revealed that bath temperature and concentration of nickel source has the maximum contribution in controlling the corrosion behaviour of electroless Ni-B coating. Among the interactions, interaction between A and B has the maximum contribution towards controlling the corrosion characteristics of Ni-B coating. The coating surface resembles that of a cauliflower surface under SEM. The coating also appears to be dense and light grey in colour. The XRD plots showed that the electroless Ni-B coating is a mixture of amorphous and crystalline phase in as deposited condition. But with heat treatment, the coating turns crystalline. This is ascertained by the presence of Ni 2 B and Ni 3 B peaks in the XRD plot of Ni-B coating heat treated at 450°C. The micrograph of the corroded surface of the coating reveals the presence of cracks and black spots. The black spots are indicative of localized corrosion and can be attributed to composition heterogeneity which gives rise to a phenomenon called galvanic coupling. ACKNOWLEDGEMENT The research support provided by CSIR, India: (File No. 9/96(0621)2K10-EMR-I dated 05/03/2010) and partial support from DST-PURSE program is gratefully acknowledged. 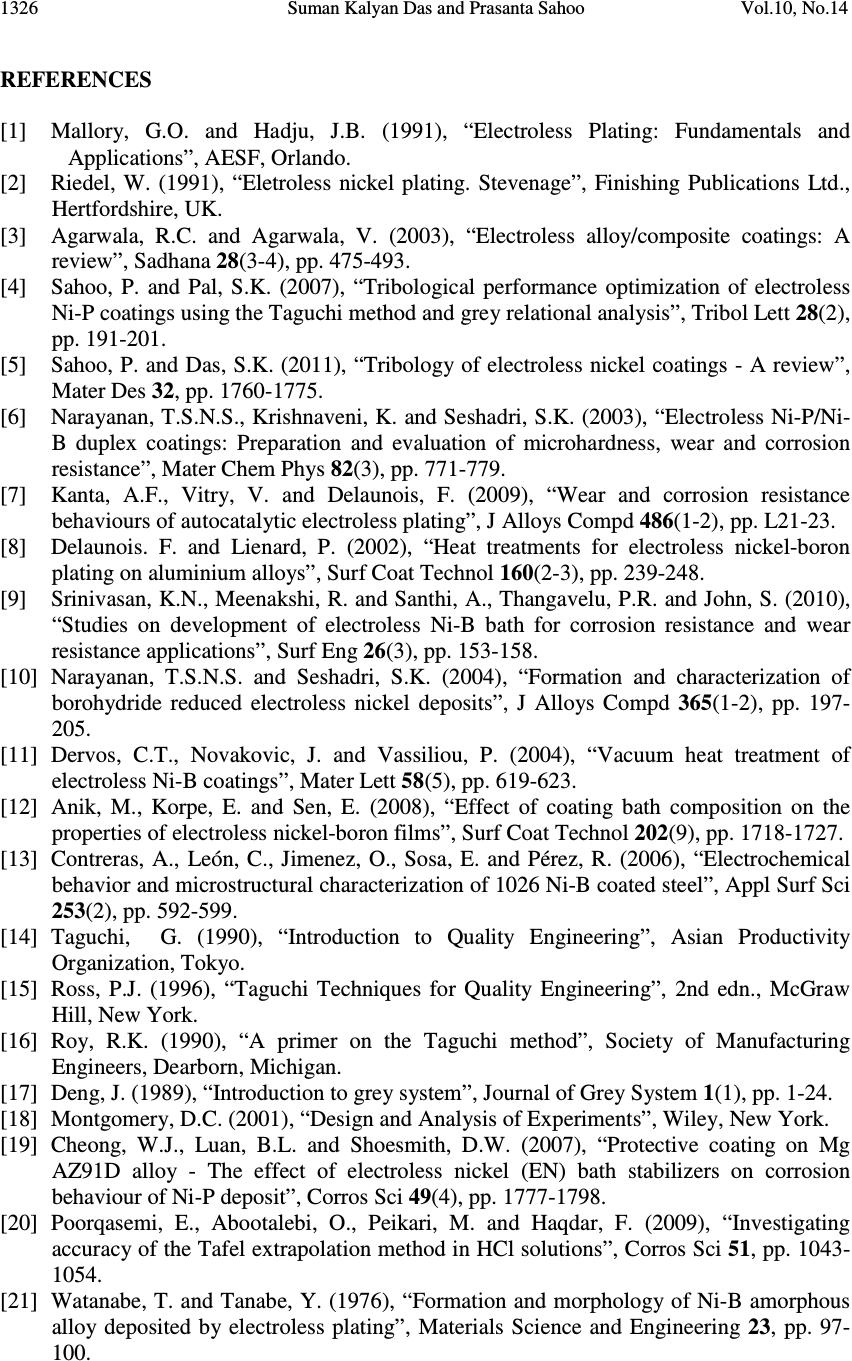 1326 Suman Kalyan Das and Prasanta Sahoo Vol.10, No.14 REFERENCES [1] Mallory, G.O. and Hadju, J.B. (1991), “Electroless Plating: Fundamentals and Applications”, AESF, Orlando. [2] Riedel, W. (1991), “Eletroless nickel plating. Stevenage”, Finishing Publications Ltd., Hertfordshire, UK. [3] Agarwala, R.C. and Agarwala, V. (2003), “Electroless alloy/composite coatings: A review”, Sadhana 28(3-4), pp. 475-493. [4] Sahoo, P. and Pal, S.K. (2007), “Tribological performance optimization of electroless Ni-P coatings using the Taguchi method and grey relational analysis”, Tribol Lett 28(2), pp. 191-201. [5] Sahoo, P. and Das, S.K. (2011), “Tribology of electroless nickel coatings - A review”, Mater Des 32, pp. 1760-1775. [6] Narayanan, T.S.N.S., Krishnaveni, K. and Seshadri, S.K. (2003), “Electroless Ni-P/Ni- B duplex coatings: Preparation and evaluation of microhardness, wear and corrosion resistance”, Mater Chem Phys 82(3), pp. 771-779. [7] Kanta, A.F., Vitry, V. and Delaunois, F. (2009), “Wear and corrosion resistance behaviours of autocatalytic electroless plating”, J Alloys Compd 486(1-2), pp. L21-23. [8] Delaunois. F. and Lienard, P. (2002), “Heat treatments for electroless nickel-boron plating on aluminium alloys”, Surf Coat Technol 160(2-3), pp. 239-248. [9] Srinivasan, K.N., Meenakshi, R. and Santhi, A., Thangavelu, P.R. and John, S. (2010), “Studies on development of electroless Ni-B bath for corrosion resistance and wear resistance applications”, Surf Eng 26(3), pp. 153-158. [10] Narayanan, T.S.N.S. and Seshadri, S.K. (2004), “Formation and characterization of borohydride reduced electroless nickel deposits”, J Alloys Compd 365(1-2), pp. 197- 205. [11] Dervos, C.T., Novakovic, J. and Vassiliou, P. (2004), “Vacuum heat treatment of electroless Ni-B coatings”, Mater Lett 58(5), pp. 619-623. [12] Anik, M., Korpe, E. and Sen, E. (2008), “Effect of coating bath composition on the properties of electroless nickel-boron films”, Surf Coat Technol 202(9), pp. 1718-1727. [13] Contreras, A., León, C., Jimenez, O., Sosa, E. and Pérez, R. (2006), “Electrochemical behavior and microstructural characterization of 1026 Ni-B coated steel”, Appl Surf Sci 253(2), pp. 592-599. [14] Taguchi, G. (1990), “Introduction to Quality Engineering”, Asian Productivity Organization, Tokyo. [15] Ross, P.J. (1996), “Taguchi Techniques for Quality Engineering”, 2nd edn., McGraw Hill, New York. [16] Roy, R.K. (1990), “A primer on the Taguchi method”, Society of Manufacturing Engineers, Dearborn, Michigan. [17] Deng, J. (1989), “Introduction to grey system”, Journal of Grey System 1(1), pp. 1-24. [18] Montgomery, D.C. (2001), “Design and Analysis of Experiments”, Wiley, New York. [19] Cheong, W.J., Luan, B.L. and Shoesmith, D.W. (2007), “Protective coating on Mg AZ91D alloy - The effect of electroless nickel (EN) bath stabilizers on corrosion behaviour of Ni-P deposit”, Corros Sci 49(4), pp. 1777-1798. [20] Poorqasemi, E., Abootalebi, O., Peikari, M. and Haqdar, F. (2009), “Investigating accuracy of the Tafel extrapolation method in HCl solutions”, Corros Sci 51, pp. 1043- 1054. [21] Watanabe, T. and Tanabe, Y. (1976), “Formation and morphology of Ni-B amorphous alloy deposited by electroless plating”, Materials Science and Engineering 23, pp. 97- 100.  Vol.10, No.14 Study of Potentiodynamic Polarization Behaviour 1327 [22] Minitab User Manual (2001), “Making data analysis easier”, MINITAB Inc., State College, PA, USA. [23] Kanta, A.F., Poelman, M., Vitry, V. and Delaunois, F. (2010), “Nickel-boron electrochemical properties investigations”, J Alloys Compd 505, pp. 151-156. [24] Crobu, M., Scorciapino, A., Elsener, B. and Rossi, A. (2008), “The corrosion resistance of electroless deposited nano-crystalline Ni-P alloys”, Electrochim Acta 53(8), pp. 3364-3370. |