Paper Menu >>
Journal Menu >>
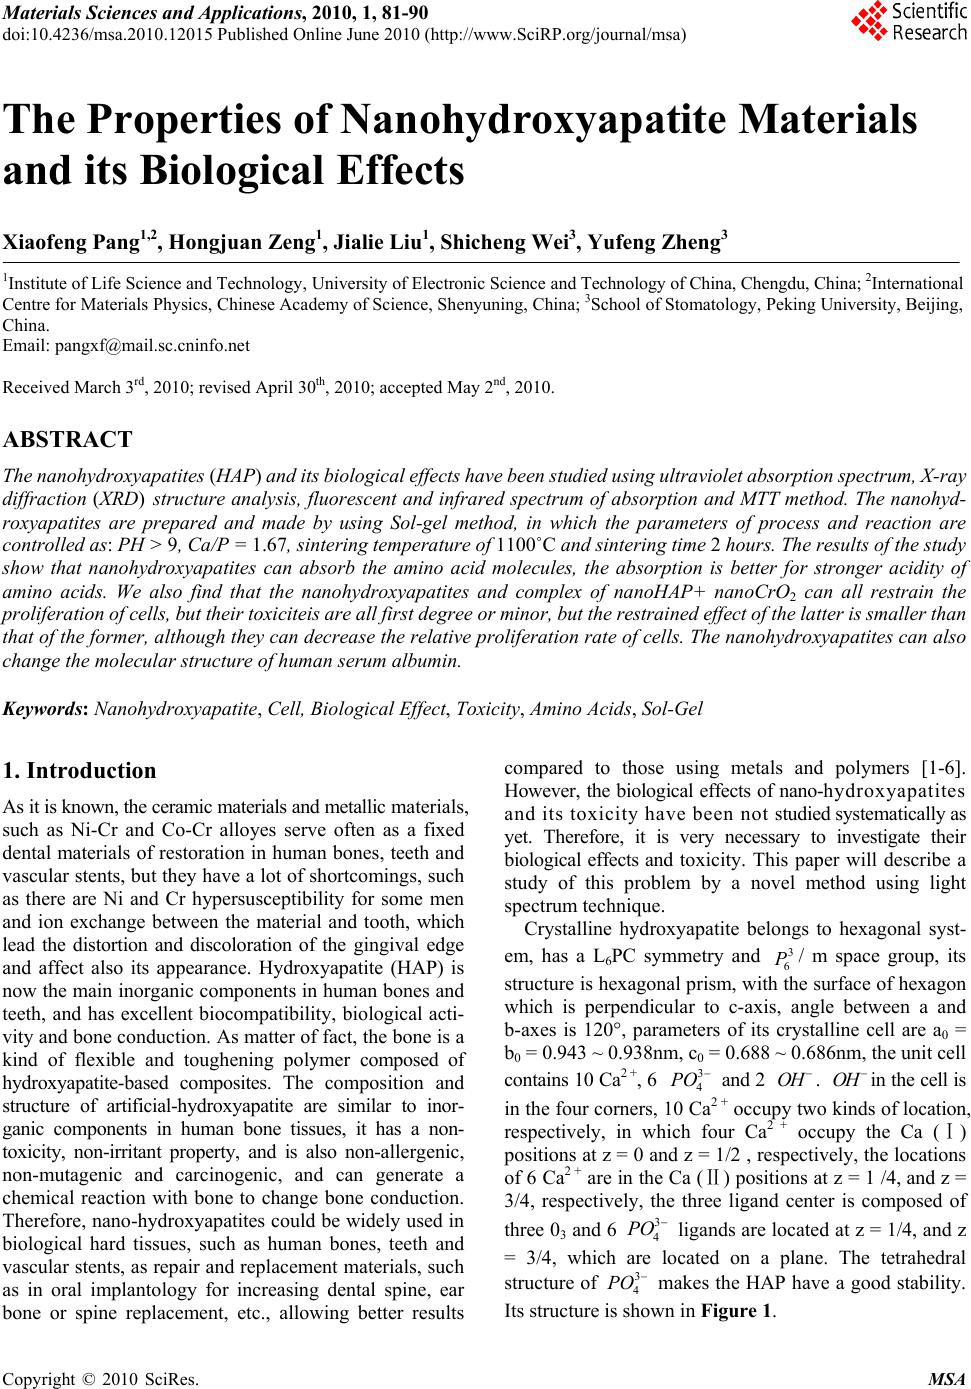 Materials Sciences and Applicatio ns, 2010, 1, 81-90 doi:10.4236/msa.2010.12015 Published Online June 2010 (http://www.SciRP.org/journal/msa) Copyright © 2010 SciRes. MSA The Properties of Nanohydroxyapatite Materials and its Biological Effects Xiaofeng Pang1,2, Hongjuan Zeng1, Jialie Liu1, Shicheng Wei3, Yufeng Zheng3 1Institute of Life Science and Technology, University of Electronic Science and Technology of China, Chengdu, China; 2International Centre for Materials Physics, Chinese Academy of Science, Shenyuning, China; 3School of Stomatology, Peking University, Beijing, China. Email: pangxf@mail.sc.cninfo.net Received March 3rd, 2010; revised April 30th, 2010; accepted May 2nd, 2010. ABSTRACT The nanohydroxyapatites (HAP) and i ts biologi cal effects have bee n studied usi ng ultravi olet absorpt ion spectrum, X-ray diffraction (XRD) structure analysis, fluorescent and infrared spectrum of absorption and MTT method. The nanohyd- roxyapatites are prepared and made by using Sol-gel method, in which the parameters of process and reaction are controll ed as : PH > 9, C a/P = 1.67, si nt ering temperature of 1100˚C and sintering time 2 hours. The re sul ts of the study show that nanohydroxyapatites can absorb the amino acid molecules, the absorption is better for stronger acidity of amino acids. We also find that the nanohydroxyapatites and complex of nanoHAP+ nanoCrO2 can all restrain the proliferation of cells, but their toxiciteis are all first degree or minor, but the restrained effect of the latter is smaller than that of the former, although they can decrease th e relative proliferation rate of cells. The nanohyd roxyapatites can also change the molecular structure of human serum albumin. Keywords: Nanohydroxyapatite, Cell, Biologica l Effect, Toxicity, Amino Acids, Sol-Gel 1. Introduction As it is known, the ceramic materials and metallic materials, such as Ni-Cr and Co-Cr alloyes serve often as a fixed dental materials of restoration in human bones, teeth and vascular stents, but they have a lot of shortcomings, such as there are Ni and Cr hypersusceptibility for some men and ion exchange between the material and tooth, which lead the distortion and discoloration of the gingival edge and affect also its appearance. Hydroxyapatite (HAP) is now the main inorganic components in human bones and teeth, and has excellent biocompatibility, biological acti- vity and bone conduction. As matter of fact, the bone is a kind of flexible and toughening polymer composed of hydroxyapatite-based composites. The composition and structure of artificial-hydroxyapatite are similar to inor- ganic components in human bone tissues, it has a non- toxicity, non-irritant property, and is also non-allergenic, non-mutagenic and carcinogenic, and can generate a chemical reaction with bone to change bone conduction. Therefore, nano-hydroxyapatites could be widely used in biological hard tissues, such as human bones, teeth and vascular stents, as repair and replacement materials, such as in oral implantology for increasing dental spine, ear bone or spine replacement, etc., allowing better results compared to those using metals and polymers [1-6]. However, the biological effects of nano-hydroxyapatites and its toxicity have been not studied systematically as yet. Therefore, it is very necessary to investigate their biological effects and toxicity. This paper will describe a study of this problem by a novel method using light spectrum technique. Crystalline hydroxyapatite belongs to hexagonal syst- em, has a L6PC symmetry and / m space group, its structure is hexagonal prism, with the surface of hexagon which is perpendicular to c-axis, angle between a and b-axes is 120°, parameters of its crystalline cell are a0 = b0 = 0.943 ~ 0.938nm, c0 = 0.688 ~ 0.686nm, the unit cell contains 10 Ca2 +, 6 3 6 P 3 4 PO and 2 . in the cell is in the four corners, 10 Ca2 + occupy two kinds of location, respectively, in which four Ca2 + occupy the Ca (Ⅰ) positions at z = 0 and z = 1/2 , respectively, the locations of 6 Ca2 + are in the Ca () poⅡsitions at z = 1 /4, and z = 3/4, respectively, the three ligand center is composed of three 03 and 6 OHOH 3 4 P O ligands are located at z = 1/4, and z = 3/4, which are located on a plane. The tetrahedral structure of 3 4 PO makes the HAP have a good stability. Its structure is shown in Figure 1. 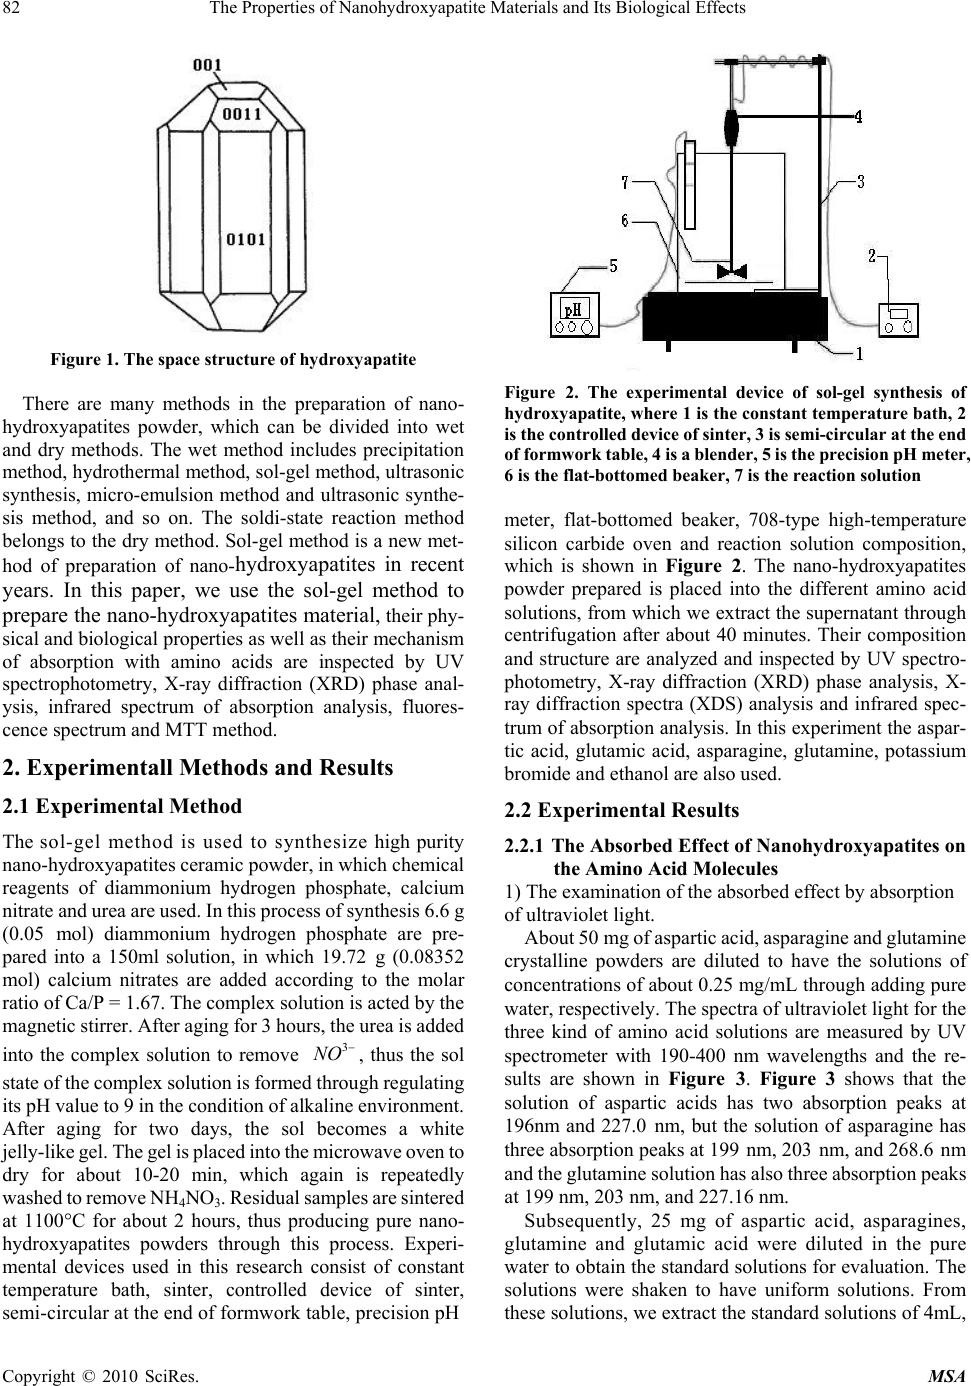 82 The Properties of Nanohydroxyapatite Materials and Its Biological Effects Figure 1. The space structure of hydroxyapatite There are many methods in the preparation of nano- hydroxyapatites powder, which can be divided into wet and dry methods. The wet method includes precipitation method, hydrothermal method, sol-gel method, ultrasonic synthesis, micro-emulsion method and ultrasonic synthe- sis method, and so on. The soldi-state reaction method belongs to the dry method. Sol-gel method is a new met- hod of preparation of nano-hydroxyapatites in recent years. In this paper, we use the sol-gel method to prepare the nano-hydroxyapatites material, their phy- sical and biological properties as well as their mechanism of absorption with amino acids are inspected by UV spectrophotometry, X-ray diffraction (XRD) phase anal- ysis, infrared spectrum of absorption analysis, fluores- cence spectrum and MTT method. 2. Experimentall Methods and Results 2.1 Experimental Method The sol-gel method is used to synthesize high purity nano-hydroxyapatites ceramic powder, in which chemical reagents of diammonium hydrogen phosphate, calcium nitrate and urea are used. In this process of synthesis 6.6 g (0.05 mol) diammonium hydrogen phosphate are pre- pared into a 150ml solution, in which 19.72 g (0.08352 mol) calcium nitrates are added according to the molar ratio of Ca/P = 1.67. The complex solution is acted by the magnetic stirrer. After aging for 3 hours, the urea is added into the complex solution to remove , thus the sol state of the complex solution is formed through regulating its pH value to 9 in the condition of alkaline environment. After aging for two days, the sol becomes a white jelly-like gel. The gel is placed into the microwave oven to dry for about 10-20 min, which again is repeatedly washed to remove NH4NO3. Residual samples are sintered at 1100°C for about 2 hours, thus producing pure nano- hydroxyapatites powders through this process. Experi- mental devices used in this research consist of constant temperature bath, sinter, controlled device of sinter, semi-circular at the end of formwork table, precision pH 3 NO Figure 2. The experimental device of sol-gel synthesis of hydroxyapatite, w here 1 is the constant temperature bath, 2 is the control led d evice of sin ter , 3 is semi- cir cular at th e en d of formwork ta ble, 4 is a blend er, 5 is th e pr ecis ion pH m eter, 6 is the flat-bottomed beaker, 7 is the reaction solution meter, flat-bottomed beaker, 708-type high-temperature silicon carbide oven and reaction solution composition, which is shown in Figure 2. The nano-hydroxyapatites powder prepared is placed into the different amino acid solutions, from which we extract the supernatant through centrifugation after about 40 minutes. Their composition and structure are analyzed and inspected by UV spectro- photometry, X-ray diffraction (XRD) phase analysis, X- ray diffraction spectra (XDS) analysis and infrared spec- trum of absorption analysis. In this experiment the aspar- tic acid, glutamic acid, asparagine, glutamine, potassium bromide and ethanol are also used. 2.2 Experimental Results 2.2.1 The Absorbed Effect of Nano hydroxyapat ites on the Amino Acid Molecules 1) The examination of the absorbed effect by absorption of ultraviolet light. About 50 mg of aspartic acid, asparagine and glutamine crystalline powders are diluted to have the solutions of concentrations of about 0.25 mg/mL through adding pure water, respectively. The spectra of ultraviolet light for the three kind of amino acid solutions are measured by UV spectrometer with 190-400 nm wavelengths and the re- sults are shown in Figure 3. Figure 3 shows that the solution of aspartic acids has two absorption peaks at 196nm and 227.0 nm, but the solution of asparagine has three absorption peaks at 199 nm, 203 nm, and 268.6 nm and the glutamine solution has also three absorption peaks at 199 nm, 203 nm, and 227.16 nm. Subsequently, 25 mg of aspartic acid, asparagines, glutamine and glutamic acid were diluted in the pure water to obtain the standard solutions for evaluation. The solutions were shaken to have uniform solutions. From these solutions, we extract the standard solutions of 4mL, Copyright © 2010 SciRes. MSA 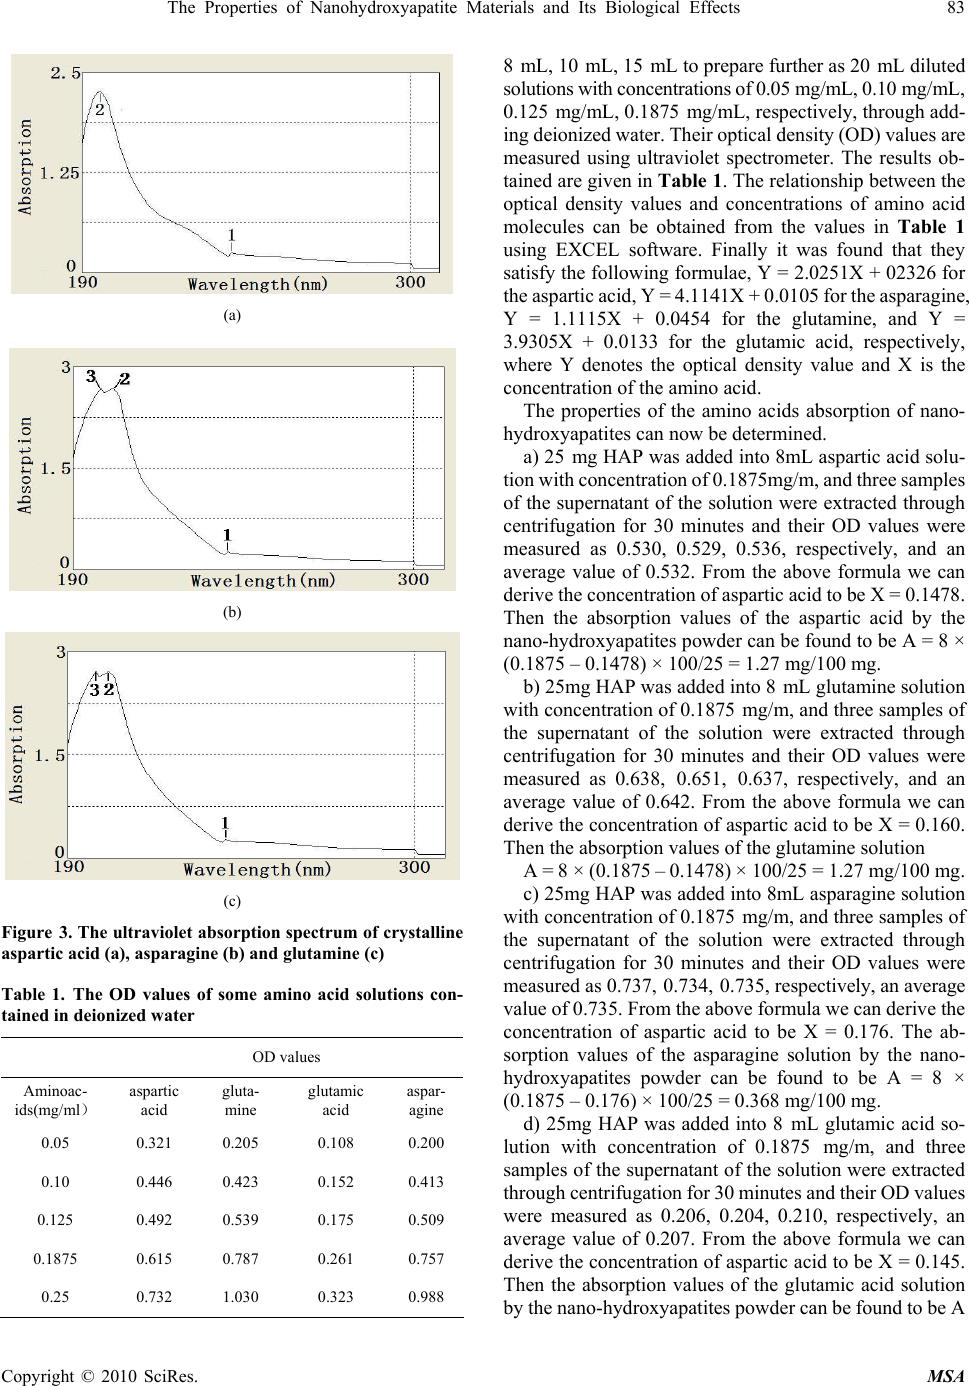 The Properties of Nanohydroxyapatite Materials and Its Biological Effects 83 (a) (b) (c) Figure 3. The ultraviolet absorption spectrum of crystalline aspartic acid (a), asparagine (b) and glutamine (c) Table 1. The OD values of some amino acid solutions con- tained in deionized water OD values Aminoac- ids( ) mg/ml aspartic acid gluta- mine glutamic acid aspar- agine 0.05 0.321 0.205 0.108 0.200 0.10 0.446 0.423 0.152 0.413 0.125 0.492 0.539 0.175 0.509 0.1875 0.615 0.787 0.261 0.757 0.25 0.732 1.030 0.323 0.988 8 mL, 10 mL, 15 mL to prepare further as 20 mL diluted solutions with concentrations of 0.05 mg/mL, 0.10 mg/mL, 0.125 mg/mL, 0.1875 mg/mL, respectively, through add- ing deionized water. Their optical density (OD) values are measured using ultraviolet spectrometer. The results ob- tained are given in Table 1. The relationship between the optical density values and concentrations of amino acid molecules can be obtained from the values in Table 1 using EXCEL software. Finally it was found that they satisfy the following formulae, Y = 2.0251X + 02326 for the aspartic acid, Y = 4.1141X + 0.0105 for the asparagine, Y = 1.1115X + 0.0454 for the glutamine, and Y = 3.9305X + 0.0133 for the glutamic acid, respectively, where Y denotes the optical density value and X is the concentration of the amino acid. The properties of the amino acids absorption of nano- hydroxyapatites can now be determined. a) 25 mg HAP was added into 8mL aspartic acid solu- tion with concentration of 0.1875mg/m, and three samples of the supernatant of the solution were extracted through centrifugation for 30 minutes and their OD values were measured as 0.530, 0.529, 0.536, respectively, and an average value of 0.532. From the above formula we can derive the concentration of aspartic acid to be X = 0.1478. Then the absorption values of the aspartic acid by the nano-hydroxyapatites powder can be found to be A = 8 × (0.1875 – 0.1478) × 100/25 = 1.27 mg/100 mg. b) 25mg HAP was added into 8 mL glutamine solution with concentration of 0.1875 mg/m, and three samples of the supernatant of the solution were extracted through centrifugation for 30 minutes and their OD values were measured as 0.638, 0.651, 0.637, respectively, and an average value of 0.642. From the above formula we can derive the concentration of aspartic acid to be X = 0.160. Then the absorption values of the glutamine solution A = 8 × (0.1875 – 0.1478) × 100/25 = 1.27 mg/100 mg. c) 25mg HAP was added into 8mL asparagine solution with concentration of 0.1875 mg/m, and three samples of the supernatant of the solution were extracted through centrifugation for 30 minutes and their OD values were measured as 0.737, 0.734, 0.735, respectively, an average value of 0.735. From the above formula we can derive the concentration of aspartic acid to be X = 0.176. The ab- sorption values of the asparagine solution by the nano- hydroxyapatites powder can be found to be A = 8 × (0.1875 – 0.176) × 100/25 = 0.368 mg/100 mg. d) 25mg HAP was added into 8 mL glutamic acid so- lution with concentration of 0.1875 mg/m, and three samples of the supernatant of the solution were extracted through centrifugation for 30 minutes and their OD values were measured as 0.206, 0.204, 0.210, respectively, an average value of 0.207. From the above formula we can derive the concentration of aspartic acid to be X = 0.145. Then the absorption values of the glutamic acid solution by the nano-hydroxyapatites powder can be found to be A Copyright © 2010 SciRes. MSA 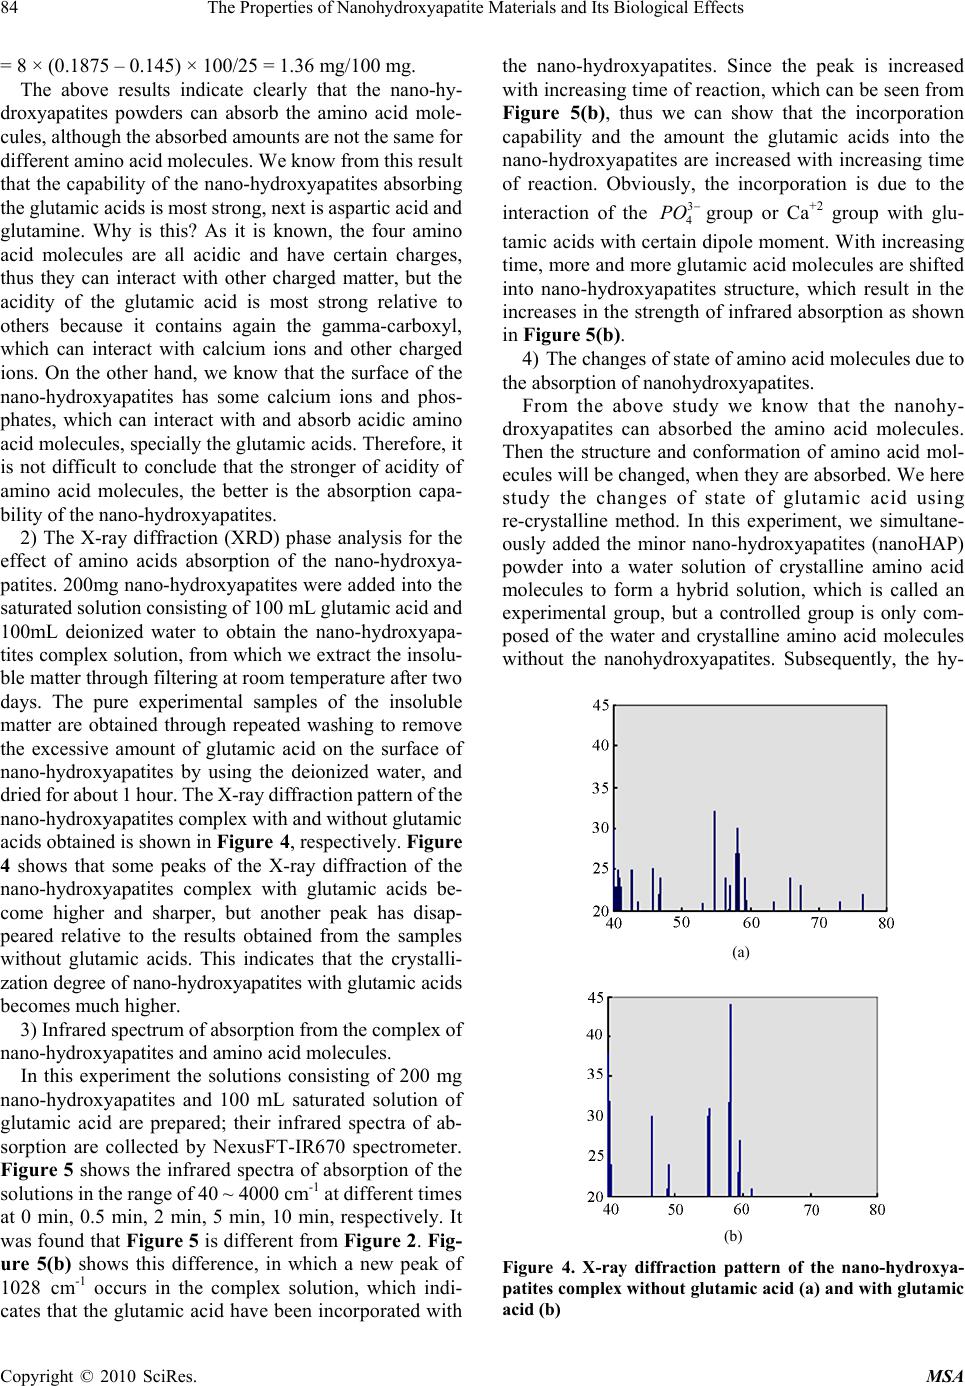 84 The Properties of Nanohydroxyapatite Materials and Its Biological Effects Copyright © 2010 SciRes. MSA = 8 × (0.1875 – 0.145) × 100/25 = 1.36 mg/100 mg. The above results indicate clearly that the nano-hy- droxyapatites powders can absorb the amino acid mole- cules, although the absorbed amounts are not the same for different amino acid molecules. We know from this result that the capability of the nano-hydroxyapatites absorbing the glutamic acids is most strong, next is aspartic acid and glutamine. Why is this? As it is known, the four amino acid molecules are all acidic and have certain charges, thus they can interact with other charged matter, but the acidity of the glutamic acid is most strong relative to others because it contains again the gamma-carboxyl, which can interact with calcium ions and other charged ions. On the other hand, we know that the surface of the nano-hydroxyapatites has some calcium ions and phos- phates, which can interact with and absorb acidic amino acid molecules, specially the glutamic acids. Therefore, it is not difficult to conclude that the stronger of acidity of amino acid molecules, the better is the absorption capa- bility of the nano-hydroxyapatites. 2) The X-ray diffraction (XRD) phase analysis for the effect of amino acids absorption of the nano-hydroxya- patites. 200mg nano-hydroxyapatites were added into the saturated solution consisting of 100 mL glutamic acid and 100mL deionized water to obtain the nano-hydroxyapa- tites complex solution, from which we extract the insolu- ble matter through filtering at room temperature after two days. The pure experimental samples of the insoluble matter are obtained through repeated washing to remove the excessive amount of glutamic acid on the surface of nano-hydroxyapatites by using the deionized water, and dried for about 1 hour. The X-ray diffraction pattern of the nano-hydroxyapatites complex with and without glutamic acids obtained is shown in Figure 4, respectively. Figure 4 shows that some peaks of the X-ray diffraction of the nano-hydroxyapatites complex with glutamic acids be- come higher and sharper, but another peak has disap- peared relative to the results obtained from the samples without glutamic acids. This indicates that the crystalli- zation degree of nano-hydroxyapatites with glutamic acids becomes much higher. 3) Infrared spectrum of absorption from the complex of nano-hydroxyapatites and amino acid molecules. In this experiment the solutions consisting of 200 mg nano-hydroxyapatites and 100 mL saturated solution of glutamic acid are prepared; their infrared spectra of ab- sorption are collected by NexusFT-IR670 spectrometer. Figure 5 shows the infrared spectra of absorption of the solutions in the range of 40 ~ 4000 cm-1 at different times at 0 min, 0.5 min, 2 min, 5 min, 10 min, respectively. It was found that Figure 5 is different from Figure 2. Fig- ure 5(b) shows this difference, in which a new peak of 1028 cm-1 occurs in the complex solution, which indi- cates that the glutamic acid have been incorporated with the nano-hydroxyapatites. Since the peak is increased with increasing time of reaction, which can be seen from Figure 5(b), thus we can show that the incorporation capability and the amount the glutamic acids into the nano-hydroxyapatites are increased with increasing time of reaction. Obviously, the incorporation is due to the interaction of the 3 4 PO group or Ca+2 group with glu- tamic acids with certain dipole moment. With increasing time, more and more glutamic acid molecules are shifted into nano-hydroxyapatites structure, which result in the increases in the strength of infrared absorption as shown in Figure 5(b). 4) The changes of state of amino acid molecules due to the absorption of nanohydroxyapatites. From the above study we know that the nanohy- droxyapatites can absorbed the amino acid molecules. Then the structure and conformation of amino acid mol- ecules will be changed, when they are absorbed. We here study the changes of state of glutamic acid using re-crystalline method. In this experiment, we simultane- ously added the minor nano-hydroxyapatites (nanoHAP) powder into a water solution of crystalline amino acid molecules to form a hybrid solution, which is called an experimental group, but a controlled group is only com- posed of the water and crystalline amino acid molecules without the nanohydroxyapatites. Subsequently, the hy- (a) (b) Figure 4. X-ray diffraction pattern of the nano-hydroxya- patites complex without glutamic acid (a) and with glutamic acid (b) 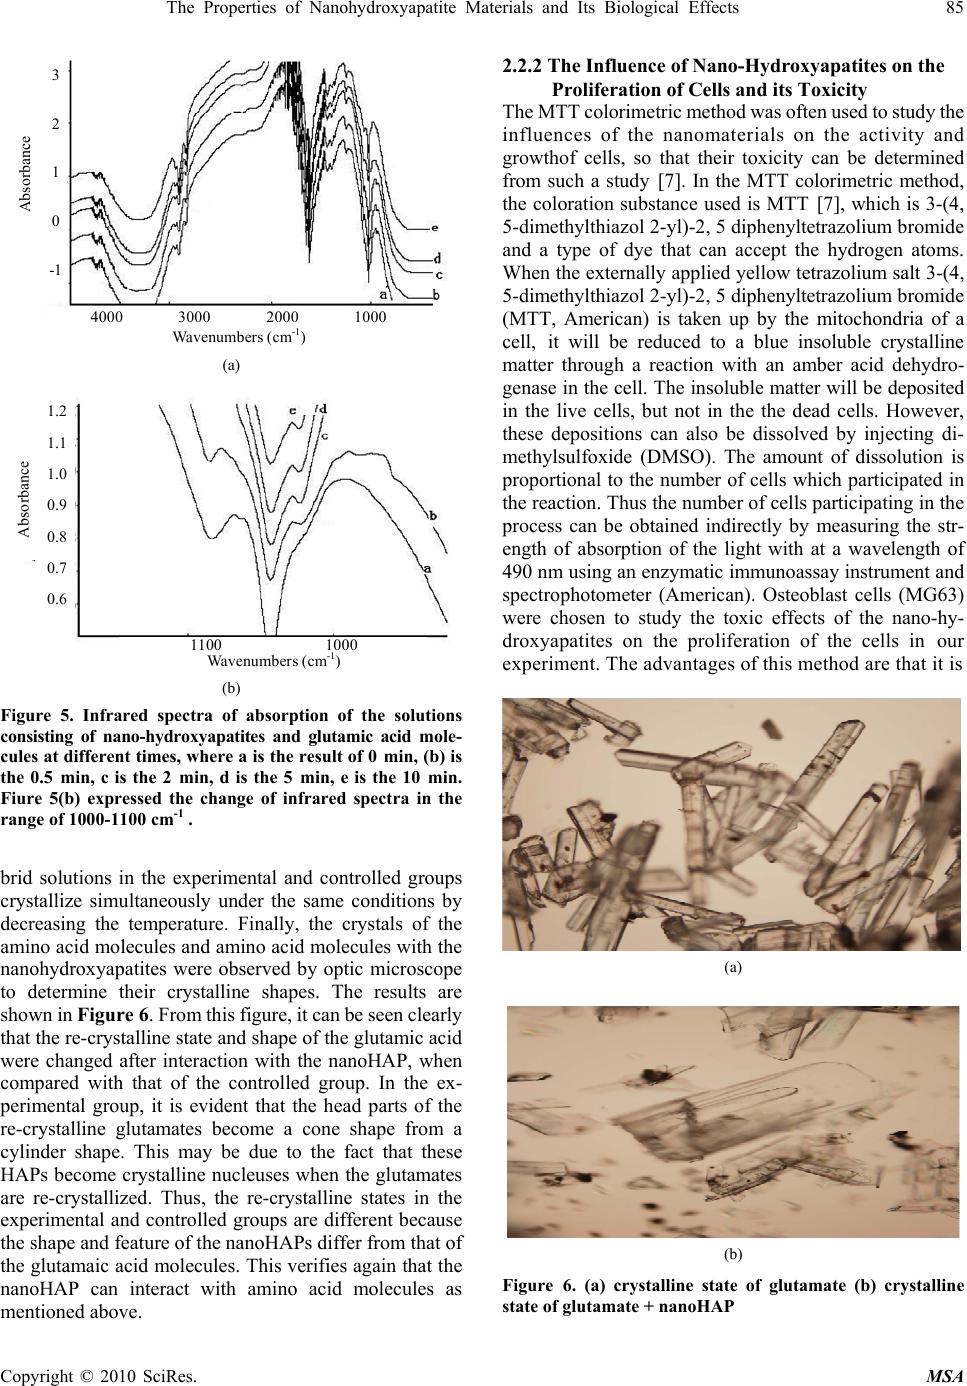 The Properties of Nanohydroxyapatite Materials and Its Biological Effects 85 Absorbance 3 2 1 0 -1 4000 3000 2000 1000 Wavenumbers (cm-1) (a) 1.2 1.1 1.0 0.9 0.8 0.7 0.6 Absorbance 1100 1000 Wavenumbers (cm-1) (b) Figure 5. Infrared spectra of absorption of the solutions consisting of nano-hydroxyapatites and glutamic acid mole- cules at different times, where a is the result of 0 min, (b) is the 0.5 min, c is the 2 min, d is the 5 min, e is the 10 min. Fiure 5(b) expressed the change of infrared spectra in the range of 1000-1100 cm-1 . brid solutions in the experimental and controlled groups crystallize simultaneously under the same conditions by decreasing the temperature. Finally, the crystals of the amino acid molecules and amino acid molecules with the nanohydroxyapatites were observed by optic microscope to determine their crystalline shapes. The results are shown in Figure 6. From this figure, it can be seen clearly that the re-crystalline state and shape of the glutamic acid were changed after interaction with the nanoHAP, when compared with that of the controlled group. In the ex- perimental group, it is evident that the head parts of the re-crystalline glutamates become a cone shape from a cylinder shape. This may be due to the fact that these HAPs become crystalline nucleuses when the glutamates are re-crystallized. Thus, the re-crystalline states in the experimental and controlled groups are different because the shape and feature of the nanoHAPs differ from that of the glutamaic acid molecules. This verifies again that the nanoHAP can interact with amino acid molecules as mentioned above. 2.2.2 The Influence of Nano-Hydroxyapatites on the Proliferation of Cells and its Toxicity The MTT colorimetric method was often used to study the influences of the nanomaterials on the activity and growthof cells, so that their toxicity can be determined from such a study [7]. In the MTT colorimetric method, the coloration substance used is MTT [7], which is 3-(4, 5-dimethylthiazol 2-yl)-2, 5 diphenyltetrazolium bromide and a type of dye that can accept the hydrogen atoms. When the externally applied yellow tetrazolium salt 3-(4, 5-dimethylthiazol 2-yl)-2, 5 diphenyltetrazolium bromide (MTT, American) is taken up by the mitochondria of a cell, it will be reduced to a blue insoluble crystalline matter through a reaction with an amber acid dehydro- genase in the cell. The insoluble matter will be deposited in the live cells, but not in the the dead cells. However, these depositions can also be dissolved by injecting di- methylsulfoxide (DMSO). The amount of dissolution is proportional to the number of cells which participated in the reaction. Thus the number of cells participating in the process can be obtained indirectly by measuring the str- ength of absorption of the light with at a wavelength of 490 nm using an enzymatic immunoassay instrument and spectrophotometer (American). Osteoblast cells (MG63) were chosen to study the toxic effects of the nano-hy- droxyapatites on the proliferation of the cells in our experiment. The advantages of this method are that it is (a) (b) Figure 6. (a) crystalline state of glutamate (b) crystalline state of glutamate + nanoHAP Copyright © 2010 SciRes. MSA 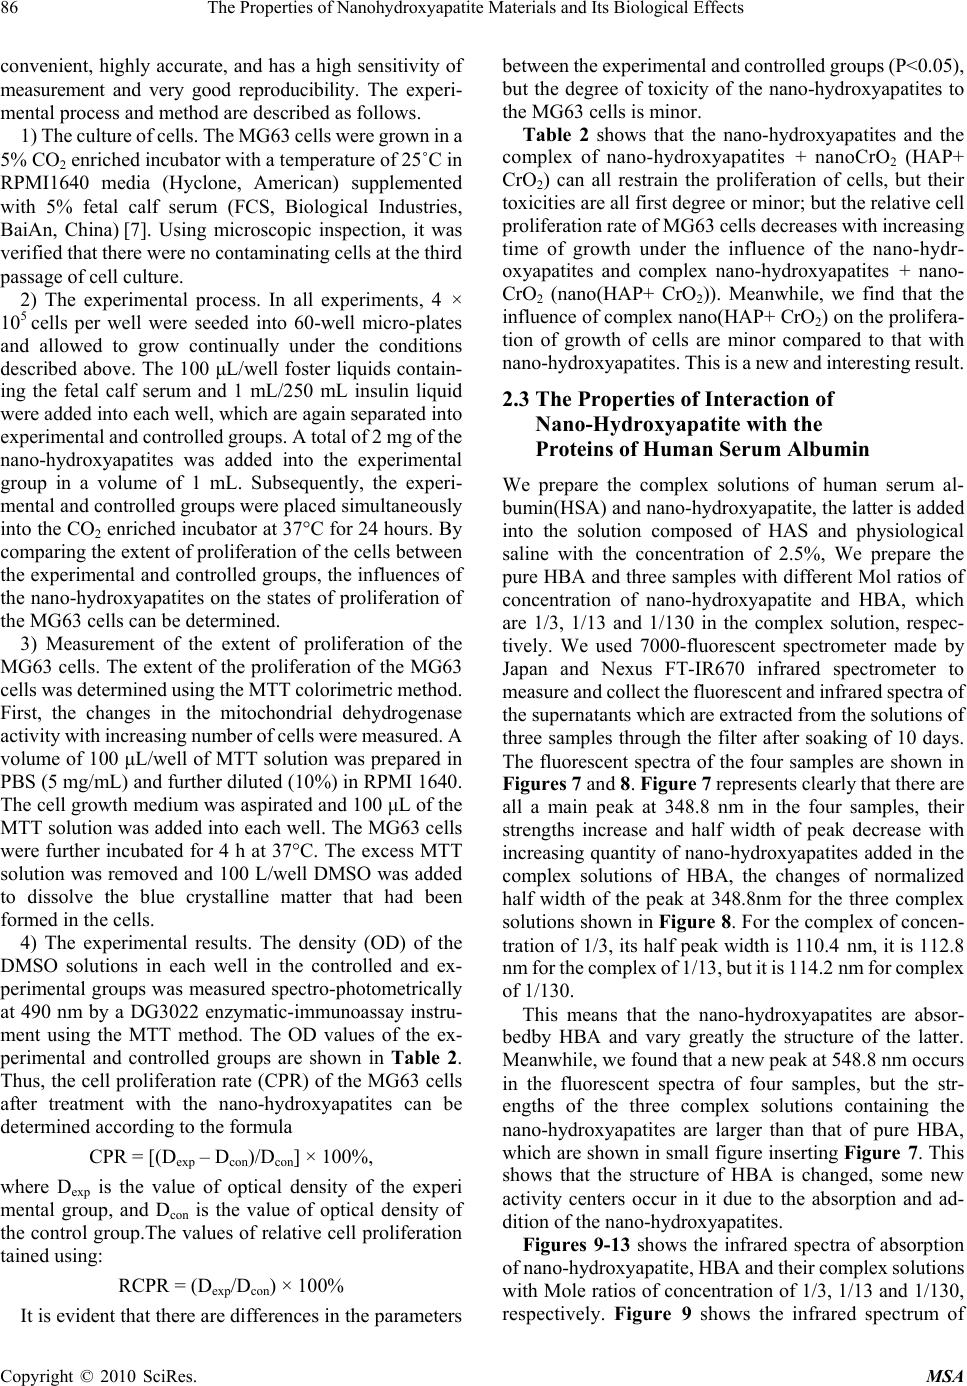 86 The Properties of Nanohydroxyapatite Materials and Its Biological Effects convenient, highly accurate, and has a high sensitivity of measurement and very good reproducibility. The experi- mental process and method are described as follows. 1) The culture of cells. The MG63 cells were grown in a 5% CO2 enriched incubator with a temperature of 25˚C in RPMI1640 media (Hyclone, American) supplemented with 5% fetal calf serum (FCS, Biological Industries, BaiAn, China) [7]. Using microscopic inspection, it was verified that there were no contaminating cells at the third passage of cell culture. 2) The experimental process. In all experiments, 4 × 10⁵ cells per well were seeded into 60-well micro-plates and allowed to grow continually under the conditions described above. The 100 μL/well foster liquids contain- ing the fetal calf serum and 1 mL/250 mL insulin liquid were added into each well, which are again separated into experimental and controlled groups. A total of 2 mg of the nano-hydroxyapatites was added into the experimental group in a volume of 1 mL. Subsequently, the experi- mental and controlled groups were placed simultaneously into the CO2 enriched incubator at 37°C for 24 hours. By comparing the extent of proliferation of the cells between the experimental and controlled groups, the influences of the nano-hydroxyapatites on the states of proliferation of the MG63 cells can be determined. 3) Measurement of the extent of proliferation of the MG63 cells. The extent of the proliferation of the MG63 cells was determined using the MTT colorimetric method. First, the changes in the mitochondrial dehydrogenase activity with increasing number of cells were measured. A volume of 100 μL/well of MTT solution was prepared in PBS (5 mg/mL) and further diluted (10%) in RPMI 1640. The cell growth medium was aspirated and 100 μL of the MTT solution was added into each well. The MG63 cells were further incubated for 4 h at 37°C. The excess MTT solution was removed and 100 L/well DMSO was added to dissolve the blue crystalline matter that had been formed in the cells. 4) The experimental results. The density (OD) of the DMSO solutions in each well in the controlled and ex- perimental groups was measured spectro-photometrically at 490 nm by a DG3022 enzymatic-immunoassay instru- ment using the MTT method. The OD values of the ex- perimental and controlled groups are shown in Table 2. Thus, the cell proliferation rate (CPR) of the MG63 cells after treatment with the nano-hydroxyapatites can be determined according to the formula CPR = [(Dexp – Dcon)/Dcon] × 100%, where Dexp is the value of optical density of the experi mental group, and Dcon is the value of optical density of the control group.The values of relative cell proliferation tained using: RCPR = (Dexp/Dcon) × 100% It is evident that there are differences in the parameters between the experimental and controlled groups (P<0.05), but the degree of toxicity of the nano-hydroxyapatites to the MG63 cells is minor. Table 2 shows that the nano-hydroxyapatites and the complex of nano-hydroxyapatites + nanoCrO2 (HAP+ CrO2) can all restrain the proliferation of cells, but their toxicities are all first degree or minor; but the relative cell proliferation rate of MG63 cells decreases with increasing time of growth under the influence of the nano-hydr- oxyapatites and complex nano-hydroxyapatites + nano- CrO2 (nano(HAP+ CrO2)). Meanwhile, we find that the influence of complex nano(HAP+ CrO2) on the prolifera- tion of growth of cells are minor compared to that with nano-hydroxyapatites. This is a new and interesting result. 2.3 The Properties of Interaction of Nano-Hydroxyapatite with the Proteins of Human Serum Albumin We prepare the complex solutions of human serum al- bumin(HSA) and nano-hydroxyapatite, the latter is added into the solution composed of HAS and physiological saline with the concentration of 2.5%, We prepare the pure HBA and three samples with different Mol ratios of concentration of nano-hydroxyapatite and HBA, which are 1/3, 1/13 and 1/130 in the complex solution, respec- tively. We used 7000-fluorescent spectrometer made by Japan and Nexus FT-IR670 infrared spectrometer to measure and collect the fluorescent and infrared spectra of the supernatants which are extracted from the solutions of three samples through the filter after soaking of 10 days. The fluorescent spectra of the four samples are shown in Figures 7 and 8. Figure 7 represents clearly that there are all a main peak at 348.8 nm in the four samples, their strengths increase and half width of peak decrease with increasing quantity of nano-hydroxyapatites added in the complex solutions of HBA, the changes of normalized half width of the peak at 348.8nm for the three complex solutions shown in Figure 8. For the complex of concen- tration of 1/3, its half peak width is 110.4 nm, it is 112.8 nm for the complex of 1/13, but it is 114.2 nm for complex of 1/130. This means that the nano-hydroxyapatites are absor- bedby HBA and vary greatly the structure of the latter. Meanwhile, we found that a new peak at 548.8 nm occurs in the fluorescent spectra of four samples, but the str- engths of the three complex solutions containing the nano-hydroxyapatites are larger than that of pure HBA, which are shown in small figure inserting Figure 7. This shows that the structure of HBA is changed, some new activity centers occur in it due to the absorption and ad- dition of the nano-hydroxyapatites. Figures 9-13 shows the infrared spectra of absorption of nano-hydroxyapatite, HBA and their complex solutions with Mole ratios of concentration of 1/3, 1/13 and 1/130, respectively. Figure 9 shows the infrared spectrum of Copyright © 2010 SciRes. MSA  The Properties of Nanohydroxyapatite Materials and Its Biological Effects 87 Copyright © 2010 SciRes. MSA 300400 500600 70 0 W a v e l e n g t h / n m 0 200 400 600 800 Fluorescence Intensity/a.u. 1 2 3 4 (a) Figure 8. The changes of normalized half width of the peak at 348.8 nm in the fluorescent spectra of three complex so- lutions, where 1, 2 and 3 de note the results of complex solu- tions with Mole ratios of concentration of 1/3 , 1/13 and 1/130 for the nano-hydroxyapatite and HBA, respectively 560 580 60 0 W a v el e n g t h / n m 0 20 40 60 Fluorescence Intensity/a.u. 1 2 3 4 absorption of the nano-hydroxyapatites in the range of 400-4000 cm-1. We see from this figure there are the peaks at 1038.27 cm-1 and 964.32 cm-1, which are the charac- teristic peaks of 3 4 PO , peaks at 3568 cm-1, which indi- cate the infrared absorption spectrum of OH-group. and a peak at 1092.78 cm-1, which is the infrared absorption spectrum of HOH group. However it contains a small amount of Ca(NO3)2. When Figsures 11-13 compare with Figures 9 and 10 we found that the infrared spectra, in- cluding the number, position and strength, of the complex solutions with Mole ratios of concentration of 1/3, 1/13 and 1/130 for the nano-hydroxyapatite and HBA differ those of both HBA and nano-hydroxyapatite. (b) Figure 7. The fluorescence spectra of complex solutions of nano hydroxyapatite and HBA, where 1, 2 and 3 in Figure 7(a) denote the results of the complexes with Mole ratios of concentration of 1/130, 1/13 and 1/3, for hydroxyapatite in HBA, respectively, 4 is the values of pure HBA solution, Figure 7(b) shows corresponding strength of the peaks at 548.8 nm for the four samples This indicates that HBA absorbed the nano-hydroxy- apatite, thus its structure of molecule is changed also due to the action of the nano-hydroxyapatite. This conclusion is the same with the above’s. Table 2. The optical density and relative generation rate of MG63 cells under influences of nanohydroxyapatites (HAP) and complex of nano-hydroxyapatites+ nanoCrO2 (HAP+ CrO2) with the same concentration of 5 mg/mL at different days time HAP HAP+CrO2 controlled group P(%) OD P(%) OD P(%) OD 1d 98.6 0.246 ± 0.0596 99.4 0.260 ± 0.0505 100 0.275 ± 0.0513 3d 94.9 0.290 ± 0.0519 97.5 0.435 ± 0.0415 100 0.500 ± 0.540 5d 93.7 0.299 ± 0.0236 95.9 0.539 ± 0.2732 100 0.619 ± 0.258 7d 92.6 0.312 ± 0.0230 93.6 0.661 ± 0.0715 100 1.002 ± 0.460  88 The Properties of Nanohydroxyapatite Materials and Its Biological Effects Wavenumbers (cm -1 ) Figure 9. The infrared spectrum of absorption of the nano- hydroxyapatite Wavenumbers (cm -1 ) Figure 10. The infrared spectrum of HBA Wavenumbers (cm-1) Figure 11. The infrared spectru m of comp lex so lution with Mole ratios of concentration of 1/3for the nano-hydroxyapatite and HBA. Copyright © 2010 SciRes. MSA 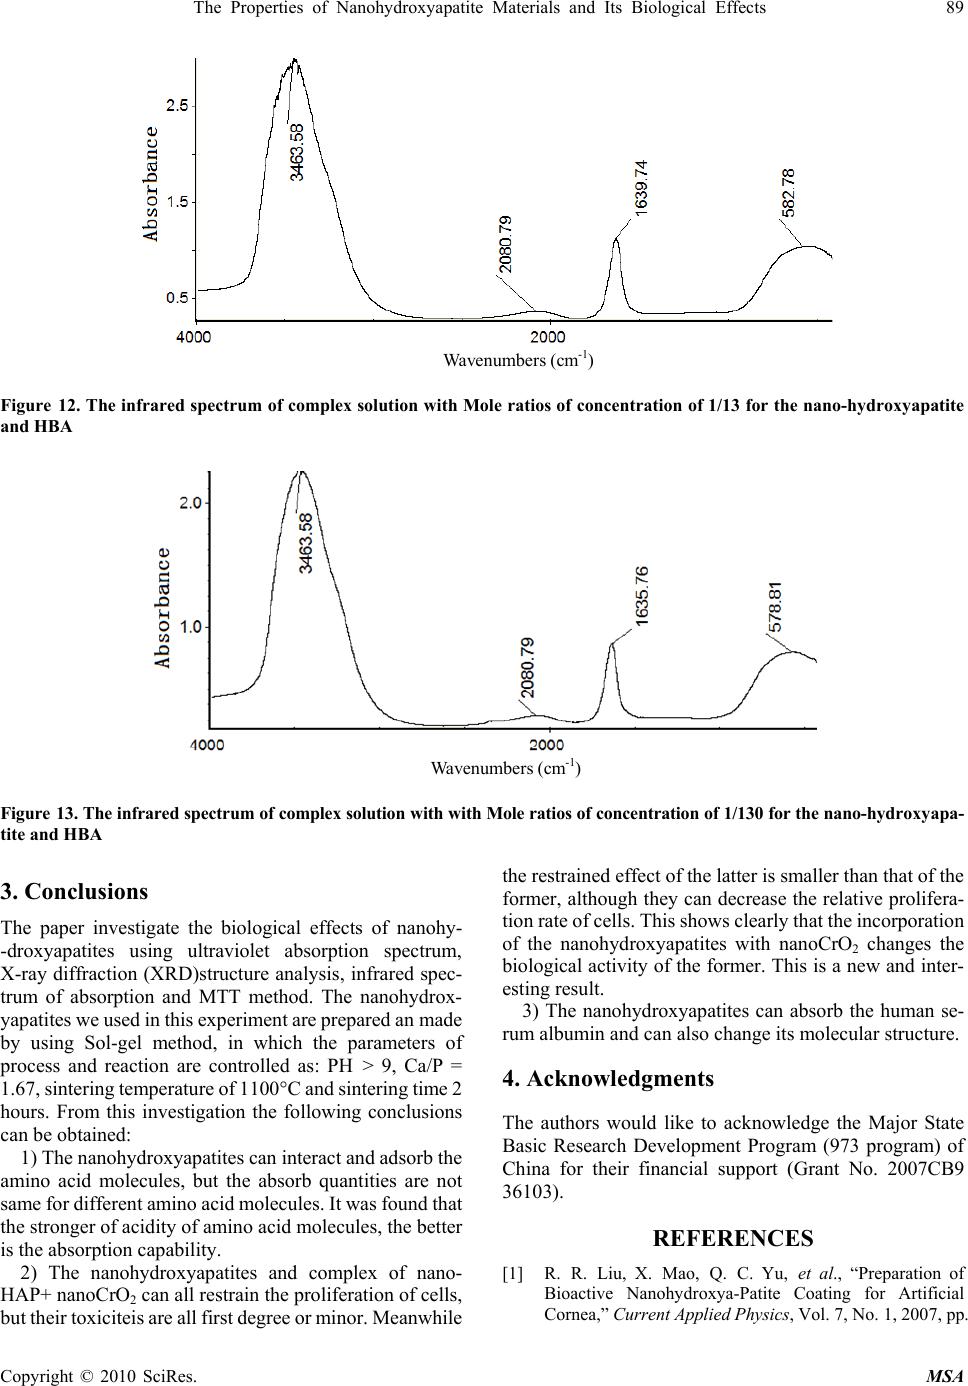 The Properties of Nanohydroxyapatite Materials and Its Biological Effects 89 Copyright © 2010 SciRes. MSA Wavenumbers (cm -1 ) Figure 12. The infrared spectrum of complex solution with Mole ratios of concentration of 1/13 for the nano-hydroxyapatite and HBA Wavenumbers (cm -1 ) Figure 13. The infrared spectrum of complex solution w ith w ith Mole ratios of conce ntration of 1/130 for the na no-hyd r o x y ap a - tite and HBA ions te the biological effects of nanohy- g ultraviolet absorption spectrum, cules, but the absorb quantities are not sa ain the proliferation of cells, bu the restrained effect of the latter is smaller than that of the former, although they can decrease the relative prolifera- edgments ent Program (973 program) of port (Grant No. 2007CB9 36103). ive Nanohydroxya-Patite Coating for Artificial Cornea,” Current Applied P h ysic s, Vol. 7, No. 1, 2007, pp. . Conclus3 The paper investiga -droxyapatites usin X-ray diffraction (XRD)structure analysis, infrared spec- trum of absorption and MTT method. The nanohydrox- yapatites we used in this experiment are prepared an made by using Sol-gel method, in which the parameters of process and reaction are controlled as: PH > 9, Ca/P = 1.67, sintering temperature of 1100°C and sintering time 2 hours. From this investigation the following conclusions can be obtained: 1) The nanohydroxyapatites can interact and adsorb the amino acid mole me for different amino acid molecules. It was found that the stronger of acidity of amino acid molecules, the better is the absorption capability. 2) The nanohydroxyapatites and complex of nano- HAP+ nanoCrO can all restr 2 t their toxiciteis are all first degree or minor. Meanwhile tion rate of cells. This shows clearly that the incorporation of the nanohydroxyapatites with nanoCrO2 changes the biological activity of the former. This is a new and inter- esting result. 3) The nanohydroxyapatites can absorb the human se- rum albumin and can also change its molecular structure. 4. Acknowl The authors would like to acknowledge the Major State Basic Research Developm China for their financial sup REFERENCES [1] R. R. Liu, X. Mao, Q. C. Yu, et al., “Preparation of Bioact 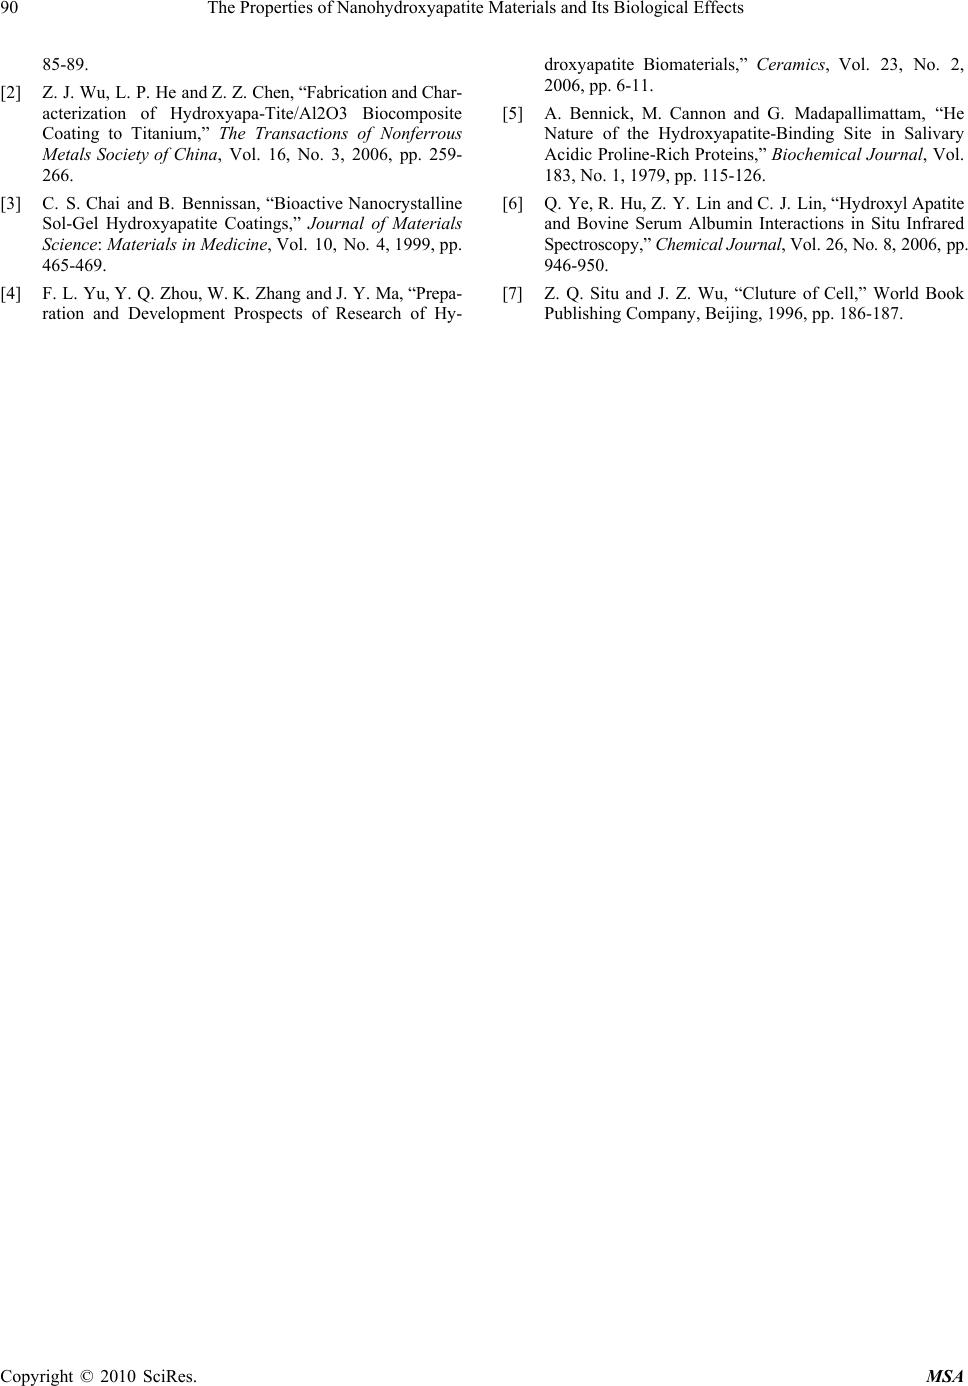 90 The Properties of Nanohydroxyapatite Materials and Its Biological Effects 85-89. ydroxyapatite-Binding Site in Salivary teractions in Situ Infrared Company, Beijing, 1996, pp. 186-187. [2] Z. J. Wu, L. P. He and Z. Z. Chen, “Fabrication and Char- acterization of Hydroxyapa-Tite/Al2O3 Biocomposite Coating to Titanium,” The Transactions of Nonferrous Metals Society of China, Vol. 16, No. 3, 2006, pp. 259- 266. [3] C. S. Chai and B. Bennissan, “Bioactive Nanocrystalline Sol-Gel Hydroxyapatite Coatings,” Journal of Materials Science: Materials in Medicine, Vol. 10, No. 4, 1999, pp. 465-469. [4] F. L. Yu, Y. Q. Zhou, W. K. Zhang and J. Y. Ma, “Prepa- ration and Development Prospects of Research of Hy- droxyapatite Biomaterials,” Ceramics, Vol. 23, No. 2, 2006, pp. 6-11. [5] A. Bennick, M. Cannon and G. Madapallimattam, “He Nature of the H Acidic Proline-Rich Proteins,” Biochemical Journal, Vol. 183, No. 1, 1979, pp. 115-126. [6] Q. Ye, R. Hu, Z. Y. Lin and C. J. Lin, “Hydroxyl Apatite and Bovine Serum Albumin In Spectroscopy,” Chemical Journal, Vol. 26, No. 8, 2006, pp. 946-950. [7] Z. Q. Situ and J. Z. Wu, “Cluture of Cell,” World Book Publishing Copyright © 2010 SciRes. MSA |