Paper Menu >>
Journal Menu >>
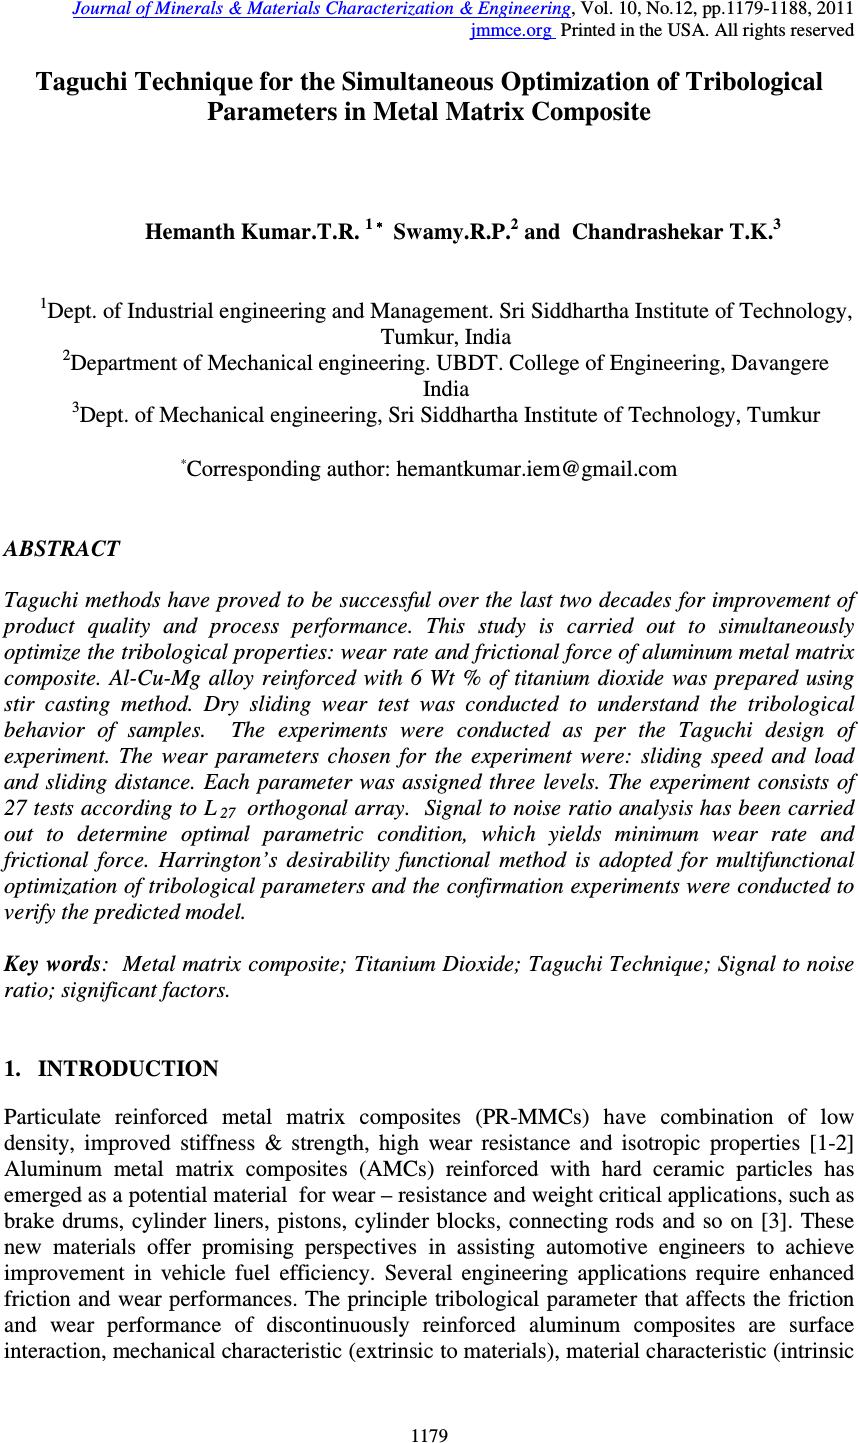 Journal of Minerals & Materials Characterization & Engineering, Vol. 10, No.12, pp.1179-1188, 2011 jmmce.org Printed in the USA. All rights reserved 1179 Taguchi Technique for the Simultaneous Optimization of Tribological Parameters in Metal Matrix Composite Hemanth Kumar.T.R. 1 Swamy.R.P. 2 and Chandrashekar T.K. 3 1 Dept. of Industrial engineering and Management. Sri Siddhartha Institute of Technology, Tumkur, India 2 Department of Mechanical engineering. UBDT. College of Engineering, Davangere India 3 Dept. of Mechanical engineering, Sri Siddhartha Institute of Technology, Tumkur Corresponding author: hemantkumar.iem@gmail.com ABSTRACT Taguchi methods have proved to be successful over the last two decades for improvement of product quality and process performance. This study is carried out to simultaneously optimize the tribological properties: wear rate and frictional force of aluminum metal matrix composite. Al-Cu-Mg alloy reinforced with 6 Wt % of titanium dioxide was prepared using stir casting method. Dry sliding wear test was conducted to understand the tribological behavior of samples. The experiments were conducted as per the Taguchi design of experiment. The wear parameters chosen for the experiment were: sliding speed and load and sliding distance. Each parameter was assigned three levels. The experiment consists of 27 tests according to L 27 orthogonal array. Signal to noise ratio analysis has been carried out to determine optimal parametric condition, which yields minimum wear rate and frictional force. Harrington’s desirability functional method is adopted for multifunctional optimization of tribological parameters and the confirmation experiments were conducted to verify the predicted model. Key words: Metal matrix composite; Titanium Dioxide; Taguchi Technique; Signal to noise ratio; significant factors. 1. INTRODUCTION Particulate reinforced metal matrix composites (PR-MMCs) have combination of low density, improved stiffness & strength, high wear resistance and isotropic properties [1-2] Aluminum metal matrix composites (AMCs) reinforced with hard ceramic particles has emerged as a potential material for wear – resistance and weight critical applications, such as brake drums, cylinder liners, pistons, cylinder blocks, connecting rods and so on [3]. These new materials offer promising perspectives in assisting automotive engineers to achieve improvement in vehicle fuel efficiency. Several engineering applications require enhanced friction and wear performances. The principle tribological parameter that affects the friction and wear performance of discontinuously reinforced aluminum composites are surface interaction, mechanical characteristic (extrinsic to materials), material characteristic (intrinsic  1180 Hemanth Kumar.T.R. et al Vol.10, No.12 to materials) and tribo contact condition. Sannino et al., discussed most frequently encountered factors which are associated with four tribological parameters in his review paper [4] and these factors are shown in the Cause and Effect diagram in Figure 1. Mechanical Parameters Tribocontact Surface InteractionMaterial Parameters Wear & Friction Mechanism Loading Conditions Relative Velocity Intial Temperature Surface FinishDuration of interaction Contact Geometry Topography evolution Third Body Lubrication Dry Chemical Reaction Solid Film Transfer Flash temp. rising Rolling Sliding Fretting Reciprocating Impact Erosion Types of chemical bonding Melting point/ Phase transfer Microstructure Precipitation hardening Composite /Second phase Hardness / Yield strength Fracture Toughnes Fracture toughness Thermal poperties Figure1. Cause and effect diagram of tribological properties. Some of the researcher investigated the effect of particulate reinforcement on aluminum alloy and reported that composites exhibits higher wear resistance, higher seizure pressure, less frictional heating and marginally lower coefficient of friction when compared with the matrix alloy [5-7]. At elevated temperature, Al7075 – glass fiber reinforced composites exhibits better wear resistance than the base alloy [8]. Sliding wear, slurry erosive wear of the as-cast metal matrix composites (MMCs) were studied by Ramachandra et al., [9] and reported that sliding wear and slurry erosive wear resistance improved considerably with the addition of SiC particles, where as corrosion resistance decrease. Dry sliding wear behavior of aluminum metal matrix composites has been reported [10-12] and abrasive wear of aluminum composites has extensively reviewed by Deuis et al., [13]. Uyyuru et al [14] studied the effect of reinforcement volume fraction and size distribution on the tribological behavior of Al-composites and Martin investigated the temperature effects on the wear behavior of particulate reinforced Al-based composites [15] and influence of heat treatment on the wear behavior of aluminum composites by Gomez de Salazar et al [16]. Effect of aging on wear of MMCs was carried out by Guo et al [17] and Grigoris et al [18]. Much research has been carried out to understand wear behavior of composite materials. Meager information is available regarding the simultaneous optimization of tribological parameters: Sliding wear rate and frictional force of the Metal matrix composite. In this light, this study is carried out to optimize tribological parameters of Titanium Dioxide reinforced Aluminum metal matrix composites using Taguchi’s parameter design methodology. 1.1 Taguchi Design of Experiment Taguchi design of experiment is a powerful analysis tool for modeling and analyzing the influence of control factors on performance output. The most important stage in the design of  Vol.10, No.12 Taguchi Technique 1181 experiment lies in the selection of the control factors. Therefore, a number of factors are included so that non-significant variables can be identified at earliest opportunity. Taguchi method provides a simple, systematic and efficient methodology for the optimization of the control factors. Quality characteristic of a product under investigation in response to a factor introduced in the experimental design is the ‘Signal’ of the desired effect. The effect of the external factors (Uncontrollable factors) on the outcome of the quality characteristic under test is termed as ‘noise’. The Signal-to-Noise ratio (S/N ratio) measures the sensitivity of the Quality characteristic being investigated in a controlled manner to those of external influencing factors (Noise factors) not under control. The S/N ratio is a transformed figure of merit, created from the loss function. S/N ratio combines both the parameters (the mean level of the quality and the variation around this mean) in a single metric. The aim in any experiment is always to determine the highest possible S/N ratio for the result (wear rate) a high value of S/N ratio implies that signal is much higher than the random effects of noise factors [19]. 2. EXPERIMENTAL DETAILS. 2.1 Test Materials 2.1.1. Matrix material. The aluminum alloy AA2618 is used as a matrix material for the preparation of composite material. This alloy is a heat treatable Al-Cu-Mg-Fe-Ni alloy, developed for high temperature applications [20], especially in the manufacture of aircraft engine components and automobile applications [21]. This alloy has good elevated temperature strength up to 204 O C. The presence of small amounts of Fe and Ni produces micro structural stability under thermal exposure [20]. This alloy derives its strength from a combination of precipitation and dispersion hardening. The composition of this alloy is Cu - 2.18 %, Mg - 1.43%, Ni -1.1%, Fe - 0.93%, Si - 0.16%, Ti - 0.04 %, Mn - 0.028% and balance is aluminum. 2.1.2. Reinforcement material. Titanium dioxide (TiO 2 ) is used as a reinforcing material for the preparation of composite material. Titanium dioxide is a fine white powder, which is one of the most important reinforcing materials used for making composites for many engineering applications. Against this background, the present research work has been undertaken, with an objective to optimize the tribological behavior of TiO2 reinforced in Aluminum alloy composites. The composites were produced using liquid vortex method by adding 6 wt % of Titanium dioxide in aluminum alloy matrix material. 2.2 Plan of experiments using orthogonal array. Tribological behaviors of the samples were studied by conducting the dry sliding wear test as per the standard orthogonal array (OA). The wear parameters chosen for the experiment were: sliding speed in m/s, load in N and sliding distance in m. The non-linear behavior of the process parameters, if exists, can only be revealed if more than two levels of the parameters are investigated. Therefore, each parameter was analyzed at three levels. The process parameters along with their values at three levels are given in Table 1. It was also decided to study the two factor interaction effects on tribological behavior of the sample. The 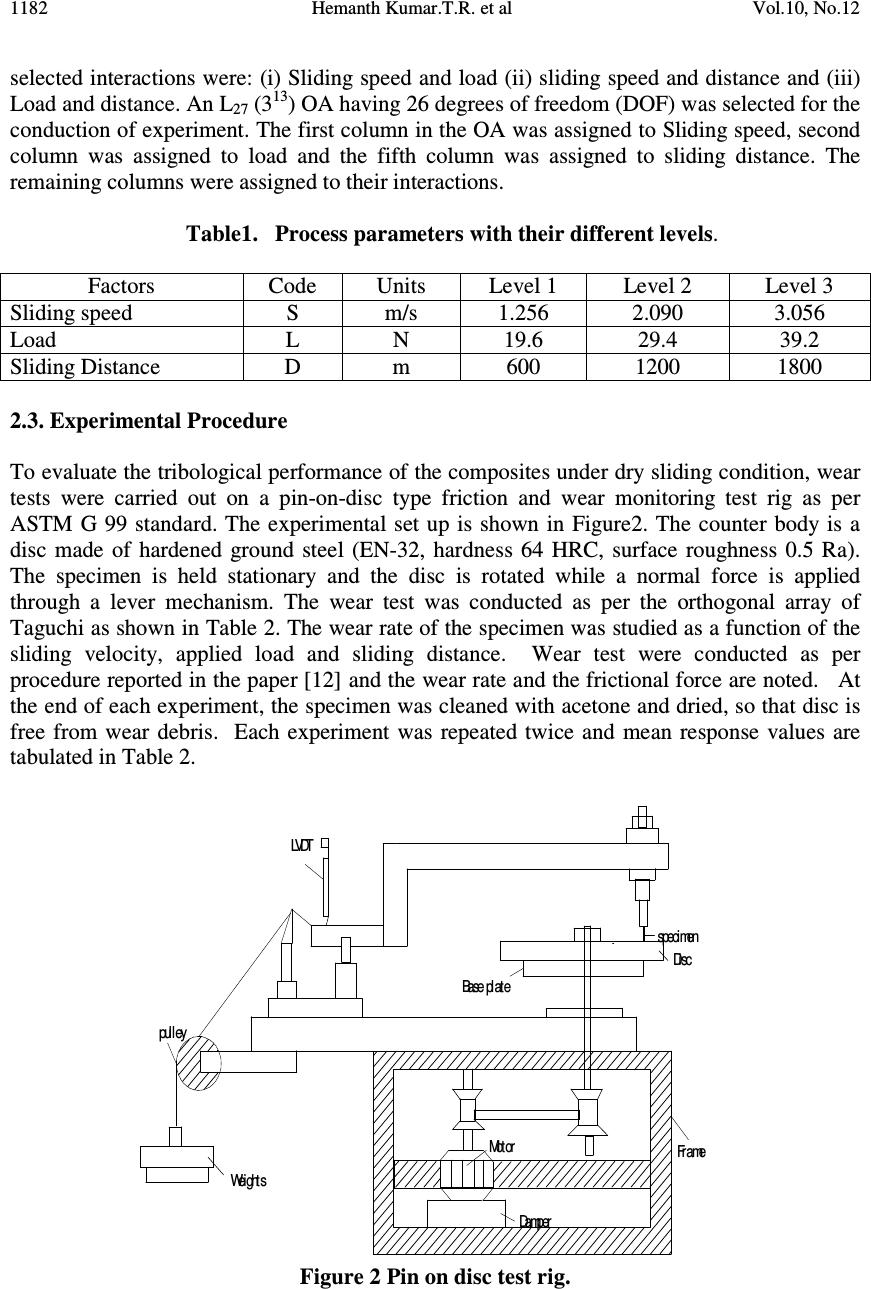 1182 Hemanth Kumar.T.R. et al Vol.10, No.12 selected interactions were: (i) Sliding speed and load (ii) sliding speed and distance and (iii) Load and distance. An L 27 (3 13 ) OA having 26 degrees of freedom (DOF) was selected for the conduction of experiment. The first column in the OA was assigned to Sliding speed, second column was assigned to load and the fifth column was assigned to sliding distance. The remaining columns were assigned to their interactions. Table1. Process parameters with their different levels. 2.3. Experimental Procedure To evaluate the tribological performance of the composites under dry sliding condition, wear tests were carried out on a pin-on-disc type friction and wear monitoring test rig as per ASTM G 99 standard. The experimental set up is shown in Figure2. The counter body is a disc made of hardened ground steel (EN-32, hardness 64 HRC, surface roughness 0.5 Ra). The specimen is held stationary and the disc is rotated while a normal force is applied through a lever mechanism. The wear test was conducted as per the orthogonal array of Taguchi as shown in Table 2. The wear rate of the specimen was studied as a function of the sliding velocity, applied load and sliding distance. Wear test were conducted as per procedure reported in the paper [12] and the wear rate and the frictional force are noted. At the end of each experiment, the specimen was cleaned with acetone and dried, so that disc is free from wear debris. Each experiment was repeated twice and mean response values are tabulated in Table 2. pulley LVDT specimen Disc Base plate Weights Damper Motor Frame Figure 2 Pin on disc test rig. Factors Code Units Level 1 Level 2 Level 3 Sliding speed S m/s 1.256 2.090 3.056 Load L N 19.6 29.4 39.2 Sliding Distance D m 600 1200 1800 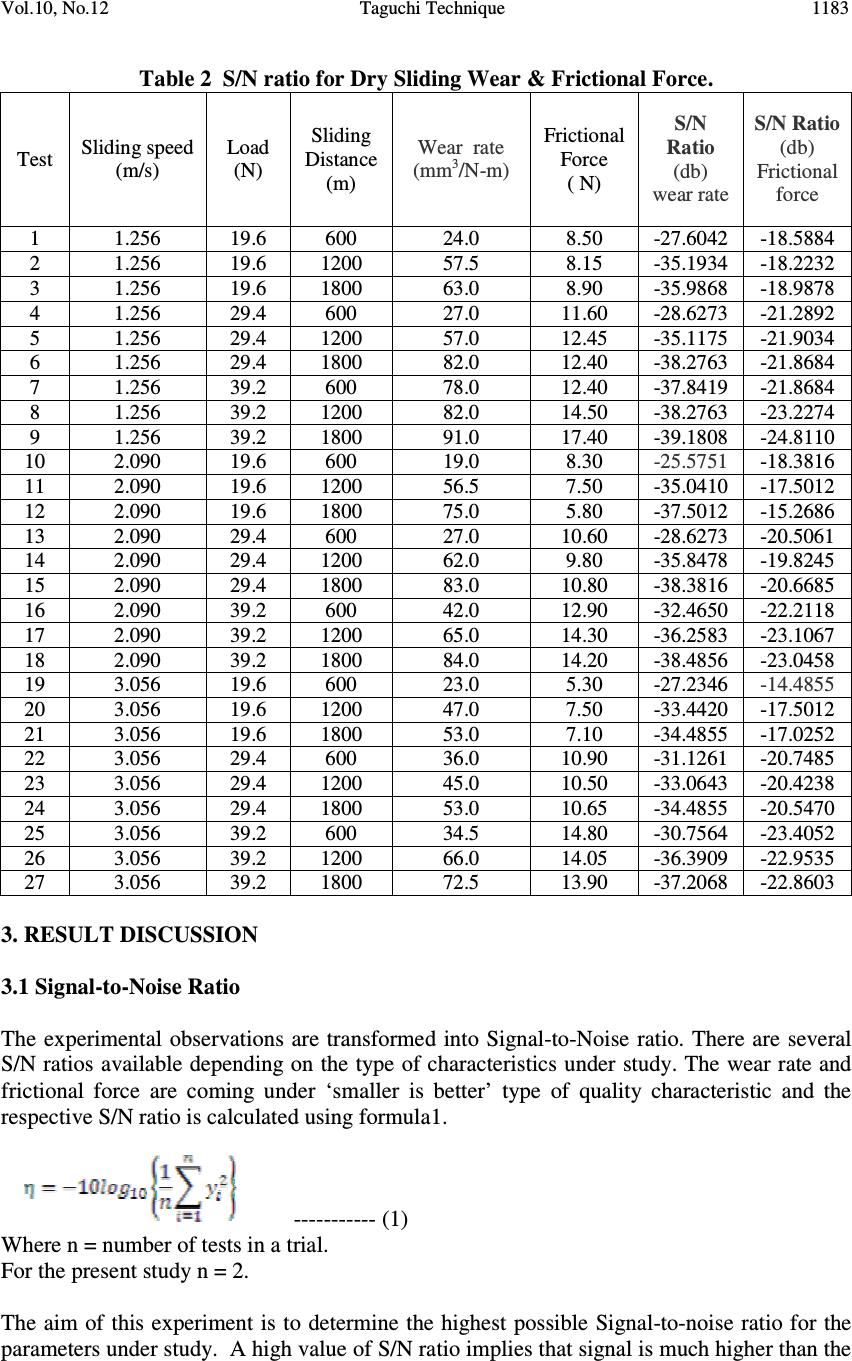 Vol.10, No.12 Taguchi Technique 1183 Table 2 S/N ratio for Dry Sliding Wear & Frictional Force. Test Sliding speed (m/s) Load (N) Sliding Distance (m) Wear rate (mm 3 /N-m) Frictional Force ( N) S/N Ratio (db) wear rate S/N Ratio (db) Frictional force 1 1.256 19.6 600 24.0 8.50 -27.6042 -18.5884 2 1.256 19.6 1200 57.5 8.15 -35.1934 -18.2232 3 1.256 19.6 1800 63.0 8.90 -35.9868 -18.9878 4 1.256 29.4 600 27.0 11.60 -28.6273 -21.2892 5 1.256 29.4 1200 57.0 12.45 -35.1175 -21.9034 6 1.256 29.4 1800 82.0 12.40 -38.2763 -21.8684 7 1.256 39.2 600 78.0 12.40 -37.8419 -21.8684 8 1.256 39.2 1200 82.0 14.50 -38.2763 -23.2274 9 1.256 39.2 1800 91.0 17.40 -39.1808 -24.8110 10 2.090 19.6 600 19.0 8.30 -25.5751 -18.3816 11 2.090 19.6 1200 56.5 7.50 -35.0410 -17.5012 12 2.090 19.6 1800 75.0 5.80 -37.5012 -15.2686 13 2.090 29.4 600 27.0 10.60 -28.6273 -20.5061 14 2.090 29.4 1200 62.0 9.80 -35.8478 -19.8245 15 2.090 29.4 1800 83.0 10.80 -38.3816 -20.6685 16 2.090 39.2 600 42.0 12.90 -32.4650 -22.2118 17 2.090 39.2 1200 65.0 14.30 -36.2583 -23.1067 18 2.090 39.2 1800 84.0 14.20 -38.4856 -23.0458 19 3.056 19.6 600 23.0 5.30 -27.2346 -14.4855 20 3.056 19.6 1200 47.0 7.50 -33.4420 -17.5012 21 3.056 19.6 1800 53.0 7.10 -34.4855 -17.0252 22 3.056 29.4 600 36.0 10.90 -31.1261 -20.7485 23 3.056 29.4 1200 45.0 10.50 -33.0643 -20.4238 24 3.056 29.4 1800 53.0 10.65 -34.4855 -20.5470 25 3.056 39.2 600 34.5 14.80 -30.7564 -23.4052 26 3.056 39.2 1200 66.0 14.05 -36.3909 -22.9535 27 3.056 39.2 1800 72.5 13.90 -37.2068 -22.8603 3. RESULT DISCUSSION 3.1 Signal-to-Noise Ratio The experimental observations are transformed into Signal-to-Noise ratio. There are several S/N ratios available depending on the type of characteristics under study. The wear rate and frictional force are coming under ‘smaller is better’ type of quality characteristic and the respective S/N ratio is calculated using formula1. ----------- (1) Where n = number of tests in a trial. For the present study n = 2. The aim of this experiment is to determine the highest possible Signal-to-noise ratio for the parameters under study. A high value of S/N ratio implies that signal is much higher than the 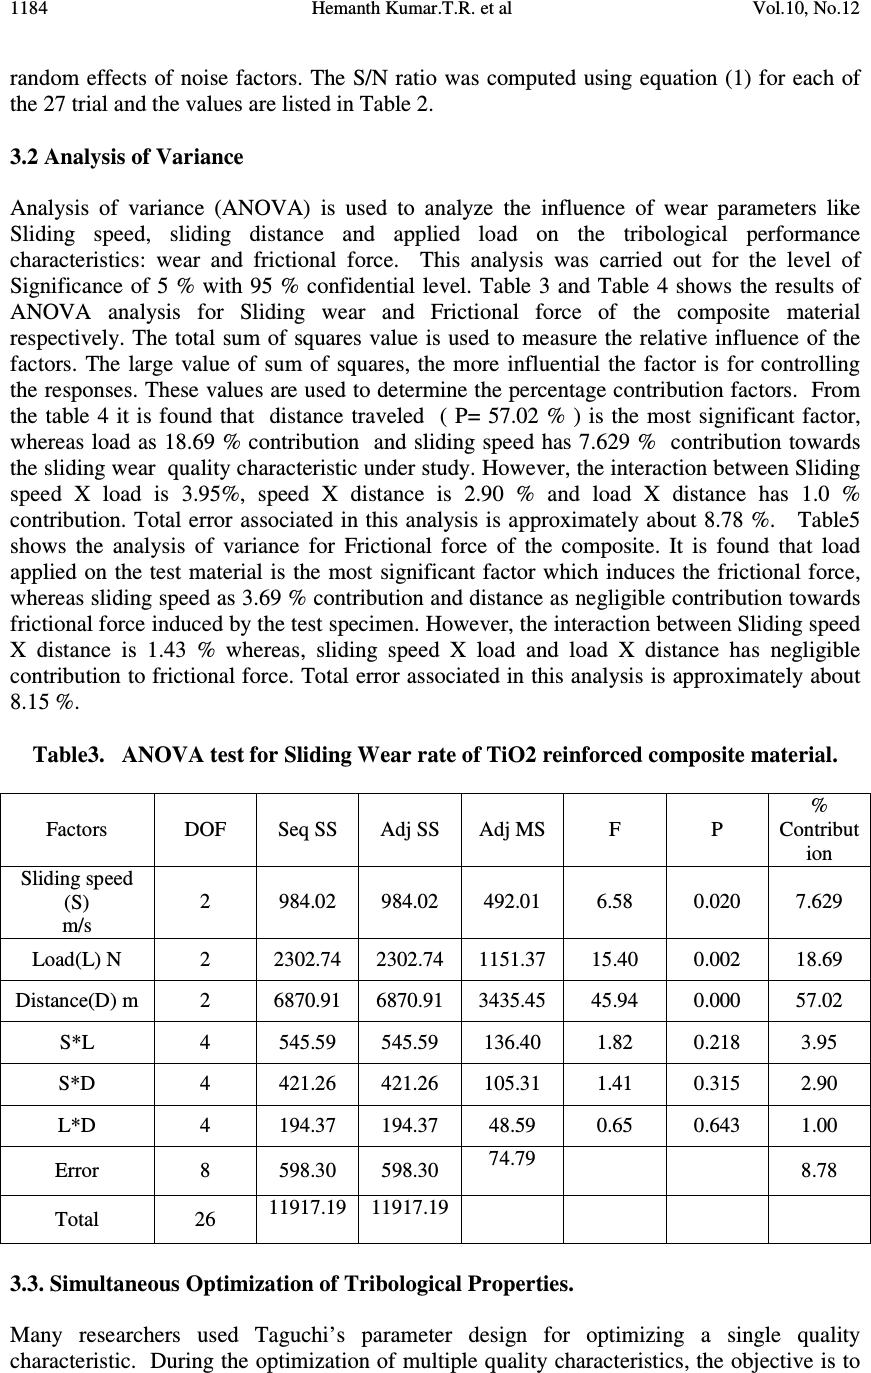 1184 Hemanth Kumar.T.R. et al Vol.10, No.12 random effects of noise factors. The S/N ratio was computed using equation (1) for each of the 27 trial and the values are listed in Table 2. 3.2 Analysis of Variance Analysis of variance (ANOVA) is used to analyze the influence of wear parameters like Sliding speed, sliding distance and applied load on the tribological performance characteristics: wear and frictional force. This analysis was carried out for the level of Significance of 5 % with 95 % confidential level. Table 3 and Table 4 shows the results of ANOVA analysis for Sliding wear and Frictional force of the composite material respectively. The total sum of squares value is used to measure the relative influence of the factors. The large value of sum of squares, the more influential the factor is for controlling the responses. These values are used to determine the percentage contribution factors. From the table 4 it is found that distance traveled ( P= 57.02 % ) is the most significant factor, whereas load as 18.69 % contribution and sliding speed has 7.629 % contribution towards the sliding wear quality characteristic under study. However, the interaction between Sliding speed X load is 3.95%, speed X distance is 2.90 % and load X distance has 1.0 % contribution. Total error associated in this analysis is approximately about 8.78 %. Table5 shows the analysis of variance for Frictional force of the composite. It is found that load applied on the test material is the most significant factor which induces the frictional force, whereas sliding speed as 3.69 % contribution and distance as negligible contribution towards frictional force induced by the test specimen. However, the interaction between Sliding speed X distance is 1.43 % whereas, sliding speed X load and load X distance has negligible contribution to frictional force. Total error associated in this analysis is approximately about 8.15 %. Table3. ANOVA test for Sliding Wear rate of TiO2 reinforced composite material. Factors DOF Seq SS Adj SS Adj MS F P % Contribut ion Sliding speed (S) m/s 2 984.02 984.02 492.01 6.58 0.020 7.629 Load(L) N 2 2302.74 2302.74 1151.37 15.40 0.002 18.69 Distance(D) m 2 6870.91 6870.91 3435.45 45.94 0.000 57.02 S*L 4 545.59 545.59 136.40 1.82 0.218 3.95 S*D 4 421.26 421.26 105.31 1.41 0.315 2.90 L*D 4 194.37 194.37 48.59 0.65 0.643 1.00 Error 8 598.30 598.30 74.79 8.78 Total 26 11917.19 11917.19 3.3. Simultaneous Optimization of Tribological Properties. Many researchers used Taguchi’s parameter design for optimizing a single quality characteristic. During the optimization of multiple quality characteristics, the objective is to  Vol.10, No.12 Taguchi Technique 1185 determine the best factors settings which will simultaneously optimize all the quality characteristics under study. This investigation was carried out to simultaneously optimize the tribological parameters; sliding wear rate and frictional force. The experimental results are analyzed to determine the process parameters which yield the least sliding wear and minimum frictional force. Table4. ANOVA test for Frictional Force for TiO2 reinforced composite material. Factors DOF SS Adj SS V F P % Contribut ion Sliding speed (S) m/s 2 10.416 10.416 10.416 3.67 0.074 3.69 Load(L) N 2 209.724 209.724 209.724 73.87 0.000 85.47 Distance(D) m 2 1.922 1.922 1.922 0.68 0.535 0.205 S*L 4 1.884 1.884 1.884 0.33 0.849 0.190 S*D 4 4.914 4.914 4.914 0.87 0.524 1.43 L*D 4 3.484 3.484 3.484 0.61 0.665 0.846 Error 8 11.356 11.356 11.356 8.155 Total 26 243.70 243.70 The least sliding wear rate is recorded, during 10 th test run, when the process parameters were at 2 nd level of Sliding speed and first level of load and sliding distance. The second quality characteristic under study; frictional force is minimum, when the process parameters are at 3 rd level of sliding speed and first level of load and sliding distance during the 19 th test run. Hence, the optimum combinations of the factors levels have not been identical for the two performance characteristics. Achieving both the optimum criteria simultaneously is impossible. Hence, a suitable trade off between the two becomes inevitable. Here, Harrington’s desirability function method [22, 23] has been adopted for multi response optimization. The response variable Y i can be transformed to a desirability value h i with the help of the desirability function. Harrington’s had developed a functional approach using desirability function to optimize the multi response situation. The one sided transformation as proposed by Harrington can be represented as h i = exp [-exp (-Y i ) ] -------(2) Individual desirability of all the responses can be combined to get a Single value of desirability by the expression ……. (3) Table 5 shows the optimum levels of responses. For Harrington desirability function, the composite desirability H for two responses has been computed for both the settings and then large of these has been identified as the optimum operating combination of the levels. The composite desirability for the settings has been obtained as shown in the Table6, from which it has been obvious that the setting S2, L1 and D1 has been found to be the optimal setting for optimizing the tribological properties.  1186 Hemanth Kumar.T.R. et al Vol.10, No.12 Table 5. Concurrent optimization of multiple factors Optimal levels S L D Sliding wear rate Individual Desirability (h 1 ) Frictional force Individual Desirability (h 2 ) Combined Desirability (H) 2.09 19.6 600 19.0 0.999 8.3 0.999 0.999 3.056 19.6 600 23.0 1 5.3 0.995 0.997 3.4 Confirmation Experiment The confirmation experiment is conducted to verify that, the optimal setting factors derived previously will actually yield an improvement in quality characteristic under study and how close are the respective predictions with the real ones. However, if the observed S/N ratios under the optimum conditions differ drastically from their respective predictions, the additive model fails to be a failure eventually. Table 6 shows the comparison of the predicted wear rate and frictional force with the actual response of the quality characteristic under study. Deviation finds to be less from the predicted values. The error is calculated as the difference between actual and predicted values of S/N ratio. Table 6 Verification of test result 4. CONCLUSIONS • Dry sliding wear and frictional force of the composite material under different loads and Sliding velocities can be successfully analyzed using Taguchi design of experiment • The analysis of variance for Sliding wear rate of the composite material shows that, that distance traveled by the specimen is the most significant factor, whereas load and sliding speed has little contribution towards the Quality characteristic under study. • The analysis of variance for Frictional force of the composite material shows that, load is the most significant factor which induces the frictional force, whereas sliding speed and distance has least contribution towards frictional force induced by the test specimen. Sliding Wear rate Frictional force Predicted optimum Actual optimum Predicted optimum Actual optimum Parameters Level S: 3.056, l: 19.6, D: 600 S: 3.056, l: 19.6, D: 600 Parameters Level S: 3.056, l: 19.6, D: 600 S: 3.056, l: 19.6, D: 600 Wear rate 23.0 22.0 Frictional force 5.3 5.4 S/N ratio -27.2346 -26.8485 S/N ratio -14.4855 -14.6475 Predicted error of S/N ratio (db) 0.386103 Predicted error 0.16235 Confidential limit (2σ) 0.546 Confidential limit (2σ) 0.427  Vol.10, No.12 Taguchi Technique 1187 • Taguchi Design of experiment is extended further for the simultaneous optimization of wear parameters using Harrington’s desirability method. Using Harrington’s desirability method optimum condition is found and confirmation experiment was conducted to show that additive models are correct. This method can be adopted for the simultaneous optimization of Tribological parameters, where both the quality characteristic is important for the end– product which increases the performance of the product. REFERENCES 1. Mingzhao Tan, Qibin Xin, Zhenghua Li, B. Zong, Y. Influence of SiC and Al2O3 particulate reinforcements and heat treatments on mechanical properties and damage evolution of Al-2618 metal matrix composites. Journal of Materials science 36 (2001) 2045 -2053. 2. Nitsham. .A. E. New application for Aluminum based metal matrix composites. 1997. Vol. 54. Light metal age. USA. 3. Debdas Roy. Bikramjit Basu. Amitava Basu Mallick. Tribological properties of Ti- aluminide reinforced Al-based In- Situ –metal matrix composite. Intermetallics 13 (2005) 733 – 740. 4. A. P. Sannino, H.J. Rack.. Dry sliding wear of discontinuously reinforced aluminum composites: review and discussion. Wear 189 (1995) 1-19. 5. R.N. Rao. S.Das and P.V. Krishna. Experimental investigation on the influence of SiC particulate reinforcement in Al alloy composites. 6. Prasanna Kumar.M. Sadashivappa.K. Prabhukumar.G.P. and Basavarajappa.S. Dry sliding wear behavior of Garnet reinforced metal matrix composite. Materials science. Vol.12. No.3. 2006. PP. 209 -213. 7. G.Ranganath. S.C. Sharma and M. Krishna. Dry sliding wear of Garnet reinforced Zink / Al MMCs. Wear. 251 (2001) 1408 – 1413. 8. S.C. Sharma. M.Krishna. P.V.Vizhian and A.Shashishankar. Thermal effects on Mild wear behavior of al 7075-glass fiber reinforced composite. Vol.216. No.12/2002. PP. 975-982. 9. Ramachandra M, Radhakrisna. Sliding wear, slurry erosive wear and corrosive wear of Al /SiC composites.Material science. Vol. 24. No. 2/1.2006. 10. G.Ranganath. S.C. Sharma and M. Krishna. Dry sliding wear of Garnet reinforced Zink / Al MMCs. Wear. 251 (2001) 1408 – 1413 11. Wilson S, alpas. A.T. Wear mechanism map for metal matrix composites. Wear. 1997; 212: 41-49. 12. S. Basavarajappa. G. Chandramohan. R. Subramanian. Chandrasekar. Dry sliding wear behavior of Al 2219 / SiC metal matrix composites. Materials science Poland. Vol. 24. No. 2 /1. 2006. 13. R.L. Deuis. C. Subrananian and J. M. Yellup. Abrasive wear of Aluminum composites. A review. Wear. 201. (1996) 132 – 144. 14. R.K. Uyyuru, M.K. Surappa. S. Brusethaug. Effect of reinforcement Vol fraction and size distribution on the tribological behavior of Al - composite. Wear. 260 (2006) 1248 – 1255. 15. A Martin, J Rodriguez, J. Lorea. Temperature effects on the wear behavior of particulate reinforced Al-based composites. Wear. 255-229 (1999) 615-620. 16. J.M Gomez de, Salazar, M.I. Barrena. Influence of heat treatments on the wear behavior of an AA 6092 / SiC composites. Wear. 256 (2004) 286 -293.  1188 Hemanth Kumar.T.R. et al Vol.10, No.12 17. J Guo, X Yuan. The aging behavior of SiC /Gr/6013 Al composites in T-4 –T-6 treatments. 18. Grigoris E. Kiourtsidis, stefanos M. Skolianos. Wear behavior of artificially aged AA2024 /SiC composites in comparison with conventionally wear resistance ferrous materials. Wear. 253 (2002) 946 -956. 19. Phillip. J. Ross. Taguchi techniques for quality engineering. Mc. Graw hill, New York. 1-179. (2005) 20. J.H. Hatch (ed), Aluminum: properties and physical metallurgy, ASM, Metals park, OH, (1988), 371. 21. James C. Williams. Progress in structural materials for Aerospace systems. Acta materials. 51 (2003) 5775 – 5799. 22. Gaitonde v.n, Achyutha.B.T, Siddeshwarappa.B. Burr size minimization in drilling using taguchi technique. Indian Journal of engineering & Materials. Vol. 12. April 2005. PP. 91-96. 23. Derringer G & Suich R. Simultaneous optimization of several response variables. Journal of quality technology. 12 (1980) 214 -219. |