Paper Menu >>
Journal Menu >>
 Journal of Minerals & Materials Characterization & Engineering, Vol. 10, No.12, pp.1111-1130, 2011 jmmce.org Printed in the USA. All rights reserved 1111 Development and Calibration of a Quantitative, Automated Mineralogical Assessment Method Based on SEM-EDS and Image Analysis: Application for Fine Tailings R. Mermillod-Blondin 1,2 *, M. Benzaazoua 1 , M. Kongolo 3 , P. de Donato 3 , B. Bussière 1 , P. Marion 3 1 NSERC Industrial Polytechnique-UQAT Chair, 445, boul. de l’Université, Rouyn-Noranda (Qc), Canada, J9X 5E4. 2 Present address: Agnico-Eagle Mines, 20 route 395, Cadillac (Qc), Canada, J0Y 1C0 3 LEM, UMR 7569 CNRS INPL, Pôle de l'Eau, 15 avenue du Charmois - BP 40, 54501 Vandoeuvre-lès-Nancy Cedex, France. *Corresponding Author: raphael.mermillod-blondin@agnico-eagle.com ABSTRACT Quantitative mineralogy has seen significant developments from the combination of scanning electron microscopy (SEM) with automatic image analysis and energy dispersive X-ray spectrometry (EDS). The mining industry is one of the fields that has benefited from this progress. In this paper, the authors present a newly developed quantitative method based on SEM-EDS and image analysis (IA), which is used to determine the mineralogical and environmental characteristics of mine tailings. The main objectives of the method are to be able to characterize sulphides and carbonates as monomineral particles, which control the acid generation from the tailings. Pure sulphides, calcite and quartz were blended to make mineralogical standards that represent typical mine tailings environmental behavior. The SEM-EDS-IA method achieved good mineralogical precision for medium (1-20 Wt%) and abundant (> 20 Wt%) minerals, with a relative error below 10 %. However, some corrections had to be applied to account for typical stereological effects (apparent particle diameter from polished surface) and preparation modes (particle segregation during resin hardening). Particle size analysis was used to calibrate the method and identify the corrections to be applied. Since mineralogical quantifications are based on the area of the observed particles, the most reliable particle size analyses (also obtained from particle area) typically lead to the best mineralogical characterization. However, the SEM based techniques may show some limitations for fine-grained particle quantification (< 10 µm), which required additional corrections. In this article, the technique is described, and it is applied to characterize fine-grained mine tailings with a size-by-size mineralogy (with  R. Mermillod-Blondin, M. Benzaazoua, M. Kongolo, et al. Vol.10, No.12 1112 sulphides and carbonates content). These results have been used by the Authors to propose an environmental management strategy for acid generating tailings using desulphurization by flotation. Keywords: Automated mineralogy; Stereological corrections; Mineralogy calibration; Acid mine drainage 1. INTRODUCTION Quantitative mineralogy of mine tailings is an essential component of any solution to deal with the problem of acid mine drainage (AMD). However, predictive models require the quantification of the reactive sulphides and the neutralizing minerals [1,2,3,4]. The size-by- size mineralogy gives the kinetics dimension of the acid generation and neutralization reactions [5]. While this information is not provided by traditional techniques such as X-ray diffraction or chemical analyses, scanning electron microscope (SEM) based automated imaging systems are among the most efficient ways to obtain this type of data [6,7]. Various research groups have developed their own methods for automated mineralogy using SEM and image analysis [8,9,10]. Most of these techniques are based on image analysis tools developed in Canada by CANMET [11,12]. These techniques process backscattered electron (BSE) images and include energy dispersive spectrometry (EDS) to refine the analysis [12,13]. Mineral liberation information [13,14] and stereographical corrections [15,16] are also applied. The most widely used commercial technique is the Mineral Liberation Analyzer (MLA) developed by the JKTech laboratory [10,17,18]. The CSIRO laboratory has developed another technique, based on X-ray spectrometry, which has led to QemSCAN technology [19]. In this case, the BSE image is mainly used as a pretreatment to locate particles. The electron beam then scans each particle to map the X-ray emissions in order to identify mineral phases with a specific pixel resolution (that varies in size depending on the magnification). The QemSCAN has now been used in various ore characterization and mineral process optimization studies [20,21,22]. In this paper, the authors present a method for mineralogical characterization and mineral quantification using a SEM-EDS-image analysis system (SEM-EDS-IA). The method, which is applied here to mine tailings, is based on the CANMET approach. This paper presents the testing techniques and data processing tools developed to transform the SEM-EDS-IA data into mineralogical information. Three standards, made from pure minerals, were used to calibrate the method. The data processing tools were then applied to characterize existing tailings from a hard rock mine.  Vol.10, No.12 Development and Calibration of a Quantitative, Automated Mineralogical Assessment 1113 2. MATERIAL AND METHODS 2.1. Mineral Samples and Mine Tailings Pure minerals samples were selected to prepare the standard blends, which served to calibrate the proposed technique. Three main sulphide minerals and two gangue phases were chosen: pyrite from Huanzala, Peru; sphalerite from Matagami, Canada; chalcopyrite from Huelav, Spain; calcite from Mistassini, Canada; quartz from St Bruno de Guigues, Canada. Pure minerals were collection samples from Minérobec, Quebec, Canada. The pure mineral samples were ground and sieved at 106 µm to remove large particles. Three standard blends (A, B and C) were prepared to simulate the mineral diversity of mine tailings. The reference mineralogy was calculated by weight proportion based on the pure mineral content in each blend, taking into account the minor impurities in each mineral sample. In these samples pyrite was the main reactive sulphide mineral and calcite was the main acid neutralizing mineral. The three blends were made to obtain acid generating materials, i.e. acid potential (AP) superior to neutralization potential (NP) or net neutralization potential (NNP) inferior to -20 kg CaCO 3 /t (NNP = NP-AP). The AP and NP are defined as follow: AP = Pyrite content(%) * 0.535 * 31.25, and NP = Calcite or Dolomite content(%) * 10. AP and NP are both expressed in kg CaCO 3 /t. The acid-generating tailings selected for this work were sampled at the mill of the Louvicourt mine, Abitibi-Témiscamingue, Québec, Canada (closed in 2005), which processed a Cu-Zn sulphide rich ore. Details on sampling and characteristics (particle size distribution, chemical analyses, X-ray diffraction analysis) of these mine tailings have been presented elsewhere [23]. 2.2. Particle Size Distribution A Mastersizer S instrument from Malvern using the laser diffraction principle was used to determine the particle size distribution of the materials. Kelly et al. [24] have recently shown that particle size distributions obtained via image analysis and laser diffraction techniques are usually similar. 2.3. Equipment Used for Mineralogical Characterization with SEM-EDS-IA The samples were mounted into epoxy resin and with the hardener Epoxycure ® from Buehler Canada. The SEM is a Variable Pressure Vacuum S-3500N from Hitachi, coupled with a Link ISIS series 300 EDS System from Oxford Instruments. A tungsten hairpin-shaped filament was used under the following conditions: 20 kV for voltage, about 110 µA for current intensity, with a low vacuum pressure of 25 Pa. This type of SEM does not need a conductive coating onto the polished sections. The working distance was fixed at 15 mm, the optimum for EDS analysis. The SEM is equipped with a Robinson scintillator BSE detector and a motor driven sample stage for X and Y axes. The X-ray detector is made of Si(Li), and is settled with an X-ray take-off angle of 35°. The elemental compositions were quantified 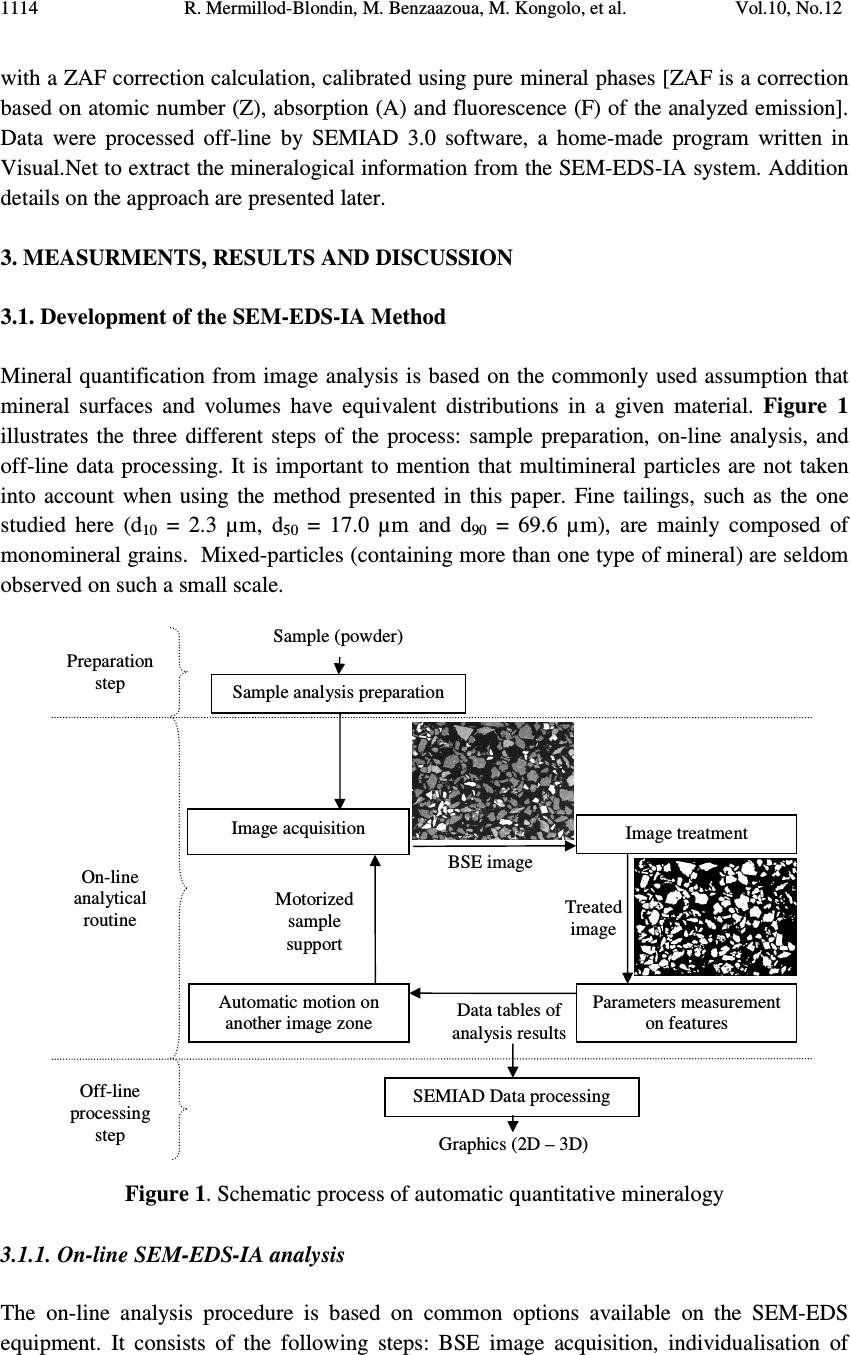 R. Mermillod-Blondin, M. Benzaazoua, M. Kongolo, et al. Vol.10, No.12 1114 with a ZAF correction calculation, calibrated using pure mineral phases [ZAF is a correction based on atomic number (Z), absorption (A) and fluorescence (F) of the analyzed emission]. Data were processed off-line by SEMIAD 3.0 software, a home-made program written in Visual.Net to extract the mineralogical information from the SEM-EDS-IA system. Addition details on the approach are presented later. 3. MEASURMENTS, RESULTS AND DISCUSSION 3.1. Development of the SEM-EDS-IA Method Mineral quantification from image analysis is based on the commonly used assumption that mineral surfaces and volumes have equivalent distributions in a given material. Figure 1 illustrates the three different steps of the process: sample preparation, on-line analysis, and off-line data processing. It is important to mention that multimineral particles are not taken into account when using the method presented in this paper. Fine tailings, such as the one studied here (d 10 = 2.3 µm, d 50 = 17.0 µm and d 90 = 69.6 µm), are mainly composed of monomineral grains. Mixed-particles (containing more than one type of mineral) are seldom observed on such a small scale. Figure 1. Schematic process of automatic quantitative mineralogy 3.1.1. On-line SEM-EDS-IA analysis The on-line analysis procedure is based on common options available on the SEM-EDS equipment. It consists of the following steps: BSE image acquisition, individualisation of Sample analysis preparation SEMIAD Data processing Sample (powder) Graphics (2D – 3D) Image acquisition Image treatment Parameters measurement on features Automatic motion on another image zone Motorized sample support Data tables of analysis results Preparation step On-line analytical routine Off - line processing step BSE image Treated image  Vol.10, No.12 Development and Calibration of a Quantitative, Automated Mineralogical Assessment 1115 each particle by image processing, and measurement of morphological and chemical properties for each feature. The process is repeated, after a small sample displacement, for other areas as illustrated in Figure 1. The brightness, the contrast and the focus of the BSE images are optimized to maximize the difference between particles and resin, as well as between adjacent grains. Magnification is selected to maximize the scope of the analysis, based on the particle size distribution of the sample. During analysis the magnification is selected to obtain a probability of analysis of the coarser particles higher than 50 % (the probability of analysis will be defined further below, see equation 3). The analyzed zone is composed of a grid of 20 images per polished section, typically containing approximately 10,000 particles. The resolution of each image is 512×368 pixels. Image processing generates the individualization of the particles. The different grey levels of the BSE image are used as thresholds to isolate the particles. Three grey levels are applied to individualize sulphides and heavy metal oxides (white, or pale grey), silicate and carbonate minerals (grey) and resin (black, or dark grey). Four mathematical operations are then used to clean the binary image obtained from the initial individualization: erode, dilate, open/reconstruct/border_kill and hole_fill (see [12] for details). The main morphological parameter determined is the area(s) of the targeted feature(s); other parameters, such as perimeter, shape, Feret diameter at 0 and at 90 degree are also available (but will not be discussed here). The chemical compositions are obtained for the elements of interest: O, Na, Mg, Al, Si, S, K, Ca, Fe, Co, Ni, Cu, Zn. 3.1.2. Off-line data processing of the SEM-EDS-IA analyses The authors have developed software, called SEMIAD, to process the data obtained from the SEM-EDS-IA step and convert the morphological and chemical data of each particle into various mineralogical information, i.e. mineral identification, particle diameter, specific surface and stoichiometric composition (for selected minerals). The software builds two-by- two combinations of mineralogical parameters in order to obtain size-by-size mineralogy, and size-by-size stoichiometric composition for specified minerals or the specific surface of selected minerals. Mineral identification and particle size calculation are the parameters discussed in this paper. Mineral identification is based on the elemental analysis performed on each particle (with the probe positioned at the grain barycentre). The elemental composition is then compared with the composition of known minerals from a database of more than 4,300 minerals referenced from the web site webmineral.com [25]. The database can also be adapted to take into account minerals believed to be present and continuous mineral series. The identification begins with the calculation of the difference between the composition of the unknown particle and the composition of each referenced mineral from the database. Figure 2  R. Mermillod-Blondin, M. Benzaazoua, M. Kongolo, et al. Vol.10, No.12 1116 illustrates the process of mineral identification in the simple case of pyrite-pyrrothite discrimination via S and Fe analyses. Figure 2.Mineral identification principle in a two-dimensional elementary space for S and Fe The expression of the difference d X-Min is similar to the Euclidian distance between two points in the space: ( ) 2 ∑ −= − i Min i X iMinX EEd (1) Where, d X-Min is the difference between the unidentified particle (X) and the reference mineral (Min) expressed in wt% E iX and E iMin is the composition of the element E i in the particle X and the reference mineral Min respectively, also expressed in wt%. The difference d X-Min is calculated via a summation for each element i that composes the reference mineral. The lowest difference leads to the mineral identification (i.e. pyrite in the illustration example Figure 2). Particle size is calculated from the morphological parameters. Various models can be applied to determine the diameter from perimeter or area measurements [7,12,26]. Since the reference for particle size distribution determination is the laser diffraction measurement, the same particle model is used: circular equivalent diameter d p : π p p A d4 = (2) Where, d p is the diameter of particle p (µm) A p is the area of particle p (µm 2 ). Typical tailing particles are generally more angular than spherical. This particle model assumption may be taken as a first simplification of the methodology. S d X - Py d X - Po Fe Po Fe Py S Py S Po S X Fe X Fe  Vol.10, No.12 Development and Calibration of a Quantitative, Automated Mineralogical Assessment 1117 However, the results of particle analysis that can be obtained from IA on polished sections need some corrections due to preparation methodology and stereological effects. This paper details the corrections proposed in SEMIAD for the preparation methods used by the authors. The first correction concerns the image sampling effect that is linked to the image treatment process. The sub-routine border_kill erases the particles that touch the image border (see the images in Figure 1). Therefore, the larger the particle the higher the probability it touches the border and is erased. This correction is adapted from the correction of Miles-Lantuéjoul [27,28]. A probability of analysis P a depending on the particle diameter d can be defined: i i i aA dd r A rA P −+ −= 1 (3) Where P a is the probability of analysis A i is the area of the image, which depends on magnification (µm 2 ) r is the proportion of the image (length/width ratio) d is the diameter of the particle (assimilated to a sphere) expressed in µm. It is possible to correct the number of particles included in the sample by applying the probability P a to each size class of a size-by-size mineralogy enumeration. The two remaining corrections deal with differential sedimentation rates in epoxy resin. During the hardening of the epoxy resin, the particles can segregate in the epoxy-hardener mix depending on their size and specific gravity and some may accumulate at the bottom of the section, which is the analysis surface. Figure 3-A confirms this sedimentation phenomenon during resin hardening via optical microscopy observations on a transversal section of a polished section of pyrite powder. Figure 3-B presents the quantification of the surface coverage of particles, which confirms the accumulation at the bottom of the section profile. Figure 3-C also confirms the particle size variation across the polished section. The percentiles d 10 , d 50 and d 90 increased from top to bottom of the section. Stokes’ equation can be applied to model particle sedimentation within the epoxy resin. During hardening, the resin-powder system can be considered as a non turbulent flow. Indeed, the mineral particles are bigger than the resin molecules. Moreover, the particle interactions are assumed negligible and the particles are assumed to be spheres. The dynamic viscosity of the epoxy resin is unknown and increases with the hardening process. Therefore, only the relative motion of the particles between each other can be obtained, and this motion is a function of the squared diameter and the density of the particles: g d rps )( 18 2 ρρ η ω −= (4) Where ω s is the velocity of the particle (cm/s)  R. Mermillod-Blondin, M. Benzaazoua, M. Kongolo, et al. Vol.10, No.12 1118 d is the particle diameter (cm) η is the resin viscosity (Pa.s) ρ p is the particle density (g/cm 3 ) ρ r is the resin density (1.2 g/cm 3 ) g is the acceleration due to gravity (cm/s 2 ). Figure 3 . Evidence of sedimentation process during epoxy hardening by optical microscope observation of a pyrite powder polished section (A), showing the mineral surface coverage (B) and the different percentiles at 10, 50 and 90 vol% (C) It is also assumed that the analysed surface is representative of particle accumulation by sedimentation because the rough polishing is generally stopped when particles appear. Therefore, the observation of the polished surface should contain more coarse particles than the initial sample. This relative enrichment is proportional to the square of the diameter and can be corrected by dividing the proportion of each size class by the square of its representative diameter, which in this case is the upper limit of the size class. Similarly to the size correction for differential sedimentation, Stokes’ equation models the density segregation for a given particle size. The mineral density data was obtained from the website webmineral.com [25]. According to Stokes’ equation, a linear relation links the accumulation process to the difference between the particle and the resin densities. It is possible to correct the amount of analysed particles according to the density of each identified mineral for a given size class. The last correction for bulk section analysis is based on the correction of Exner and Giess [29]. In a population of similar spherical grains, the surface resulting from polishing creates 200 µm 1 mm Optical microscope photography A) C) Top of the section Bottom of the section 010 20 Surface occupation (%) Surface coverage of the particles (%) 0 10 20 B) d 10 d 50 d 90 050100 150 200 Particle size (µm)  Vol.10, No.12 Development and Calibration of a Quantitative, Automated Mineralogical Assessment 1119 apparent diameters, equal to or smaller than the real diameter of the grains. This stereological effect is widely referred to in the literature [30,31]. It is possible to statistically model the distribution of the apparent diameters, assuming that the position of the polishing plane within a particle follows a uniform probability. This correction is known to be shape dependent [15,31,32], however in this first version of SEMIAD, the particles were assumed to be spheres. The apparent diameter distribution is expressed by the probability that an apparent diameter belongs to the size class ]B - ;B + ]: ( ) 22 11 −− −=≤< +− +− D B D B BdBP (5) Where, P(B - <d ≤ B + ) is the probability that the apparent diameter is included in the size class ]B - ;B + ] ( µ m) D is the real diameter of the homogeneous particle population ( µ m) B - and B + are respectively the lower and upper diameters of the size class (µm). Assuming that the largest diameter analysed by the SEM-EDS-IA system is the biggest particle in the sample, it is possible to calculate and remove the fine-particle pollution by generating a target size class using the probability defined in equation 5. Finally, the SEMIAD process associates a curve fitting application based on the Rosin- Rammler model to smooth the cumulative particle size distribution [33,34]: 100 * exp1% × −−= S volcum d d (6) Where, % volcum is the cumulative volume proportion of the particles smaller than size d d* is the diameter for the percentile under 63.2 vol%, which is a reference parameter of the model exponent S is the dispersion constant. The value of the two model parameters (d* and S) are obtained from a mathematical regression on the experimental data. 3.2. Calibration of the SEM-EDS-IA Method with Standard Blends Two correction packages are presented in this paper: SEMIAD PA-MS-PS and SEMIAD PA- PSS-MS-PS where PA corresponds to the correction according to the probability of analysis (equation 3), PSS is the particle size sedimentation correction (equation 4), MS is the mineralogical segregation occurring during epoxy hardening (equation 4) and PS is the sectioning effect during polishing (equation 5). All standard blends are analysed at 100x magnification.  R. Mermillod-Blondin, M. Benzaazoua, M. Kongolo, et al. Vol.10, No.12 1120 TABLE 1 presents the mineralogical compositions obtained by SEMIAD analyses with the two correction packages. TABLE 1: Mineralogical composition of the three standard blends by SEMIAD analyses A) Standard blend A Mineral (wt%) Reference mineralogy SEMIAD : PA-MS-PS SEMIAD : PA-PSS-MS-PS Pyrite 20.2 19.2 15.8 Sphalerite 1.0 0.8 0.9 Chalcopyrite 0.5 0.1 0.2 Calcite 5.0 4.6 5.2 Quartz 73.3 75.3 77.9 Total 100.0 100.0 100.0 AP (kg CaCO 3 /t) 338 321 264 NP (kg CaCO 3 /t) 50 46 52 NNP (kg CaCO 3 /t) -288 -275 -212 B) Standard blend B Mineral (wt%) Reference mineralogy SEMIAD : PA-MS-PS SEMIAD : PA-PSS-MS- PS Pyrite 15.1 14.1 11.6 Sphalerite 0.4 0.5 0.4 Chalcopyrite 0.9 0.6 0.5 Calcite 4.0 3.9 4.4 Quartz 79.6 80.9 83.1 Total 100.0 100.0 100.0 AP (kg CaCO 3 /t) 252 236 194 NP (kg CaCO 3 /t) 40 39 44 NNP (kg CaCO 3 /t) -212 -197 -150 C) Standard blend C Mineral (wt%) Reference mineralogy SEMIAD : PA-MS-PS SEMIAD : PA-PSS-MS-PS Pyrite 5.3 5.9 3.9 Sphalerite 0.6 0.9 0.6 Chalcopyrite 0.6 0.3 0.4 Calcite 3.0 2.0 2.5 Quartz 90.5 90.9 92.6 Total 100.0 100.0 100.0 AP (kg CaCO 3 /t) 89 99 65 NP (kg CaCO 3 /t) 30 20 25 NNP (kg CaCO 3 /t) -59 -79 -40  Vol.10, No.12 Development and Calibration of a Quantitative, Automated Mineralogical Assessment 1121 Figure 4 illustrates the relative error variation versus the real mineral content, calculated from the mineralogy presented in TABLE 1 . TABLE 1 and Figure 4 show that the higher the mineral content the more precise the SEMIAD analysis. Analyses using the three corrections showed a relatively good correlation for the major phases (20-100 wt%), i.e. pyrite and quartz in Table 1, with a relative error between 1 to 5 % ( Figure 4 ). Precision also increased for less abundant phases (1-20 %) when the three-correction analysis was used with a relative error close to 10 % ( Figure 4 ). The relative error for the four-correction analysis was higher than the three-correction analysis for the major and minor phases, with a relative error between 2 and 20 % ( Figure 4 ). However, the accessory phases (0.1-1 wt%) were better analysed with the four-correction analysis method with a relative error up to 10 % versus 40 to 80 % relative error with the three-correction analysis ( Figure 4 ). Figure 4: Relative error vs. proportion of the target mineral by SEMIAD with the three- correction package (square) and the four-correction package (triangle) for the three standard blends A, B and C Since the method is based on image analysis where the mineral quantification is based on the mineral size, it is crucial to quantify a correct size distribution of the particles. Figure 5 presents the particle size distributions obtained with the SEMIAD method of the bulk sample and each mineral phase for the standard blend A. The three-correction analysis (PA-MS-PS) showed a particle size distribution more representative of the main particle size than the one from the four-correction analysis (PA-PSS-MS-PS). This is illustrated in Figures 5-A, C, D, E, F, and G where the intervals of the size classes 40-200 µm analysed with the SEMIAD PA-MS-PS correspond to those obtained with laser diffraction measurement, whereas the particle size distributions of the SEMIAD PA-PSS-MS-PS analysis presented a shift toward the fine fraction (10 to 100 µm). The weak mineral estimation obtained with the four- correction analysis ( TABLE 1 ) could be due to the problem of non representative particle size. The correction PSS for particle size sedimentation within the polished section has led to a distortion of the mineralogical proportions by overestimating the fine fraction. The PSS correction assumes a differentiation of the particles due to their size when falling during 0.1 1.0 10.0 100. 0 0204060 80100 Proportion of the target mineral (wt%) Relative error (%) SEMIAD PA-MS-PS SEMIAD PA-PSS-MS-PS  R. Mermillod-Blondin, M. Benzaazoua, M. Kongolo, et al. Vol.10, No.12 1122 epoxy hardening. The coarse particle size (above 60 µm) might have a sedimentation speed sufficient to led to a representative surface after polishing regarding the mineralogical characterization, because the size class above 60 µm represents more than half of the standard blend ( Figure 5-B ). Analysis of the major particle size fraction ( Figure 5-A ) led to the best mineralogical representation ( TABLE 1 ). Therefore, the PSS correction was not required in this case due to the coarse particle size distribution. Since the environmental parameters AP, NP and NNP are directly linked to the mineral content by calculation as presented in part 2.1, the best mineral quantification led to the closest estimation of the environmental behaviour of the blends. The three-correction package is therefore advised for environmental characterization in this case. Concerning the accessory phases like sphalerite, the standard blend A showed a more accurate quantification with the four correction routine ( TABLE 1 ). The particle size distribution ( Figure 5-D ) shows both of the corrections shift emphasis to the fine fraction and consequently misses the main sphalerite size classes. However, the PSS correction increased the fine particle representation and led to an increase in quantification compared to the three- correction analysis (Table 1). The statistics generated by this type of analysis are very important. The number of analysed particles should be very high in order to obtain a low relative error for low grade minerals. Jones (1987) has proposed that with a 1 % mineral proportion 160,000 particles should be analysed to obtain a relative error of 5 %. Figure 5 shows the low representation of a narrow range of coarse particles (approximately 150 to 250 µm) ( Figure 5 -A, C, D, E, F and G). The 100x magnification of the overall imaging was chosen according to a probability of analysis superior to 50 % for the coarser particles (using 250 µm in equation 3). The absence of this coarse fraction (150-250 µm) in the particle size distribution ( Figure 5 ) indicates that the probability of large grain analysis that controls the magnification selection (and consequently image size; equation 3) should be higher than the arbitrarily 50 % used in this study. A more appropriate value may be 75 %, with an observed diameter equal to 150 µm. Whichever SEMIAD analysis correction package is used, the finest particles of the standard blend were not accurately analysed. At 100x magnification (resolution of 512×368 pixels), the smallest particle observed was 9 µm. This diameter limit corresponds to the diameter of a nine-pixel particle area taking into account the erosion and dilated routines described above. This detection limit at 9 µm explains the weak accuracy of SEMIAD analyses below this size. Figure 5 -B shows that the fraction below 9 µm corresponds to approximately 15 vol% of the sample according to the laser diffraction analysis. This fine fraction could be obtained by increasing the magnification. Therefore, the analysis may require two different magnifications to cover the whole particle size distribution: magnification inferior to 100x to analyse the particles coarser than 150 µm, and a magnification superior to 100x to analyse the particles finer than 9 µm. The two magnifications could be combined during off-line data processing, which will be described below.  Vol.10, No.12 Development and Calibration of a Quantitative, Automated Mineralogical Assessment 1123 Figure 5: Particle size distribution of the bulk and mineral phases of the standard blend A by SEMIAD and laser diffraction: bulk standard blend A (A and B), pyrite (C), sphalerite (D), chalcopyrite (E), calcite (F), and quartz (G) 3.3 Louvicourt Mine Tailings Analysis The SEMIAD analysis of the Louvicourt tailings was performed at two levels of magnification (100x and 3000x). The two data sets from the two different magnifications were merged at 9 µm; above 9 µm the data set from the 100x magnification was used and below 9 µm the 3000x magnification was used. The proportions of the laser particle size 0 5 10 15 20 0.1110100 1000 Particle size (µm) Volumic proportion (%vol) SEMIAD PA-MS-PS SEMIAD PA-PSS-MS-PS StdBld A by laser diffraction 0 10 20 30 40 50 60 70 80 90 100 0.1110100 1000 Particle size (µm) Cumulative volumic proportion (%vol) SEMIAD PA-MS-PS SEMIAD PA-PSS-MS-PS StdBld A by laser diffraction A) B) 0 5 10 15 20 0.1110100 1000 Particle size (µm) Volumic proportion (%vol) SEMIAD PA-MS-PS SEMIAD PA-PSS-MS-PS PyStd by laser diffraction 0 5 10 15 20 25 0.1110100 1000 Particle size (µm) Volumic proportion (%vol) SEMIAD PA-MS-PS SEMIAD PA-PSS-MS-PS SphStd by laser diffraction 0 5 10 15 20 0.1110100 1000 Particle size (µm) Volumic proportion (%vol) SEMIAD PA-MS-PS SEMIAD PA-PSS-MS-PS CpStd by laser diffraction C) D) E) F) G) 0 5 10 15 20 0.1110100 1000 Particle size (µm) Volumic proportion (%vol) SEMIAD PA-MS-PS SEMIAD PA-PSS-MS-PS CalStd by laser diffraction 0 5 10 15 20 0.1110100 1000 Particle size (µm) Volumic proportion (%vol) SEMIAD PA-MS-PS SEMIAD PA-PSS-MS-PS QtzStd by laser diffraction  R. Mermillod-Blondin, M. Benzaazoua, M. Kongolo, et al. Vol.10, No.12 1124 distribution were used to merge the two data sets (32 % of the 3,000x fraction and 68 % of the 100x fraction). TABLE 2 presents the mineralogical compositions of the Louvicourt tailings obtained using the SEM-EDS-IA method using both of the correction packages previously described, as well as a reference mineralogy obtained by a multidisciplinary method [35]. The analyses gave very different compositions. Table 2 shows that the pyrite assay varied between 8 to 14 wt% depending on the correction method. The estimated pyrite content is lower in the case of the three-correction analysis. Pyrite seems underestimated in both correction packages in comparison to the reference mineralogy at 23.6 wt%. As regards to gangue minerals, the chlorite, muscovite and dolomite compositions were relatively close to the reference material at 25, 2 and 2 wt% respectively ( TABLE 2 ). Dolomite content is slightly lower around 2 wt% versus the reference value at 5 wt% ( TABLE 2 ). The estimated quartz and albite content was high using the three-correction analysis (respectively 51.2 and 10.8 wt%, in comparison to 32.5 and 5.6 wt% for the four-correction analysis). This last proportion appears to be closest to the reference mineralogy. Table 2 shows that siderite was quantified at higher amounts with the four-correction analysis than with the three-correction analysis (10.6 wt% vs. 1.4 wt%). The difference between mineral contents may be explained by difference in grain observation/counting. The particle size distribution described further will discuss this point. Moreover, the spherical particle model may also lead to difference in mineral quantification. The particle shape effect and variation depending on the mineral type would have to be investigated on standard material. TABLE 2: Mineralogy of the Louvicourt mine tailing with the SEM-EDS-IA method Mineral (%wt) SEMIAD: PA-MS-PS SEMIAD: PA-PSS-MS-PS Multidisciplinary reference mineralogy* Pyrite 7.8 13.8 23.6 Sphalerite 0.1 0.2 0.3 Chalcopyrite 0.0 0.1 0.2 Quartz 51.2 38.5 26.4 Chlorite 25.5 22.7 19.6 Muscovite 1.3 2.9 2.5 Albite 10.8 5.6 8.3 Dolomite 1.9 2.7 5.1 Siderite 1.4 12.0 10.4 Apatite 0.0 0.0 3.7 Total 100.0 100.0 100.0 AP (kg CaCO 3 /t) 130 231 394 NP (kg CaCO 3 /t) 19 27 55 NNP (kg CaCO 3 /t) -111 -204 -339 * See Mermillod-Blondin, 2006  Vol.10, No.12 Development and Calibration of a Quantitative, Automated Mineralogical Assessment 1125 Figure 6 shows the particle size distributions obtained by SEMIAD analyses and by laser diffraction. The SEMIAD analysis with the three-correction routine clearly shows the absence of the fine fraction below 20 µm. The four-correction analysis gives a particle size distribution close to that of the laser diffraction analysis. In this last case, it can be observed that the coarse particles (50-200 µm) were slightly overestimated, while the fine fractions (2- 30 µm) were underestimated. As better particle size quantification results in better mineralogical analysis, the four-correction package was the most accurate analysis. The relatively fine particle size distribution (mainly between 10-50 µm according to the laser diffraction analysis in Figure 6 ) could have led to a significant particle segregation during the epoxy hardening, as previously explained, therefore the analysis of the mine tailings required the PSS correction. The low observation of 10 µm particles may be linked with some preparation challenges or SEM magnification selection as mentioned previously. This may also affect mineral quantification since the various mineral types have generally various particle size distributions. In the case of Louvicourt tailings, the mineral mainly at 10 µm will be underestimated. Figure 6: Particle size distributions (histogram: A, and cumulative: B) of the mine tailings by SEMIAD with the two types of corrections and by laser diffraction Figure 7 presents the main strength of the method: the size-by-size mineralogical distribution of the Louvicourt tailings, here with the four-correction analysis. This characterization is not available with any other traditional methods. Despite of the difference observed in term of mineral quantification or particle size analysis, the size-by-size mineralogy is key information to an adapted remediation application. Figure 7 shows significant variations in the particle size distribution of the different minerals. The pyrite is spread between 3 to 150 µm with a relatively uniform distribution in comparison to the whole particle size distribution of the tailings. The silicates were relatively concentrated in the coarse fractions (approximately 80 µm) whereas the carbonates were split into two populations with the finest below 10 µm and the coarsest between 30 to 100 µm, explaining maybe their lowest quantification versus the reference. 0 10 20 30 40 50 60 70 80 90 100 0.1110100 1000 Particle size (µm) Cumulative volumic proportion (%vol) SEMIAD PA-MS-PS SEMIAD PA-PSS-MS-PS Mining residue by laser diffraction 0 2 4 6 8 10 12 14 0.1110100 1000 Particle size (µm) Cumulative volumic proportion (%vol) SEMIAD PA-MS-PS SEMIAD PA-PSS-MS-PS Mining residue by laser diffraction A) B)  R. Mermillod-Blondin, M. Benzaazoua, M. Kongolo, et al. Vol.10, No.12 1126 Figure 7: Size-by-size mineralogy of the mine tailing by SEMIAD (correction type PA-PSS- MS-PS) The Louvicourt mine tailings have proven to be an acid-generating tailings [35]. Even if the environmental parameters are very variable, a pyrite content above 14 wt% and a low proportion of neutralizing minerals (like dolomite) below 5 wt% leads to a low NNP, i.e. below -20 kg CaCO 3 /t ( TABLE 2 ). Mine tailings in the uncertainty zone (-20 < NNP < 20 kg CaCO 3 /t) would require a detailed and accurate mineralogical characterization. Nevertheless, an environmental management strategy is required for the Louvicourt tailings, which are composed of pyrite, sphalerite and chalcopyrite as indicated in Table 2. The pyrite is the most abundant sulphide and would be the main source of acid mine drainage. However, the zinc and copper sulphides could be the source of contaminated drainage mainly Zn and Cu, but CND may also contain other trace elements such as Cd, Se, Ge, etc… Figure 7 shows that the sulphides were mainly coarser than 5 µm. This is one of the favourable characteristics for managing tailings by desulphurization using bulk-sulphide flotation allowing the majority of the pyrite to be extracted [36]. The residual non-floated sulphides might be primarily fine sulphides with a very fast oxidation rate. The produced acidity by the residual sulphides could be easily and rapidly neutralized by the presence of the carbonates observed in the fine fraction (< 10 µm in Figure 7). Therefore the mineralogical and size-by-size characteristics of the tailings are important input data for a preliminary feasibility study for the implementation of a remediation technique like desulphurisation to limit acid mine or contaminated neutral drainage. 4. CONCLUSIONS In this paper, the main objective is the development and calibration of the SEM-EDS-IA technology and its application in the characterization of acid-generating mine tailings. The results have emphasized the following points: 0.2681.2355.68926.202 120.668 Pyrit e Quartz Mica Chlorit e Felds pars Carbonates Particle size (µm) Proportion (%wt) 0 1 2 3 4 5 6 7 8 0.1110100 1000 0 1 2 3 4 5 6 7 8 0.1110100 1000 Laser diffraction analysis  Vol.10, No.12 Development and Calibration of a Quantitative, Automated Mineralogical Assessment 1127 1. SEM-EDS-IA analysis was a very informative method. It can produce size-by-size mineralogy with narrow size classes which is not available with any other traditional methods. However, some precautions are necessary and four corrections were developed to improve the precision of the results. 2. The choice of magnification should allow for the analysis of the entire particle size range. This paper demonstrates that in order to capture the large grains a probability of analysis superior to 75 % is required. 3. Stereological corrections are efficient in certain cases and some limits of their applications have been illustrated in this paper. For example the correction for particle sedimentation segregation should not be used with powders coarser than 60 µm; 4. The mineralogical analysis of the mine tailings using SEMIAD allows the preliminary feasibility study for the implementation of a remediation technique like desulphurisation to limit acid generation. Future research will focus on the improvement of the corrections using calibrated particle size fractions as well as the effect of particle shape and sphere model in mineral quantification. The mineral liberation and the exposed surface quantification will be also a part of the next developments to address mineral reactivity and kinetics in the acid mine drainage context. ACKNOWLEDGEMENTS The authors would like to thank the NSERC Industrial Polytechnique-UQAT Chair and the Foundation of UQAT for the research funds. Thanks are also extended to Anne-Marie Dagenais and David Bouchard for their technical support on SEM and the SEMIAD algorithm program. A special thank to Michel Aubertin for reviewing this article as well as Rolando Lastra and Louis Bernier for their useful advice and comments. REFERENCES [1] Kwong, Y.T.J., 1993, Prediction and prevention of acid rock drainage from a geological and mineralogical perspective. MEND Report 1.32.1, Ottawa, CANMET. [2] Lapakko, K.A. 1994, Evaluation of neutralisation potential determinations for metal mine waste and a proposed alternative, in: The International Land Reclamation and Mine Drainage Conference and the Third International Conference on the Abatement of Acidic Drainage, Pittsburgh. [3] Paktunc, A.D., 1999, “Mineralogical constraints on the determination of neutralization potential and prediction of acid mine drainage.” Environmental Geology, Vol. 39, No. 2, pp. 103-112.  R. Mermillod-Blondin, M. Benzaazoua, M. Kongolo, et al. Vol.10, No.12 1128 [4] Bouzahzah, H., Califice, A., Benzaazoua, M., Mermillod-Blondin, R., and Pirard, E., 2008, Modal analysis of mineralogical blends using optical image analysis versus X- Ray diffraction, in: Proceeding of the International Congress of Applied Mineralogy, Brisbane. [5] Paktunc, A.D., 1999, Characterization of Mine Wastes for Prediction of Acid Mine Drainage, in: Environmental Impacts of Mining Activities, pp. 31-36 (Azcue, J.M., Ed.), Berlin, Springer. [6] Sutherland, D.N., and Gottlieb, P., 1991, Application of automated quantitative mineralogy in mineral processing, Minerals Engineering, Vol. 4, No. 7-11, pp. 753- 762. [7] Sutherland, D., 2007, “Estimation of grain size using automated mineralogy.” Minerals Engineering, Vol. 20, No. 5, pp. 452-460. [8] Knight, R.D., Klassen, R.A. and Hunt, P., 2002, “Mineralogy of fine-grained sediment by energy dispersive spectrometry (EDS) image analysis - a methodology.” Environmental Geology, Vol. 42, pp. 32-40. [9] Kahn, H., Mano, E. S., and Tassinari, M. M. M. L., 2002, “Image analysis coupled with a SEM-EDS applied to the characterization of a partially weathered Zn-Pb ore.” J. of Minerals & Materials Characterization & Engineering, Vol. 1, No. 1, pp. 1-9. [10] Gu, Y., 2003, “Automated scanning electron microscope based mineral liberation analysis. An introduction to JKMRC/FEI Mineral Liberation Analyser.” J. of Minerals & Materials Characterization & Engineering, Vol. 2, No. 1, pp. 33-41. [11] Petruk, W., 1976, “The application of quantitative mineralogical analysis of ores to ores dressing.” CIM Bulletin, Vol. 767, pp. 146-153. [12] Lastra, R., Petruk, W., and Wilson, J.M.D., 1998, Image-analysis techniques and applications to mineral processing, in: Commission on Ore Mineralogy, International Mineralogical Association, Volume 27, pp. 327-366, (Cabri, L.J., and Vaughan, D.J., Eds.), Ottawa, Mineralogical Association of Canada. [13] Wilson, J.M.D., and Lastra, R., 1999, Quantification of silicate minerals by SEM-based image analysis, in: TMS Symposium, San Diego, The Minerals, Metals & Materials Society. [14] Petruk, W., and Lastra, R., 1997, Measuring mineral liberation and mineral associations from polished sections by image analysis, in: Proceedings XX IMPC, Volume 2, pp. 111-119, Aachen. [15] Lin, D., Lastra, R., and Finch, J.A., 1999, Comparison of stereological correction procedures for liberation measurements by use of a standard material, in: Trans. Instn Min. Metall. (Sect. C: Mineral Process. Extr. Metall.), Volume 108, pp. C127-C137. [16] Petruk, W., 2000, Applied Mineralogy in the Mining Industry, Elsevier, Amsterdam. [17] JKTech, 2007, http://www.jktech.com.au/Products_Services/MLA/ [18] Zhou, J., 2010, Process mineralogy of silver ores and application in flowsheet design and plant optimization, in: Proceeding of the 42nd Annual Canadian Mineral Processors Conference, pp. 143-162, Ottawa, the Canadian Institute of Mining, Metallurgy and Petroleum. [19] Intellection, 2007, http://www.intellection.com.au/auto_analysis.html.  Vol.10, No.12 Development and Calibration of a Quantitative, Automated Mineralogical Assessment 1129 [20] Lotter, N.O., Whittaker, P.J., Kormos, L., Stickling, J.S., and Wilkie, G.J., 2002, “The development of process mineralogy at Falconbridge Limited and application to the Raglan Mill”. CIM Bulletin, Vol. 95, No. 1066, pp. 85-92. [21] Pascoe, R.D., Power, M.R., and Simpson, B., 2007, “QEMSCAN analysis as a tool for improved understanding of gravity separator performance.” Minerals Engineering, Vol. 20, No. 5, pp. 87-95. [22] Kormos, L., Oliviera, J., Fragomeni, D., Whitman, E., and Carrión De la Cruz, J., 2010, Process diagnosis using quantitative mineralogy, in: Proceeding of the 42nd Annual Canadian Mineral Processors Conference, pp. 143-162, Ottawa, the Canadian Institute of Mining, Metallurgy and Petroleum. [23] Mermillod-Blondin, R., Benzaazoua, M., Kongolo, M., de Donato, P., and Aubertin, M., 2003, Quantitative mineralogy using image analysis on scanning electron microscopy: environmental application for mill tailings, in: Proceedings Applied Mineralogy 03, (Wills, B., Ed.), Helsinki, Minerals Engineering Conference. [24] Kelly, R.N., DiSante, K.J., Stranzl, E., Kazanjian, J.A., Bowen, P., Matsuyama, T., and Gabas, N., 2006, “Graphical comparison of image analysis and laser diffraction particle size analysis data obtained from the measurements of nonspherical particle systems.” AAPS Pharma. Sci. Tech., Vol. 7, No. 3, pp. E1-E14. [25] Barthelmy, D., 2005, http://www.webmineral.com. [26] Petruk, W., 1978, Correlation between grain sizes in polished section with sieve data and investigation of mineral liberation measurements from polished sections. Transactions/ Section C of the Institution of Mining and Metallurgy, Vol. 87, pp. c271-c278. [27] Miles, R.E., 1974, On the elimination of the edge-effects in planar sampling, in: Stochastic geometry: a tribute to the memory of Rollo Davidson, pp. 228-247 (Harding, E.F., and Kendall, D.G., Eds.), London, New York, Sydney, and Toronto, John Wiley and Sons. [28] Lantuéjoul, C., 1978, Computation of the histograms of the number of edges and neighbours of cells in a tessellation, in: Proceeding Geometrical Probability and Biological Structures: Buffon’s 200th Anniversary, Volume 23, pp. 323-329, (Miles, R.E. and Serra, J., Eds.), Lectures notes in Biomathematics, Berlin, Springer. [29] Exner, H.E. and Giess, E.A., 1989, A stereology-based equation for isotropic shrinkage during sintering by viscous flow, Science of Sintering Seventh, Plenum, New York. [30] King, M.P. and Schneider, 1995. Basic image analysis for the measurement of mineral liberation, in: Proceedings Process Mineralogy XIII: Applications to Beneficiation Problems, Pyrometallurgical Products, Advanced Mineralogical Techniques, Precious Metals, Environmental Concerns, Ceramic Materials, Hydrometallurgy, and Minerals Exploration. (Hagni, R.D., Ed), The Mineral, Metals & Materials Society. [31] Wehr, S.D., and Shaw, J.M., 2002, “A note on the misuse of area images to obtain particle size information in solid-solid systems.” Canadian Metallurgical Quarterly, Vol. 41, No. 3, pp. 365-372. [32] Jones, M.P., 1987, Applied Mineralogy. A quantitative approach, Graham & Trotman, London.  R. Mermillod-Blondin, M. Benzaazoua, M. Kongolo, et al. Vol.10, No.12 1130 [33] Rosin, P., and Rammler E., 1933, “The law governing the fineness of powdered coal.” Journal Inst. Fuel, Vol. 7, pp. 29-36, and discussion, pp. 109-122. [34] Kelly, E.G., and Spottiswood, D.J., 1982, Introduction to Mineral Processing, Wiley- Interscience, New York. [35] Mermillod-Blondin, R., 2006, Influence of the pyrite surface properties on the collection of sulphurous organic molecules: Application to the desulphurization of mine tailings, Ph.D. Thesis, INPL-ENSG-LEM and École Polytechnique de Montréal, Nancy, France and Montreal, Quebec (in French). [36] Benzaazoua, M., Bussière, B., Kongolo, M., McLaughlin, J., and Marion, P., 2000. “Environmental desulphurization of four Canadian mine tailings using froth flotation.” Int. J. of Mineral Processing, Vol. 60, pp. 57-74. |