Paper Menu >>
Journal Menu >>
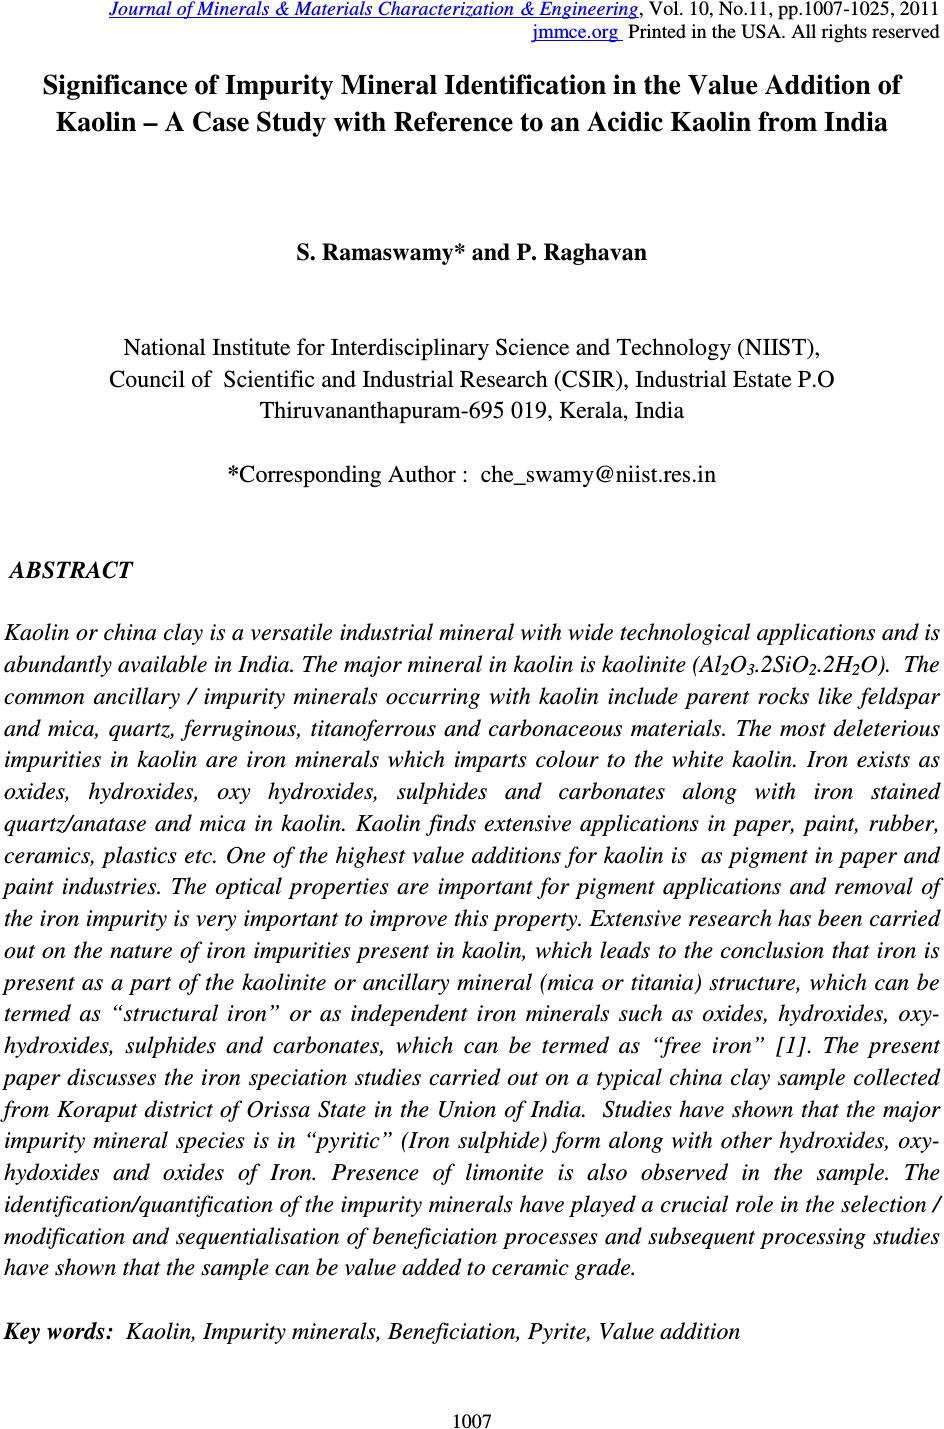 Journal of Minerals & Materials Characterization & Engineering, Vol. 10, No.11, pp.1007-1025, 2011 jmmce.org Printed in the USA. All rights reserved 1007 Significance of Impurity Mineral Identification in the Value Addition of Kaolin – A Case Study with Reference to an Acidic Kaolin from India S. Ramaswamy* and P. Raghavan National Institute for Interdisciplinary Science and Technology (NIIST), Council of Scientific and Industrial Research (CSIR), Industrial Estate P.O Thiruvananthapuram-695 019, Kerala, India *Corresponding Author : che_swamy@niist.res.in ABSTRACT Kaolin or china clay is a versatile industrial mineral with wide technological applications and is abundantly available in India. The major mineral in kaolin is kaolinite (Al 2 O 3 .2SiO 2 .2H 2 O). The common ancillary / impurity minerals occurring with kaolin include parent rocks like feldspar and mica, quartz, ferruginous, titanoferrous and carbonaceous materials. The most deleterious impurities in kaolin are iron minerals which imparts colour to the white kaolin. Iron exists as oxides, hydroxides, oxy hydroxides, sulphides and carbonates along with iron stained quartz/anatase and mica in kaolin. Kaolin finds extensive applications in paper, paint, rubber, ceramics, plastics etc. One of the highest value additions for kaolin is as pigment in paper and paint industries. The optical properties are important for pigment applications and removal of the iron impurity is very important to improve this property. Extensive research has been carried out on the nature of iron impurities present in kaolin, which leads to the conclusion that iron is present as a part of the kaolinite or ancillary mineral (mica or titania) structure, which can be termed as “structural iron” or as independent iron minerals such as oxides, hydroxides, oxy- hydroxides, sulphides and carbonates, which can be termed as “free iron” [1]. The present paper discusses the iron speciation studies carried out on a typical china clay sample collected from Koraput district of Orissa State in the Union of India. Studies have shown that the major impurity mineral species is in “pyritic” (Iron sulphide) form along with other hydroxides, oxy- hydoxides and oxides of Iron. Presence of limonite is also observed in the sample. The identification/quantification of the impurity minerals have played a crucial role in the selection / modification and sequentialisation of beneficiation processes and subsequent processing studies have shown that the sample can be value added to ceramic grade. Key words: Kaolin, Impurity minerals, Beneficiation, Pyrite, Value addition 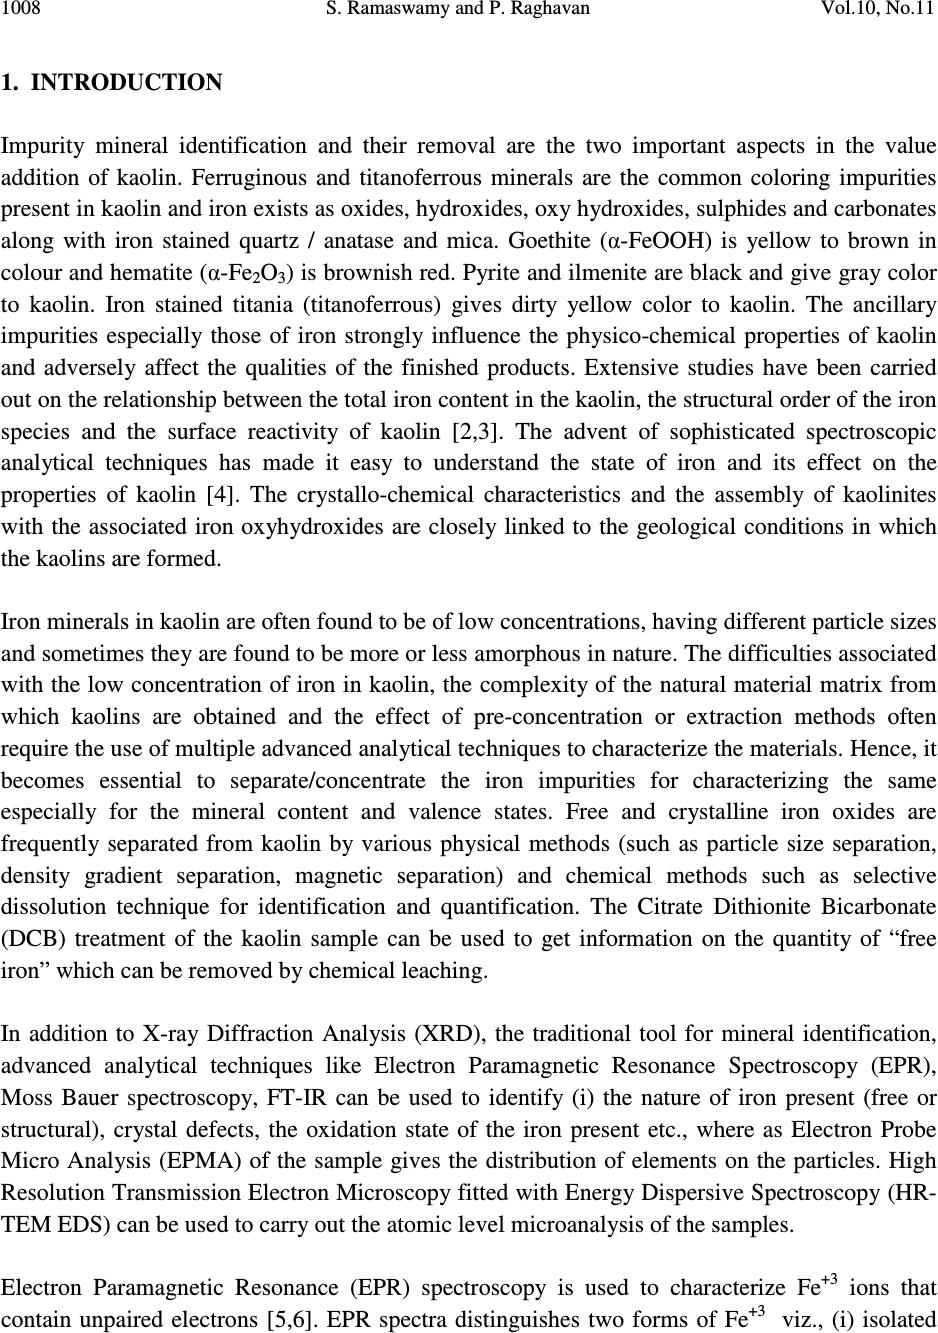 1008 S. Ramaswamy and P. Raghavan Vol.10, No.11 1. INTRODUCTION Impurity mineral identification and their removal are the two important aspects in the value addition of kaolin. Ferruginous and titanoferrous minerals are the common coloring impurities present in kaolin and iron exists as oxides, hydroxides, oxy hydroxides, sulphides and carbonates along with iron stained quartz / anatase and mica. Goethite (α-FeOOH) is yellow to brown in colour and hematite (α-Fe 2 O 3 ) is brownish red. Pyrite and ilmenite are black and give gray color to kaolin. Iron stained titania (titanoferrous) gives dirty yellow color to kaolin. The ancillary impurities especially those of iron strongly influence the physico-chemical properties of kaolin and adversely affect the qualities of the finished products. Extensive studies have been carried out on the relationship between the total iron content in the kaolin, the structural order of the iron species and the surface reactivity of kaolin [2,3]. The advent of sophisticated spectroscopic analytical techniques has made it easy to understand the state of iron and its effect on the properties of kaolin [4]. The crystallo-chemical characteristics and the assembly of kaolinites with the associated iron oxyhydroxides are closely linked to the geological conditions in which the kaolins are formed. Iron minerals in kaolin are often found to be of low concentrations, having different particle sizes and sometimes they are found to be more or less amorphous in nature. The difficulties associated with the low concentration of iron in kaolin, the complexity of the natural material matrix from which kaolins are obtained and the effect of pre-concentration or extraction methods often require the use of multiple advanced analytical techniques to characterize the materials. Hence, it becomes essential to separate/concentrate the iron impurities for characterizing the same especially for the mineral content and valence states. Free and crystalline iron oxides are frequently separated from kaolin by various physical methods (such as particle size separation, density gradient separation, magnetic separation) and chemical methods such as selective dissolution technique for identification and quantification. The Citrate Dithionite Bicarbonate (DCB) treatment of the kaolin sample can be used to get information on the quantity of “free iron” which can be removed by chemical leaching. In addition to X-ray Diffraction Analysis (XRD), the traditional tool for mineral identification, advanced analytical techniques like Electron Paramagnetic Resonance Spectroscopy (EPR), Moss Bauer spectroscopy, FT-IR can be used to identify (i) the nature of iron present (free or structural), crystal defects, the oxidation state of the iron present etc., where as Electron Probe Micro Analysis (EPMA) of the sample gives the distribution of elements on the particles. High Resolution Transmission Electron Microscopy fitted with Energy Dispersive Spectroscopy (HR- TEM EDS) can be used to carry out the atomic level microanalysis of the samples. Electron Paramagnetic Resonance (EPR) spectroscopy is used to characterize Fe +3 ions that contain unpaired electrons [5,6]. EPR spectra distinguishes two forms of Fe +3 viz., (i) isolated 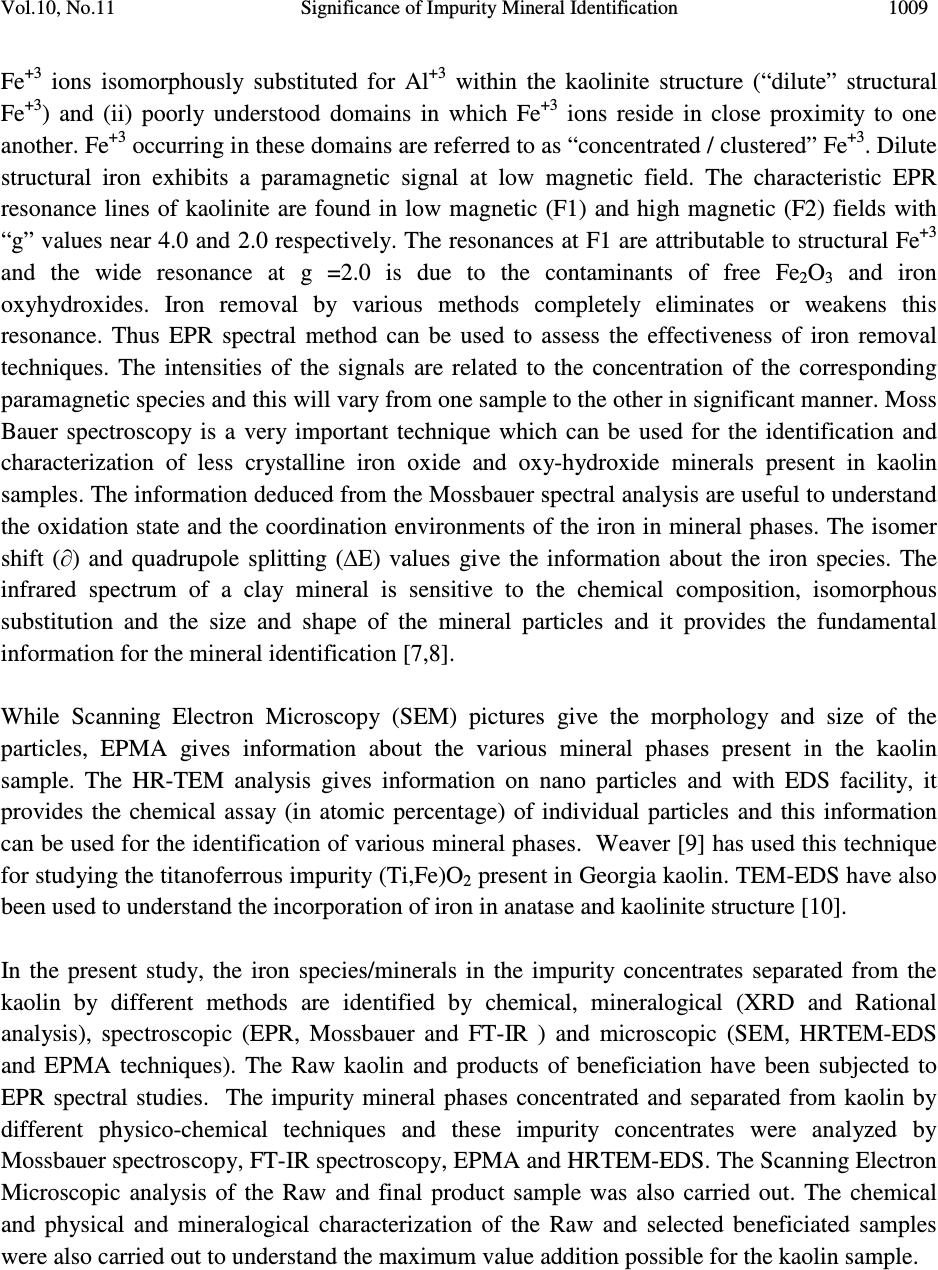 Vol.10, No.11 Significance of Impurity Mineral Identification 1009 Fe +3 ions isomorphously substituted for Al +3 within the kaolinite structure (“dilute” structural Fe +3 ) and (ii) poorly understood domains in which Fe +3 ions reside in close proximity to one another. Fe +3 occurring in these domains are referred to as “concentrated / clustered” Fe +3 . Dilute structural iron exhibits a paramagnetic signal at low magnetic field. The characteristic EPR resonance lines of kaolinite are found in low magnetic (F1) and high magnetic (F2) fields with “g” values near 4.0 and 2.0 respectively. The resonances at F1 are attributable to structural Fe +3 and the wide resonance at g =2.0 is due to the contaminants of free Fe 2 O 3 and iron oxyhydroxides. Iron removal by various methods completely eliminates or weakens this resonance. Thus EPR spectral method can be used to assess the effectiveness of iron removal techniques. The intensities of the signals are related to the concentration of the corresponding paramagnetic species and this will vary from one sample to the other in significant manner. Moss Bauer spectroscopy is a very important technique which can be used for the identification and characterization of less crystalline iron oxide and oxy-hydroxide minerals present in kaolin samples. The information deduced from the Mossbauer spectral analysis are useful to understand the oxidation state and the coordination environments of the iron in mineral phases. The isomer shift (∂) and quadrupole splitting (∆E) values give the information about the iron species. The infrared spectrum of a clay mineral is sensitive to the chemical composition, isomorphous substitution and the size and shape of the mineral particles and it provides the fundamental information for the mineral identification [7,8]. While Scanning Electron Microscopy (SEM) pictures give the morphology and size of the particles, EPMA gives information about the various mineral phases present in the kaolin sample. The HR-TEM analysis gives information on nano particles and with EDS facility, it provides the chemical assay (in atomic percentage) of individual particles and this information can be used for the identification of various mineral phases. Weaver [9] has used this technique for studying the titanoferrous impurity (Ti,Fe)O 2 present in Georgia kaolin. TEM-EDS have also been used to understand the incorporation of iron in anatase and kaolinite structure [10]. In the present study, the iron species/minerals in the impurity concentrates separated from the kaolin by different methods are identified by chemical, mineralogical (XRD and Rational analysis), spectroscopic (EPR, Mossbauer and FT-IR ) and microscopic (SEM, HRTEM-EDS and EPMA techniques). The Raw kaolin and products of beneficiation have been subjected to EPR spectral studies. The impurity mineral phases concentrated and separated from kaolin by different physico-chemical techniques and these impurity concentrates were analyzed by Mossbauer spectroscopy, FT-IR spectroscopy, EPMA and HRTEM-EDS. The Scanning Electron Microscopic analysis of the Raw and final product sample was also carried out. The chemical and physical and mineralogical characterization of the Raw and selected beneficiated samples were also carried out to understand the maximum value addition possible for the kaolin sample. 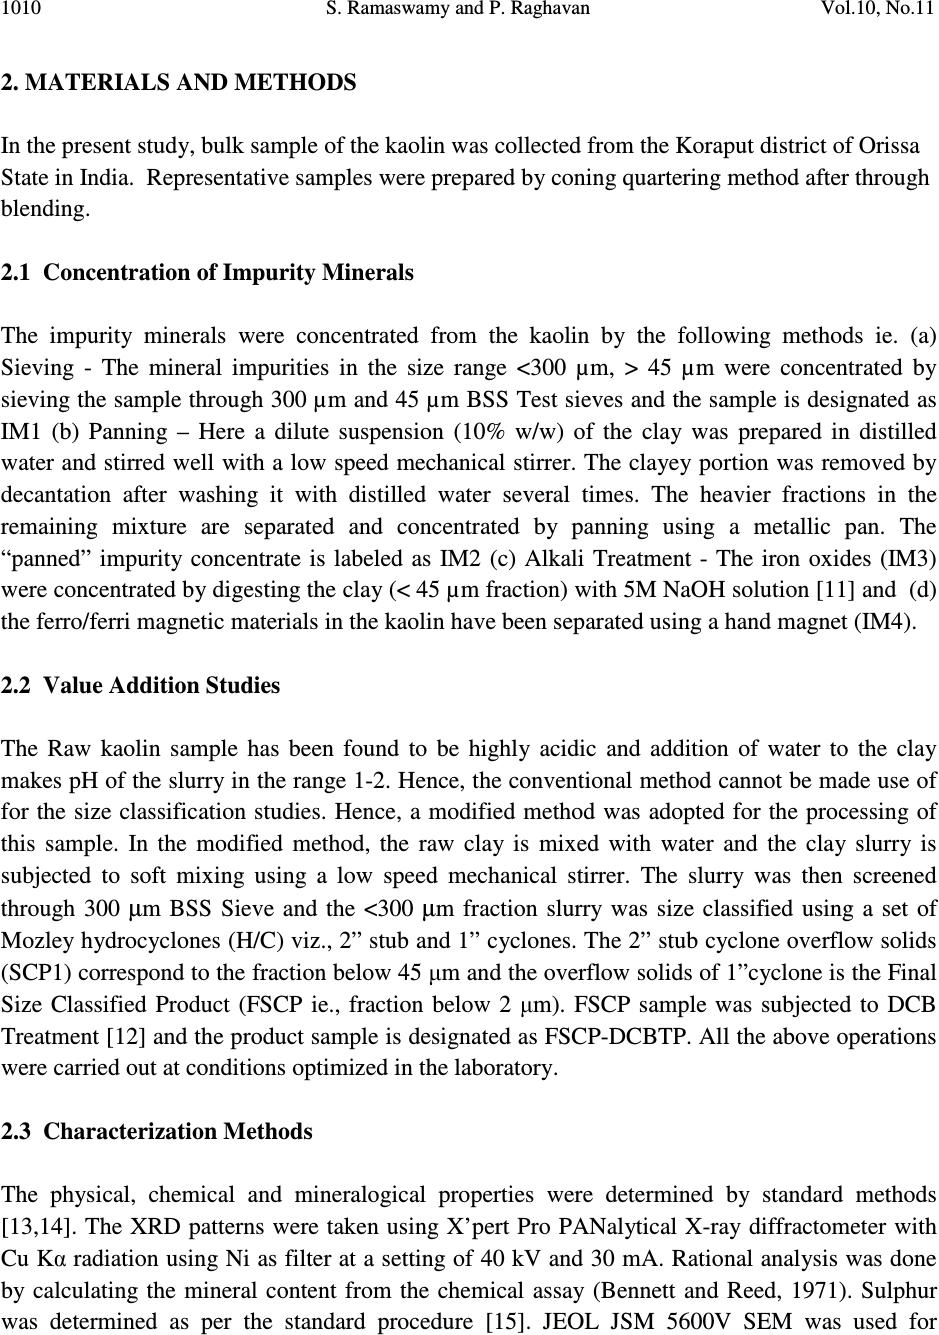 1010 S. Ramaswamy and P. Raghavan Vol.10, No.11 2. MATERIALS AND METHODS In the present study, bulk sample of the kaolin was collected from the Koraput district of Orissa State in India. Representative samples were prepared by coning quartering method after through blending. 2.1 Concentration of Impurity Minerals The impurity minerals were concentrated from the kaolin by the following methods ie. (a) Sieving - The mineral impurities in the size range <300 µm, > 45 µm were concentrated by sieving the sample through 300 µm and 45 µm BSS Test sieves and the sample is designated as IM1 (b) Panning – Here a dilute suspension (10% w/w) of the clay was prepared in distilled water and stirred well with a low speed mechanical stirrer. The clayey portion was removed by decantation after washing it with distilled water several times. The heavier fractions in the remaining mixture are separated and concentrated by panning using a metallic pan. The “panned” impurity concentrate is labeled as IM2 (c) Alkali Treatment - The iron oxides (IM3) were concentrated by digesting the clay (< 45 µm fraction) with 5M NaOH solution [11] and (d) the ferro/ferri magnetic materials in the kaolin have been separated using a hand magnet (IM4). 2.2 Value Addition Studies The Raw kaolin sample has been found to be highly acidic and addition of water to the clay makes pH of the slurry in the range 1-2. Hence, the conventional method cannot be made use of for the size classification studies. Hence, a modified method was adopted for the processing of this sample. In the modified method, the raw clay is mixed with water and the clay slurry is subjected to soft mixing using a low speed mechanical stirrer. The slurry was then screened through 300 µm BSS Sieve and the <300 µm fraction slurry was size classified using a set of Mozley hydrocyclones (H/C) viz., 2” stub and 1” cyclones. The 2” stub cyclone overflow solids (SCP1) correspond to the fraction below 45 µm and the overflow solids of 1”cyclone is the Final Size Classified Product (FSCP ie., fraction below 2 µm). FSCP sample was subjected to DCB Treatment [12] and the product sample is designated as FSCP-DCBTP. All the above operations were carried out at conditions optimized in the laboratory. 2.3 Characterization Methods The physical, chemical and mineralogical properties were determined by standard methods [13,14]. The XRD patterns were taken using X’pert Pro PANalytical X-ray diffractometer with Cu Kα radiation using Ni as filter at a setting of 40 kV and 30 mA. Rational analysis was done by calculating the mineral content from the chemical assay (Bennett and Reed, 1971). Sulphur was determined as per the standard procedure [15]. JEOL JSM 5600V SEM was used for  Vol.10, No.11 Significance of Impurity Mineral Identification 1011 studying the morphology of the samples. High resolution TEM J 1210 JEOL was used to carry out micro analysis of various elements. EPMA studies were carried out using EPMA Scanning Electron Microscope, JEOL Model (JXA-8100), Japan. FTIR Perkin – Elmer spectrophotometer was used for the spectral studies of the impurity concentrates in the IR region. EPR studies were carried out using EPR Varian model E-112 spectrophotometer, while the Mossbauer studies were done using Mossbauer spectrometer ( 57 Co source in Rh matrix as the Mössbauer source). The optical properties ie., brightness and “L a b” color values (in ISO units) were measured using Color Touch spectrophotometer (Technidyne Corporation, USA). Brightness represents the % of reflectance of light at a wavelength of 457 nm. Particle size distribution was found out by Sedigraph 5100 model, Micromeritics, USA. 3. RESULTS AND DISCUSSIONS 3.1 Characterization of the Raw Kaolin The Raw clay is soft and gray in color with blackish impurities. It is easily slaking and the pH of the clay is found to be quite low (1.74). The general properties of the Raw clay is given in Table 1. XRD analysis data shows the presence of pyrite in the sample. The highly acidic nature of the clay may be due to the presence of pyrite particles. The oxidation of pyrite by ferric iron is much faster than by oxygen [16]. FeS 2 + 7 / 2 O 2 + H 2 O -- Fe +2 + 2SO 42- + 2H + Fe +2 + ¼ O 2 + H + -- Fe +3 + ½ H 2 O FeS 2 + 14 Fe +3 + 8 H 2 O 15 Fe +2 + 2 SO 42- + 16 H + The matter soluble in water is on the higher side ie., 4.14% and the reason for the high value can be attributed to mobilization of metals such as Fe +3 from the clay by H 2 SO 4 . The matter soluble in acid is 9.06% and this high acid soluble value may be due to the presence of some soluble salts. Specific gravity of the Raw clay is slightly higher than that of pure kaolinite which is possibly due to the presence of heavy mineral impurities like pyrite. The CEC of the clay is found to be low, 2.1meq/100g clay. This is attributed to its low pH which causes protonation and formation of a positive charge on the surface of the clay minerals [17]. The clay is kaolinitic as indicated by the silica and alumina content which are close to the theoretical values of kaolinite mineral. However, the LOI value is found to be on a higher side (18.17%) which can be attributed to the presence of carbonaceous matter or decomposable minerals resulting in weight loss on heating. The iron and TiO 2 content in the sample are found to be relatively high (3.76 and 1.60% respectively). XRD pattern of the clay showed that pyrite is one of the major impurities. Rational analysis data also confirms the presence of pyrite in the sample. The pyrite content in the sample is estimated to be 3.87% and correspondingly the sulphur content is 2.07 %. Particle size distribution analyses given in Table 1 show that the percentage of fines are moderately high  1012 S. Ramaswamy and P. Raghavan Vol.10, No.11 (49.90% < 2µm fraction). The brightness (45.87), “L” (67.43) and “HW” (27.17) values are found to be very poor. The low “L” and HW values show the presence of black/dark colored particles in the clay. The greenish tinge of the sample (represented by “-a” value) is indicative of the absence of reddish iron compounds in the sample. The “b” (-0.44) and “HY” (0.94) values show that the overall yellowness of the sample is low. This indicates that the low brightness of the sample is due to the presence of the black/dark colored minerals. Due to the high acidity of the sample and the precipitation of the water soluble colouring matter on further water addition/ pH modification, the conventional wet processing of this clay is found to be difficult. Hence, a thorough water wash was given to the clay before blunging and size classification. 3.2. Impurity Mineral Identification Studies 3.2.1. Chemical and mineralogical studies The impurity minerals IM1, IM2 and IM3 have been characterized for their chemical assay and mineralogical properties and the salient results are given in Table 2. The IM1 sample is found to contain appreciable amount of iron and sulphur. The LOI is slightly high compared to that of kaolinite mineral, indicating the presence of volatiles other than the water of crystallinity. From the XRD analysis (Figure 1), quartz, pyrite and kaolinite are found to be the major minerals with rutile and anatase in minor quantities. The iron and sulphur contents confirm the presence of pyrite and the high loss on ignition value can again be attributed to the presence of pyrite particles. The high percentage of iron (8.28%) and the pyrite content (~ 65% of the total pyrite in Raw kaolin) in the sample indicates the extent of concentration of iron impurity minerals along with quartz during size separation at 45 microns (Table 1). The Rational analysis also supports these findings. The chemical assay of the IM2 sample shows the presence of appreciable quantities of quartz and heavy minerals (of “Fe” and “Ti”). XRD analysis shows that pyrite and goethite are the major minerals present in the sample along with other minerals such as quartz, rutile, anatase, ilmenite, kaolinite and graphite in minor quantities. Considerable quantity of pyrite is found to be present and is evident from the chemical assay, rational analysis and XRD findings. The high percentages of iron (33.4%) and TiO 2 (11.77%) indicates that iron and titanium impurity minerals are getting concentrated to a great extent during panning. The IM3 sample is found to be enriched with the iron mineral phases, particularly pyrite and this is evident from the chemical assay of the sample. The titania content is low since part of it may be getting leached into the alkali on heating. XRD analysis data shows the presence of pyrite, quartz and goethite as major minerals along with anatase and rutile as minor phases. The XRD analysis of the magnetic fraction, IM4 (separated by hand magnet) confirms the presence of magnetite, rutile, goethite, hematite, anatase and ilmenite as the major phases along with minor quantities pseudo rutile. 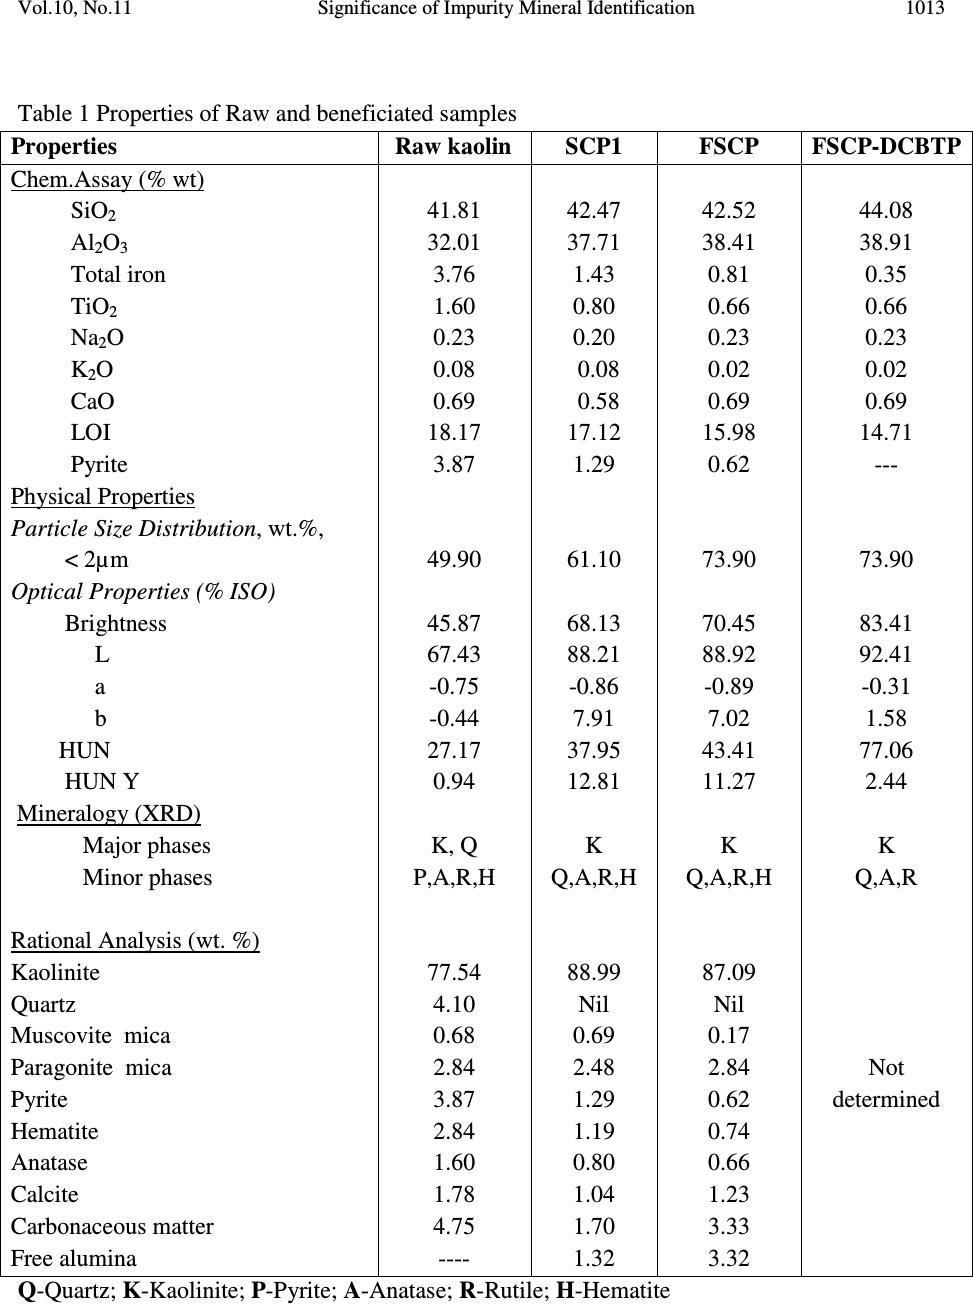 Vol.10, No.11 Significance of Impurity Mineral Identification 1013 Table 1 Properties of Raw and beneficiated samples Properties Raw kaolin SCP1 FSCP FSCP-DCBTP Chem.Assay (% wt) SiO 2 Al 2 O 3 Total iron TiO 2 Na 2 O K 2 O CaO LOI Pyrite Physical Properties Particle Size Distribution, wt.%, < 2µm Optical Properties (% ISO) Brightness L a b HUN HUN Y Mineralogy (XRD) Major phases Minor phases Rational Analysis (wt. %) Kaolinite Quartz Muscovite mica Paragonite mica Pyrite Hematite Anatase Calcite Carbonaceous matter Free alumina 41.81 32.01 3.76 1.60 0.23 0.08 0.69 18.17 3.87 49.90 45.87 67.43 -0.75 -0.44 27.17 0.94 K, Q P,A,R,H 77.54 4.10 0.68 2.84 3.87 2.84 1.60 1.78 4.75 ---- 42.47 37.71 1.43 0.80 0.20 0.08 0.58 17.12 1.29 61.10 68.13 88.21 -0.86 7.91 37.95 12.81 K Q,A,R,H 88.99 Nil 0.69 2.48 1.29 1.19 0.80 1.04 1.70 1.32 42.52 38.41 0.81 0.66 0.23 0.02 0.69 15.98 0.62 73.90 70.45 88.92 -0.89 7.02 43.41 11.27 K Q,A,R,H 87.09 Nil 0.17 2.84 0.62 0.74 0.66 1.23 3.33 3.32 44.08 38.91 0.35 0.66 0.23 0.02 0.69 14.71 --- 73.90 83.41 92.41 -0.31 1.58 77.06 2.44 K Q,A,R Not determined Q-Quartz; K-Kaolinite; P-Pyrite; A-Anatase; R-Rutile; H-Hematite 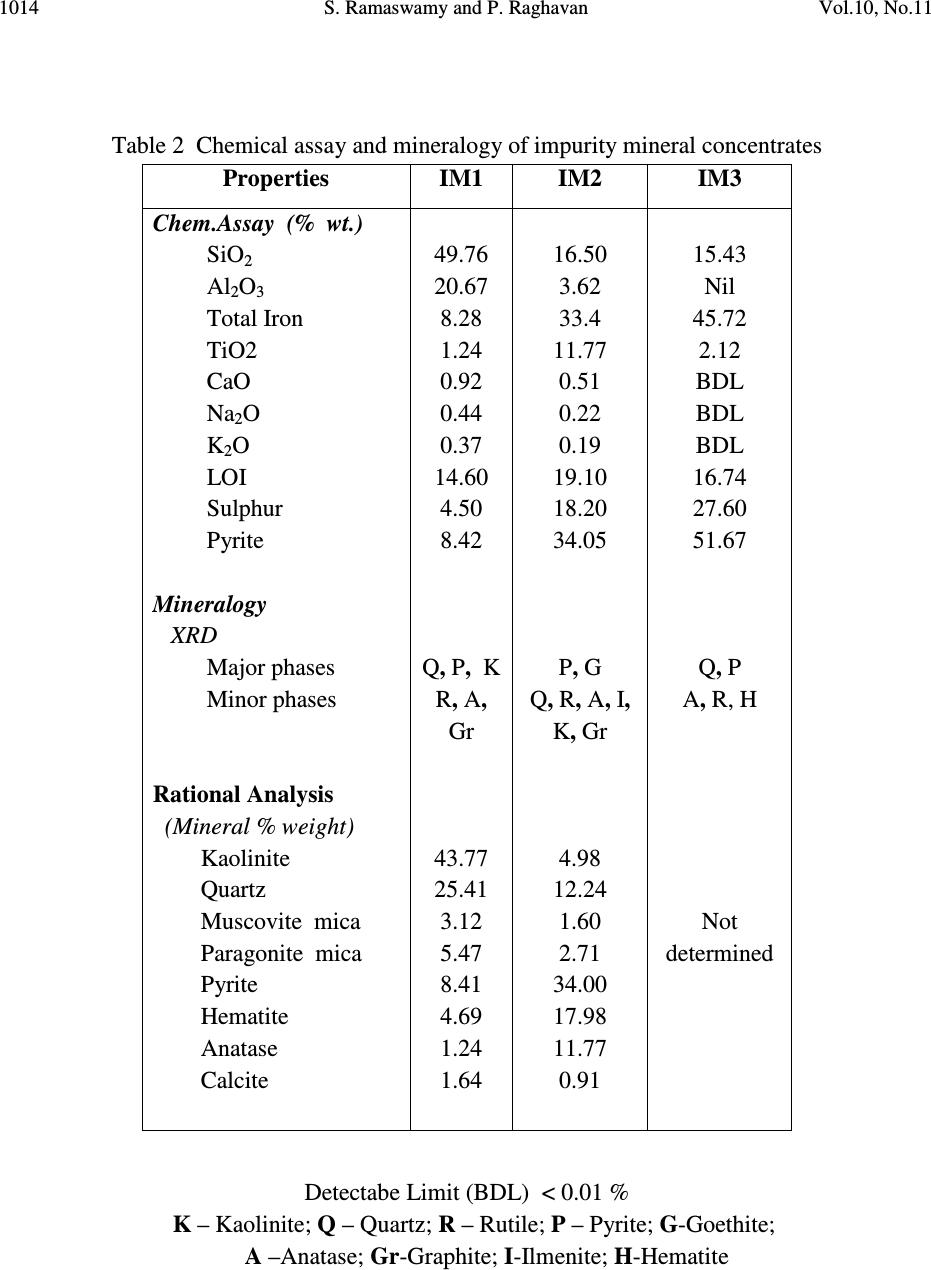 1014 S. Ramaswamy and P. Raghavan Vol.10, No.11 Table 2 Chemical assay and mineralogy of impurity mineral concentrates Detectabe Limit (BDL) < 0.01 % K – Kaolinite; Q – Quartz; R – Rutile; P – Pyrite; G-Goethite; A –Anatase; Gr-Graphite; I-Ilmenite; H-Hematite Properties IM1 IM2 IM3 Chem.Assay (% wt.) SiO 2 Al 2 O 3 Total Iron TiO2 CaO Na 2 O K 2 O LOI Sulphur Pyrite Mineralogy XRD Major phases Minor phases Rational Analysis (Mineral % weight) Kaolinite Quartz Muscovite mica Paragonite mica Pyrite Hematite Anatase Calcite 49.76 20.67 8.28 1.24 0.92 0.44 0.37 14.60 4.50 8.42 Q, P, K R, A, Gr 43.77 25.41 3.12 5.47 8.41 4.69 1.24 1.64 16.50 3.62 33.4 11.77 0.51 0.22 0.19 19.10 18.20 34.05 P, G Q, R, A, I, K, Gr 4.98 12.24 1.60 2.71 34.00 17.98 11.77 0.91 15.43 Nil 45.72 2.12 BDL BDL BDL 16.74 27.60 51.67 Q, P A, R, H Not determined 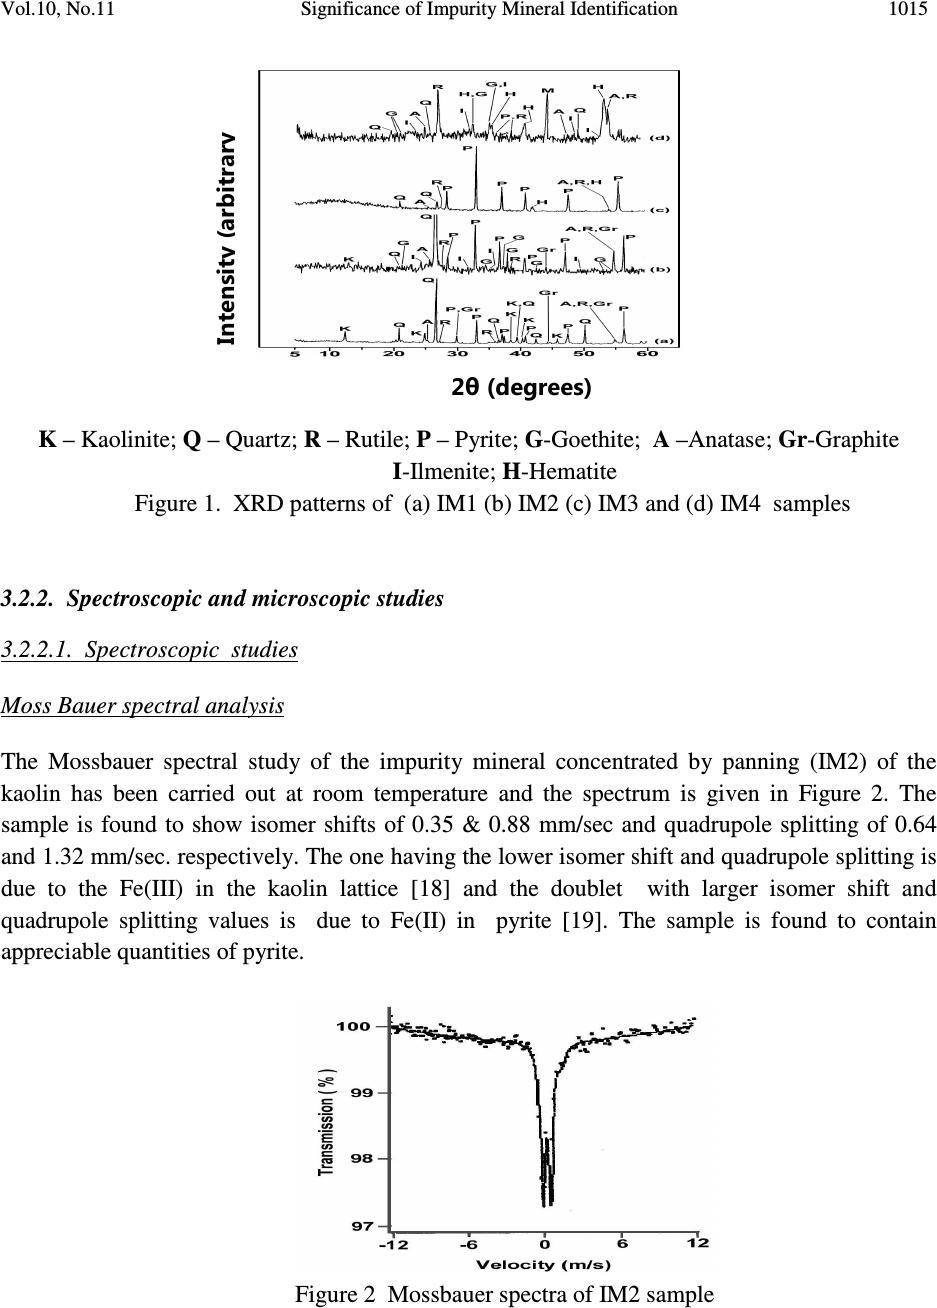 Vol.10, No.11 Significance of Impurity Mineral Identification 1015 K – Kaolinite; Q – Quartz; R – Rutile; P – Pyrite; G-Goethite; A –Anatase; Gr-Graphite I-Ilmenite; H-Hematite Figure 1. XRD patterns of (a) IM1 (b) IM2 (c) IM3 and (d) IM4 samples 3.2.2. Spectroscopic and microscopic studies 3.2.2.1. Spectroscopic studies Moss Bauer spectral analysis The Mossbauer spectral study of the impurity mineral concentrated by panning (IM2) of the kaolin has been carried out at room temperature and the spectrum is given in Figure 2. The sample is found to show isomer shifts of 0.35 & 0.88 mm/sec and quadrupole splitting of 0.64 and 1.32 mm/sec. respectively. The one having the lower isomer shift and quadrupole splitting is due to the Fe(III) in the kaolin lattice [18] and the doublet with larger isomer shift and quadrupole splitting values is due to Fe(II) in pyrite [19]. The sample is found to contain appreciable quantities of pyrite. Figure 2 Mossbauer spectra of IM2 sample Intensity (arbitrary 2θ (degrees) 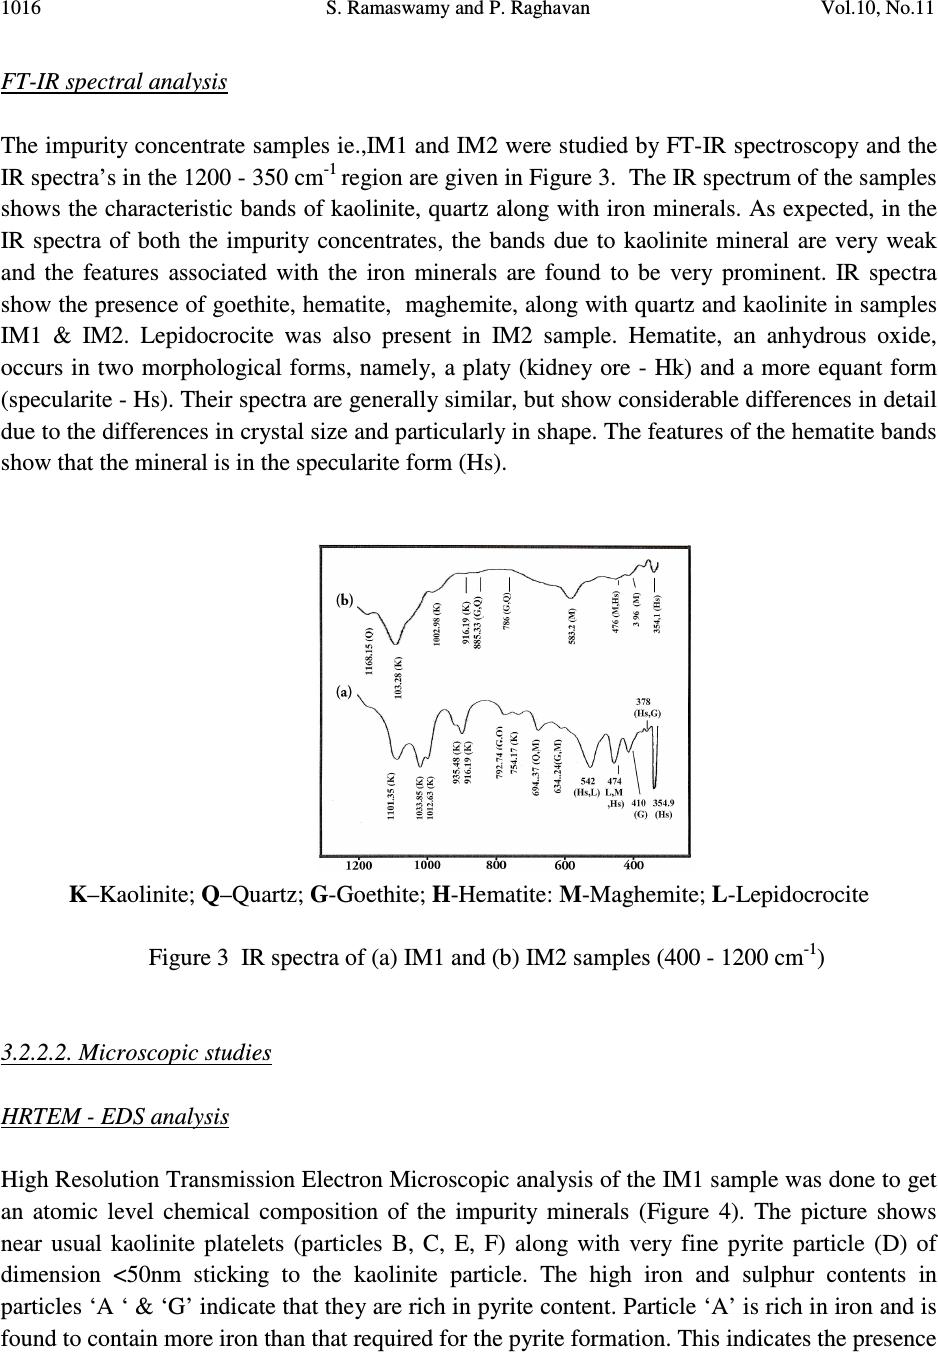 1016 S. Ramaswamy and P. Raghavan Vol.10, No.11 FT-IR spectral analysis The impurity concentrate samples ie.,IM1 and IM2 were studied by FT-IR spectroscopy and the IR spectra’s in the 1200 - 350 cm -1 region are given in Figure 3. The IR spectrum of the samples shows the characteristic bands of kaolinite, quartz along with iron minerals. As expected, in the IR spectra of both the impurity concentrates, the bands due to kaolinite mineral are very weak and the features associated with the iron minerals are found to be very prominent. IR spectra show the presence of goethite, hematite, maghemite, along with quartz and kaolinite in samples IM1 & IM2. Lepidocrocite was also present in IM2 sample. Hematite, an anhydrous oxide, occurs in two morphological forms, namely, a platy (kidney ore - Hk) and a more equant form (specularite - Hs). Their spectra are generally similar, but show considerable differences in detail due to the differences in crystal size and particularly in shape. The features of the hematite bands show that the mineral is in the specularite form (Hs). K–Kaolinite; Q–Quartz; G-Goethite; H-Hematite: M-Maghemite; L-Lepidocrocite Figure 3 IR spectra of (a) IM1 and (b) IM2 samples (400 - 1200 cm -1 ) 3.2.2.2. Microscopic studies HRTEM - EDS analysis High Resolution Transmission Electron Microscopic analysis of the IM1 sample was done to get an atomic level chemical composition of the impurity minerals (Figure 4). The picture shows near usual kaolinite platelets (particles B, C, E, F) along with very fine pyrite particle (D) of dimension <50nm sticking to the kaolinite particle. The high iron and sulphur contents in particles ‘A ‘ & ‘G’ indicate that they are rich in pyrite content. Particle ‘A’ is rich in iron and is found to contain more iron than that required for the pyrite formation. This indicates the presence 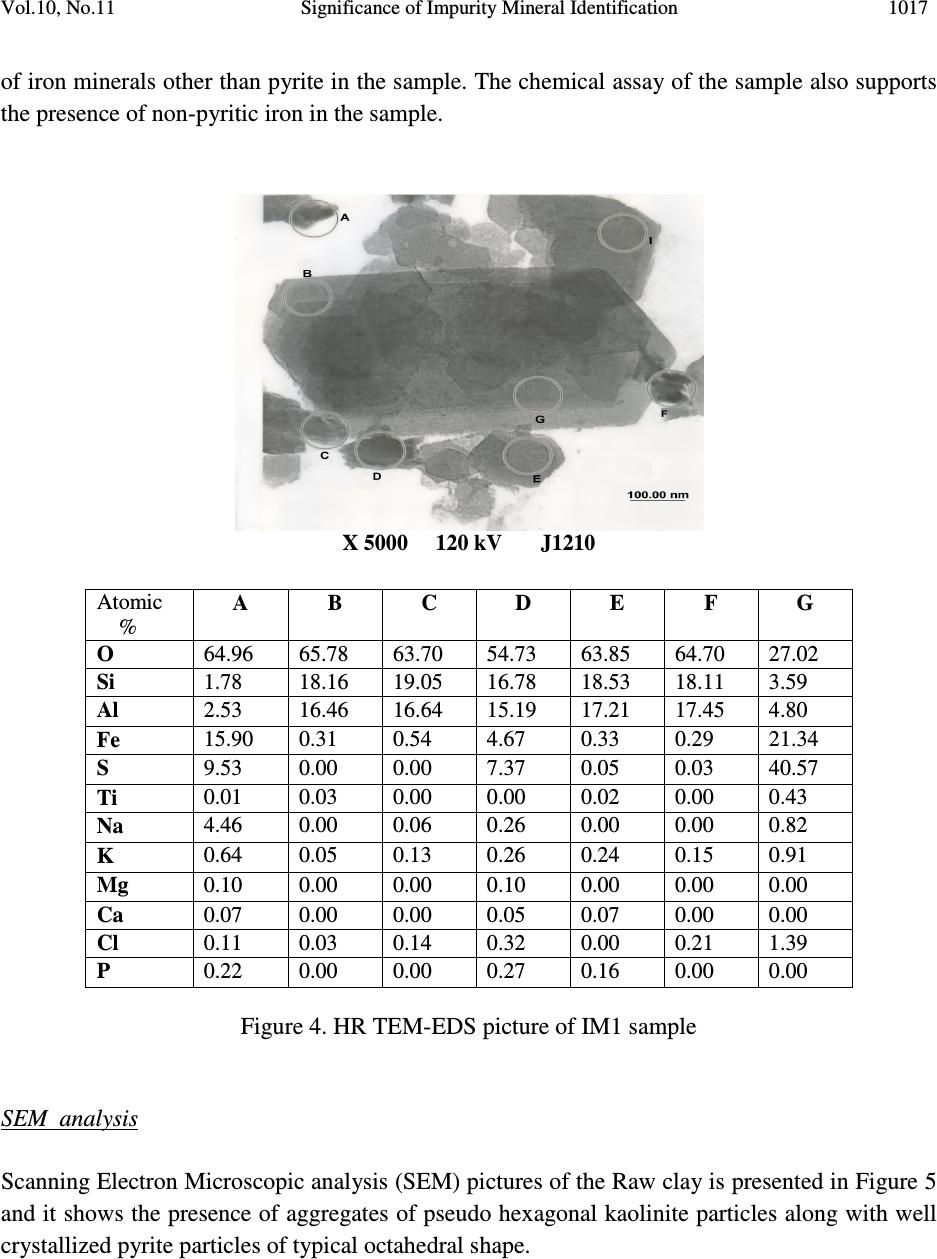 Vol.10, No.11 Significance of Impurity Mineral Identification 1017 of iron minerals other than pyrite in the sample. The chemical assay of the sample also supports the presence of non-pyritic iron in the sample. X 5000 120 kV J1210 Figure 4. HR TEM-EDS picture of IM1 sample SEM analysis Scanning Electron Microscopic analysis (SEM) pictures of the Raw clay is presented in Figure 5 and it shows the presence of aggregates of pseudo hexagonal kaolinite particles along with well crystallized pyrite particles of typical octahedral shape. Atomic % A B C D E F G O 64.96 65.78 63.70 54.73 63.85 64.70 27.02 Si 1.78 18.16 19.05 16.78 18.53 18.11 3.59 Al 2.53 16.46 16.64 15.19 17.21 17.45 4.80 Fe 15.90 0.31 0.54 4.67 0.33 0.29 21.34 S 9.53 0.00 0.00 7.37 0.05 0.03 40.57 Ti 0.01 0.03 0.00 0.00 0.02 0.00 0.43 Na 4.46 0.00 0.06 0.26 0.00 0.00 0.82 K 0.64 0.05 0.13 0.26 0.24 0.15 0.91 Mg 0.10 0.00 0.00 0.10 0.00 0.00 0.00 Ca 0.07 0.00 0.00 0.05 0.07 0.00 0.00 Cl 0.11 0.03 0.14 0.32 0.00 0.21 1.39 P 0.22 0.00 0.00 0.27 0.16 0.00 0.00 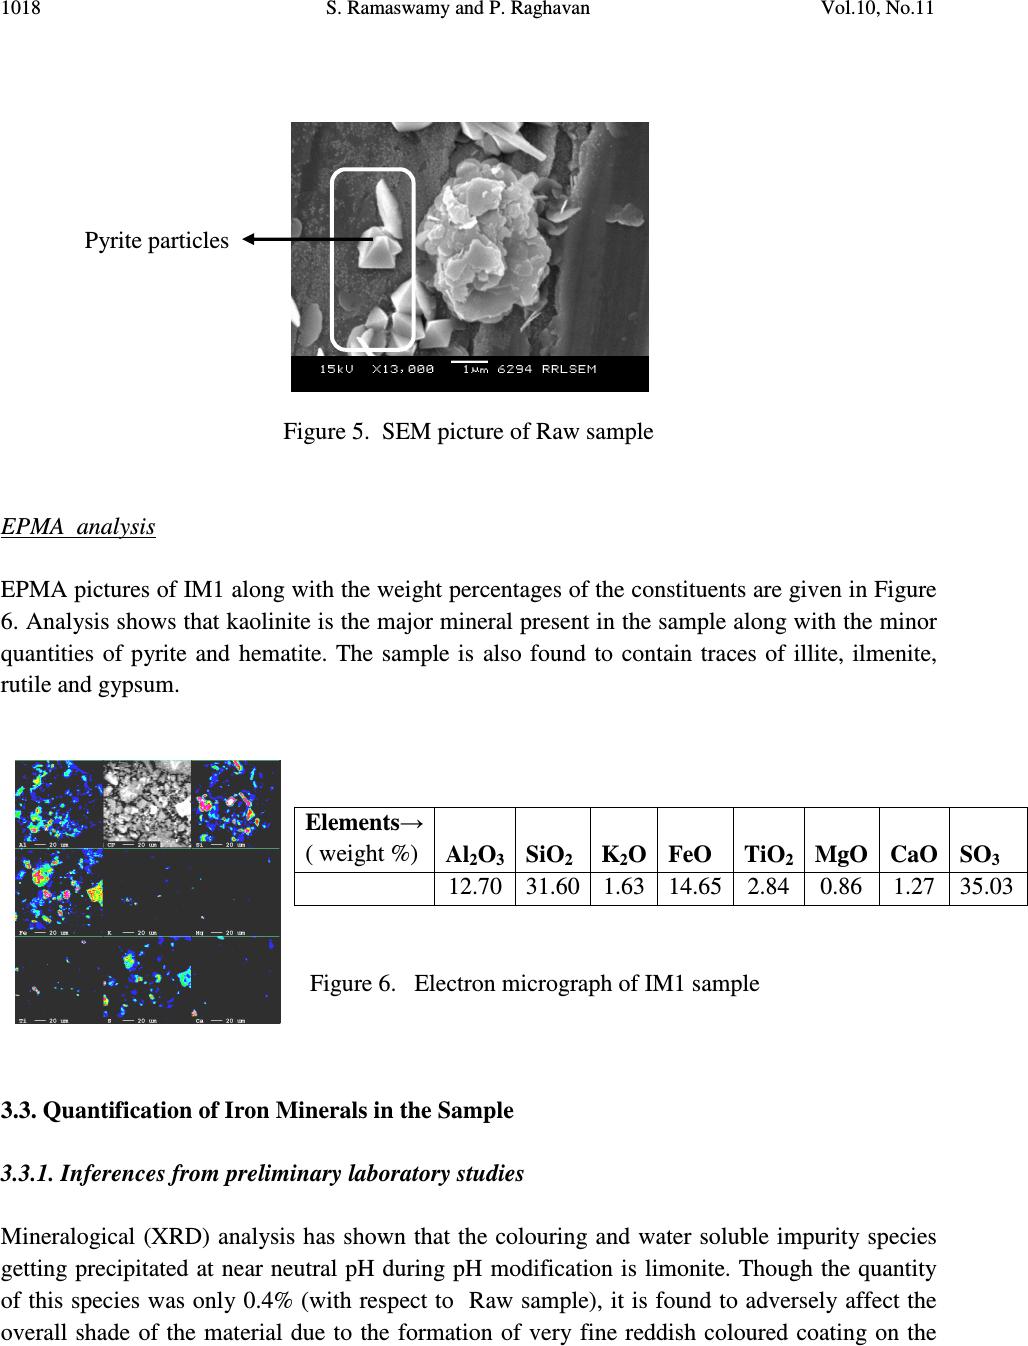 1018 S. Ramaswamy and P. Raghavan Vol.10, No.11 Pyrite particles Figure 5. SEM picture of Raw sample EPMA analysis EPMA pictures of IM1 along with the weight percentages of the constituents are given in Figure 6. Analysis shows that kaolinite is the major mineral present in the sample along with the minor quantities of pyrite and hematite. The sample is also found to contain traces of illite, ilmenite, rutile and gypsum. Figure 6. Electron micrograph of IM1 sample 3.3. Quantification of Iron Minerals in the Sample 3.3.1. Inferences from preliminary laboratory studies Mineralogical (XRD) analysis has shown that the colouring and water soluble impurity species getting precipitated at near neutral pH during pH modification is limonite. Though the quantity of this species was only 0.4% (with respect to Raw sample), it is found to adversely affect the overall shade of the material due to the formation of very fine reddish coloured coating on the Elements→ ( weight %) Al 2 O 3 SiO 2 K 2 O FeO TiO 2 MgO CaO SO 3 12.70 31.60 1.63 14.65 2.84 0.86 1.27 35.03  Vol.10, No.11 Significance of Impurity Mineral Identification 1019 clay surface during drying. Hence, the removal these iron species was an important step before the size classification of the sample. Also, laboratory level studies on the separation and quantification of the pyrite mineral has shown that ~ 65% (with respect to raw sample) of the pyrite particles are above 45 µm in size and their removal at this particular size range is highly favorable. 3.3.2. Quantification of “Free Iron” in the FSCP sample by DCB treatment The iron content and optical properties of the beneficiated samples are given in Table 1. DCB treatment gives information on the quantity of “free iron” in the sample, which can be removed by chemical leaching using suitable reducing agents. In the present study, DCB treatment of the FSCP sample was carried out and it is found to be highly effective in removing the “free iron species” from the sample. After DCB treatment, the iron content in the FSCP DCBTP sample has come down from 0.81% to 0.35% and this has led to an appreciable improvement in its optical properties. The iron removal shows that ~57% of the total iron in the clay is”free” in nature and the rest is present in the structure of either kaolinite or ancillary mineral (mica or titania). The brightness/whiteness of kaolin is dependent on the overall effect of the “L a b” color values. The “L” value and HW of the sample increase after DCB treatment by ~3.5 and ~34 units and it gives an idea about the extent of removal of the dark colored impurity minerals. Also, the decrease in the “b” and “HY” values (~ 5.5 and 8.8 units respectively) confirms the removal of the coloring iron impurities such as hematite and goethite. The sample is still found to contain 0.35% of iron. Since the sample has got good optical properties, it is possible that the iron remaining after DCB treatment may be present as part of the kaolinite structure and their by not appreciably affecting the overall brightness of the sample. It is also worth mentioning that chemical leaching has not effected any changes in the TiO 2 content. EPR spectroscopy can be used to assess the effectiveness of iron removal techniques and the EPR spectral data of the samples also support the above findings. In the present work, FSCP and FSCP-DCBTP samples have been studied by EPR spectroscopy to understand the removal of “free iron” by DCB treatment. The EPR spectra of the corresponding samples are given in Figure 7. Both the samples exhibited EPR lines at F1 and F2 regions, but these lines are found to be weak in nature. Sharper lines are observed in the F1 region ( g ~4.83 & 4.25) for FSCP sample with a more intense line at g~ 2.54 along with g~2.02 line. The intense line atg~2.54 indicate the presence of “free iron” impurities. In the case of FSCP DCBTP sample, the intensity of this line (at g ~2.56) has decreased considerably, thus confirming the removal of free iron contaminants by DCBT. The reduction in iron content and the sharp improvement in brightness of the sample support the findings. Chemical assay and XRD analysis shows that the EPR silent pyrite is the major iron impurity in the clay. The other lines in the F1 region of the spectra are found to be sharper. Both the lines at Fe (I) & Fe (II) sites in F1 region are due to Fe +3 substituting for Al +3 in the kaolinite lattice but they have different symmetry.  1020 S. Ramaswamy and P. Raghavan Vol.10, No.11 Figure 7. EPR spectra of (a) FSCP and (b) FSCP DCBTP samples 3.4. Significance of Identification and Quantification of the Impurity Minerals All the above observations and inferences have really played a crucial role in incorporating the required modifications in the conventional beneficiation flow sheet (Figure 8). In the modified process flow sheet (Figure 9), the conventional high speed stirring was replaced with low speed mixing in order to avoid the breaking down of the coarse pyrite particles and their spreading to the finer size ranges. Also an additional operation of water washing technique (three consecutive washes) involving a set of operations ie., water addition, mild mixing, settling of the clay mass and decanting the coloured supernatant liquid was introduced before size separation to remove the water soluble colouring species. After removing the water soluble colouring impurities, the kaolin can be value added by employing techniques like hydrocycloning followed by reductive bleaching using suitable reducing agents like sodium dithionite. In nutshell, the identification and  Vol.10, No.11 Significance of Impurity Mineral Identification 1021 quantification of the impurity mineral species has played an important role in the selection/modification and sequentialisation of beneficiation process. Raw clay Mixing with water Stirring at high rpm for max. de-aggregation Screening/ size separation using a Set of Hydrocyclones Drying Figure 8. Conventional Flow sheet for size separation of Kaolin Final Size classified Product (FSCP)  1022 S. Ramaswamy and P. Raghavan Vol.10, No.11 Raw clay Water addition Mild Mixing (at low rpm for de-aggregation) (to avoid size reduction of coarse pyrite particles) W 1 W 2 W 3 pH modification using NaOH solution (to neutral pH) Screening/ size separation using a set of hydrocyclones Drying Dried Final Product Figure 9. Modified flow sheet for size separation of Koraput Kaolin W1, W2 & W3 – First, Second & Third “water wash” respectively. “Water wash” consists of settling of the clay mass, decantation of the coloured supernatant liquid and water addition with mild mixing. Final Size classified Product (FSCP)  Vol.10, No.11 Significance of Impurity Mineral Identification 1023 3.5. Evaluation of Properties of the Beneficiated Samples Beneficiation of the samples was carried out after incorporating the necessary modifications in the conventional process flow sheet based on the nature and quantity of the impurity species. Water washing, screening and size classification were effective in removing water soluble colouring impurities and most of the pyrite and coarse particles in the sample. This increased the kaolinite content in the sample and led to the enrichment of fines to 73.9% from 49.9% (Table 1). The rational analysis data also supports these findings. Brightness and “L a b” color components are influenced by iron minerals and iron bearing anatase. Iron decreases brightness and “L” values whereas anatase increases “b” to cause yellowness. The brightness, lightness (L) and Hunter whiteness (HW) values of raw sample are found to be very poor due to the presence of black/dark coloured particles in the clay. Size classification increases the brightness of samples appreciably ie., by 22.3 (SCP1) and 24.6 (SCP2) units. Similarly, there is a sharp increase in the lightness “L” value (~21 units) and moderate increase in the “HW” (~11 and 16 units for SCP1 and FSCP respectively) of the beneficiated samples which are due to the removal of the black colored pyrite impurities. The appreciable reduction in the iron content of SCP1 and FSCP also supports the same (Table 1). DCB treatment improves the brightness substantially (~13.0 units) and during this process the iron content reduces from 0.81% to 0.35%, indicating that part of the iron in the sample is “free” and leachable. 4. CONCLUSIONS a) The sample taken for the present study is kaolinitic in nature and found to contain different types of impurity mineral species. b) Characterization studies showed that the major impurity mineral species in the sample is pyrite (Iron sulphide) along with minor ancillary minerals such as goethite, lepidocrocite, maghemite, ilmenite, hematite, rutile, anatase and pseudo rutile. Presence of water soluble colouring iron species like limonite is also detected. c) Most of the “pyritic” particles in the sample” is found to be in coarse size ranges. d) The basic information about the type and nature of the impurity minerals present in the kaolin have really played a crucial role in incorporating the required modifications in the conventional beneficiation flow sheet. This shows that the identification and quantification of the impurity mineral species has got an important role to play in the selection/modification and sequentialisation of beneficiation processes. e) Evaluation of the properties (chemical assay, particle size distribution and brightness) of the product sample has shown that the sample can be value added to ceramic grade.  1024 S. Ramaswamy and P. Raghavan Vol.10, No.11 ACKNOWLEDGEMENTS The authors are thankful to the Director, NIIST, Trivandrum for his permission to communicate this work. They are also grateful to Dr.Peter Koshy for providing SEM pictures and Dr.Syamaprasad and Mr.Gurusamy for providing the X-ray diffraction analysis data of the samples. Thanks are also due to Prof. Storr of the Univ.of Greifswald, Germany for the HRTEM- EDS results. The authors are also thankful to Dr.Mohapatra, IIMT, Bhubaneswar for the EPMA pictures; Dr.Sambasiva Rao, University of Pondicherry for the EPR spectra and Dr.Tripathi, JNV University, Jodhpur for the Mossbauer spectral data. REFERENCES [1] Jepson, W.B., 1988. Structural iron in kaolinites and in associated ancillary minerals, In : Iron in Soils and Clay Minerals (J.W.Stucki, B.A.Goodman and U.Schwertmann, editors). NATO Advanced Science Institutes Series, D.Riedel Publishing Company, Dordrecht, Holland, pp. 467-53 [2] Cases J.M., Lietard O., Yvon J. and Delon J.F., 1982. Etude des properties crystallographiques, morphologiques et superficielles de kaolinites desordonnees, Bull. Soc. Fr. Min. Crist., 105, pp. 439-457 [3] Cases J.M.l, Cunin P.,Grillet Y., Poinsingnon C. and Yvon J., 1986). Methods of analyzing morphology of kaolinite : relations between crystallographic and morphological properties. Clay Minerals, 21, pp. 55-68 [4] Brindley, G.W., Kao,C.C., Harrison, J.L., Lipsicas, M., and Raythata, R.,1986. Relation between structural and other characteristics of kaolinite and dickite. Clay and Clay Minerals, 34, pp. 239-249 [5] Komusinski J., Stoch L. and Dubiel S.M., 1981. Application of election paramagnetic and Mossbauer spectroscopy in the investigation of kaolin group minerals, Clays and Clay Minerals, 29, pp. 23-30 [6] Balan A., Allard T., Biozot, B., Morin G. and Muller J.P., 2000. Quantitative measurement of paramagnetic Fe +3 in kaolinite. Clays and Clay Minerals, 48, pp. 439 [7] Lazarev A.N., 1974). The dynamics of crystal lattices, in The Infrared Spectra of Minerals (ed. V.C.Farmer), Mineralogical Society, London, pp. 69-86 [8] Rendon J.L and Serna C.J., 1981. IR spectra of powder Hematite; effects of particle size and shape, Clay Minerals, 16, pp. 375-382 [9] Weaver C.E., 1976. The nature of TiO2 in in kaolinite, Clays and Clay Minerals, 24, pp. 215- 218 [10] Jepson W.B and and Rowse J.B., 1975. The composition of kaolinite – an electron microprobe study, Clays and Clay Minerals, 23, pp. 310-317 [11] Singh, B. and Gilkes, R.J., 1992. Properties and distribution of iron oxides and their association with minor elements in the soils of south-western Australia. Journal of Soil  Vol.10, No.11 Significance of Impurity Mineral Identification 1025 Science, 43, pp. 77-98 [12] Mehra, O.P., Jackson M.L., 1960. Fe Oxide removal from soil and clays by a dithionite- citrate system buffered with sodium carbonate. Clays and Clay Minerals, 7, pp. 317-327 [13] Bennett H and Reed R.A., 1971. Chemical methods of silicate analysis. A handbook Academic Press Ind., London, pp. 272 [14] Searle, A.B., Grimshaw, R.W., 1960. Chemistry and Physics of Clays. Western Printing Services Ltd., Bristol, UK. pp. 944 [15] Jeffery et al G.H., Bassett J., Mendham J. and Denney R.C.(1989),Vogel’s Text book of Quantitative Chemical Analysis, 741, John Wiley and Sons, USA [16] Dold B., Fontbote, L., 2000. A mineralogical and geochemical study of element mobility in sulfide mine tailings of ‘Fe’ oxide cu-au deposits from the Punta del Cobre belt, northern Chile. Chemical Geology 189 (3), pp. 135-163 [17] Foth H. D., Ellis B.G., 1996. Soil Fertility, Lewis Publishers, CRC Press, Inc. New York, pp.25-31 [18] Fysh S.A., Cashion J.D. and Clark P.E., 1983. Mossbauer Effect studies on iron in kaolin.I, Structural iron, Clays and Clay Minerals, 31, pp.285-292 [19] Ruby C., Refait PH., Genin J.M.R., Delineau T. and Yvon J., 1999. Evidence of structural Fe(II) ions in Font-Bouillant kaolinites : a Mossbauer study, Clay Minerals, 34, pp.515-518 |