Paper Menu >>
Journal Menu >>
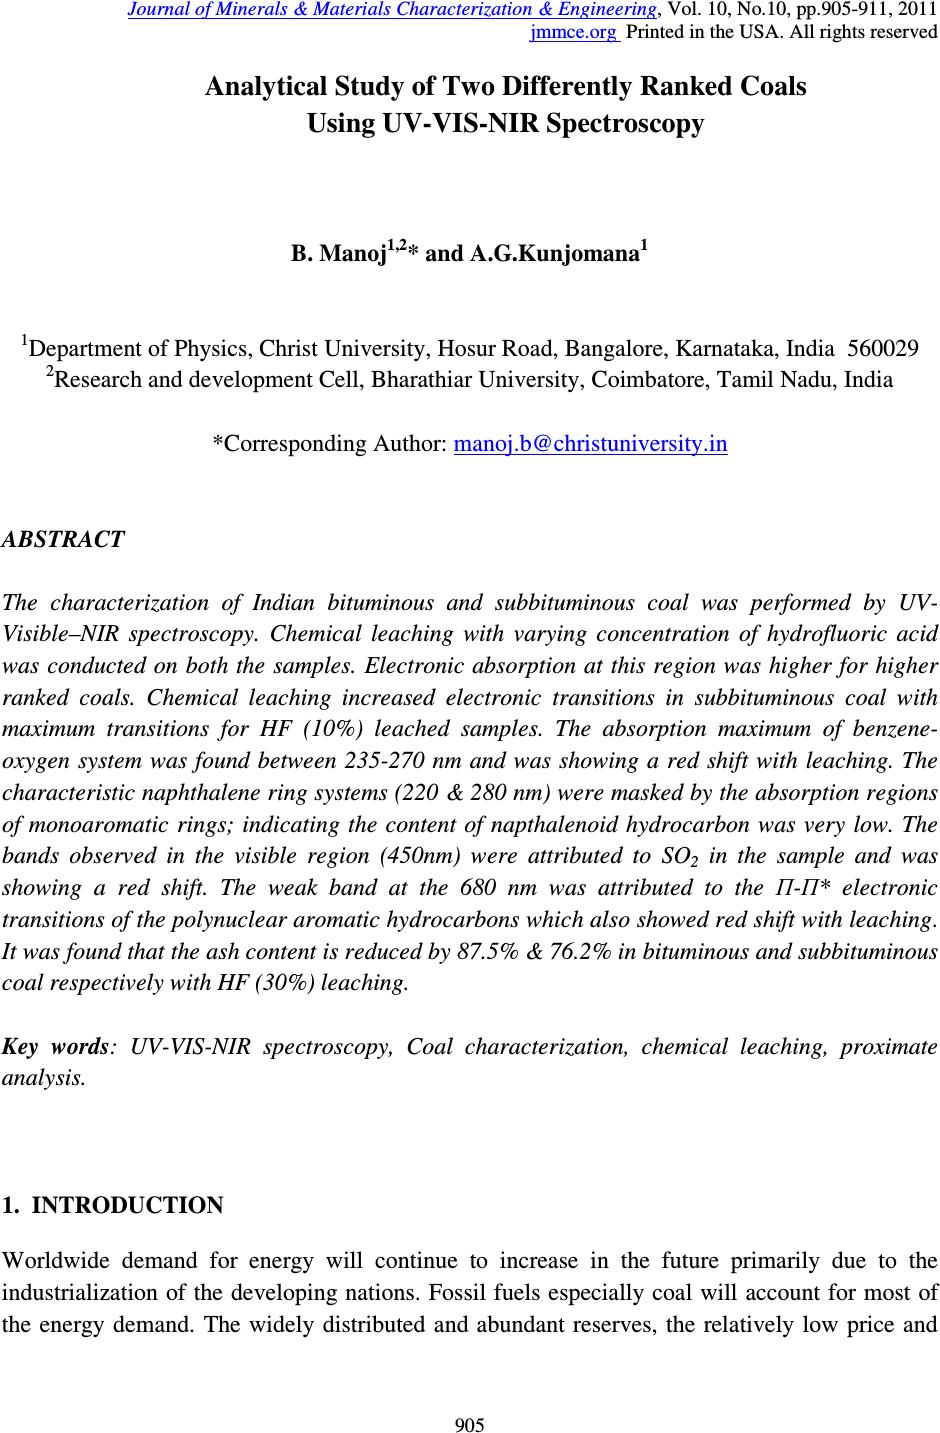 Journal of Minerals & Materials Characterization & Engineering, Vol. 10, No.10, pp.905-911, 2011 jmmce.org Printed in the USA. All rights reserved 905 Analytical Study of Two Differently Ranked Coals Using UV-VIS-NIR Spectroscopy B. Manoj 1,2 * and A.G.Kunjomana 1 1 Department of Physics, Christ University, Hosur Road, Bangalore, Karnataka, India 560029 2 Research and development Cell, Bharathiar University, Coimbatore, Tamil Nadu, India *Corresponding Author: manoj.b@christuniversity.in ABSTRACT The characterization of Indian bituminous and subbituminous coal was performed by UV- Visible–NIR spectroscopy. Chemical leaching with varying concentration of hydrofluoric acid was conducted on both the samples. Electronic absorption at this region was higher for higher ranked coals. Chemical leaching increased electronic transitions in subbituminous coal with maximum transitions for HF (10%) leached samples. The absorption maximum of benzene- oxygen system was found between 235-270 nm and was showing a red shift with leaching. The characteristic naphthalene ring systems (220 & 280 nm) were masked by the absorption regions of monoaromatic rings; indicating the content of napthalenoid hydrocarbon was very low. The bands observed in the visible region (450nm) were attributed to SO 2 in the sample and was showing a red shift. The weak band at the 680 nm was attributed to the П-П* electronic transitions of the polynuclear aromatic hydrocarbons which also showed red shift with leaching. It was found that the ash content is reduced by 87.5% & 76.2% in bituminous and subbituminous coal respectively with HF (30%) leaching. Key words: UV-VIS-NIR spectroscopy, Coal characterization, chemical leaching, proximate analysis. 1. INTRODUCTION Worldwide demand for energy will continue to increase in the future primarily due to the industrialization of the developing nations. Fossil fuels especially coal will account for most of the energy demand. The widely distributed and abundant reserves, the relatively low price and 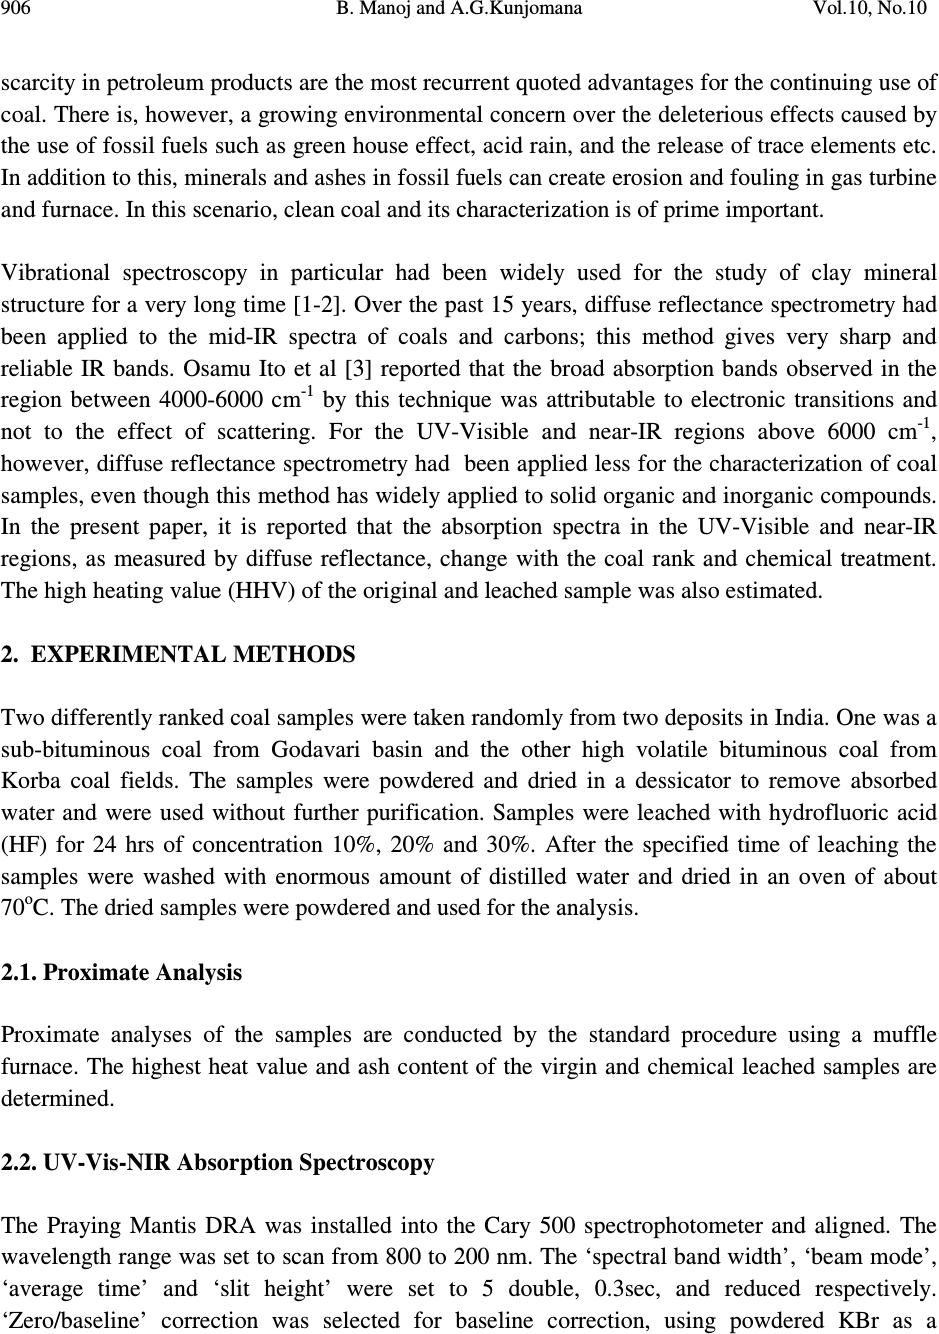 906 B. Manoj and A.G.Kunjomana Vol.10, No.10 scarcity in petroleum products are the most recurrent quoted advantages for the continuing use of coal. There is, however, a growing environmental concern over the deleterious effects caused by the use of fossil fuels such as green house effect, acid rain, and the release of trace elements etc. In addition to this, minerals and ashes in fossil fuels can create erosion and fouling in gas turbine and furnace. In this scenario, clean coal and its characterization is of prime important. Vibrational spectroscopy in particular had been widely used for the study of clay mineral structure for a very long time [1-2]. Over the past 15 years, diffuse reflectance spectrometry had been applied to the mid-IR spectra of coals and carbons; this method gives very sharp and reliable IR bands. Osamu Ito et al [3] reported that the broad absorption bands observed in the region between 4000-6000 cm -1 by this technique was attributable to electronic transitions and not to the effect of scattering. For the UV-Visible and near-IR regions above 6000 cm -1 , however, diffuse reflectance spectrometry had been applied less for the characterization of coal samples, even though this method has widely applied to solid organic and inorganic compounds. In the present paper, it is reported that the absorption spectra in the UV-Visible and near-IR regions, as measured by diffuse reflectance, change with the coal rank and chemical treatment. The high heating value (HHV) of the original and leached sample was also estimated. 2. EXPERIMENTAL METHODS Two differently ranked coal samples were taken randomly from two deposits in India. One was a sub-bituminous coal from Godavari basin and the other high volatile bituminous coal from Korba coal fields. The samples were powdered and dried in a dessicator to remove absorbed water and were used without further purification. Samples were leached with hydrofluoric acid (HF) for 24 hrs of concentration 10%, 20% and 30%. After the specified time of leaching the samples were washed with enormous amount of distilled water and dried in an oven of about 70 o C. The dried samples were powdered and used for the analysis. 2.1. Proximate Analysis Proximate analyses of the samples are conducted by the standard procedure using a muffle furnace. The highest heat value and ash content of the virgin and chemical leached samples are determined. 2.2. UV-Vis-NIR Absorption Spectroscopy The Praying Mantis DRA was installed into the Cary 500 spectrophotometer and aligned. The wavelength range was set to scan from 800 to 200 nm. The ‘spectral band width’, ‘beam mode’, ‘average time’ and ‘slit height’ were set to 5 double, 0.3sec, and reduced respectively. ‘Zero/baseline’ correction was selected for baseline correction, using powdered KBr as a 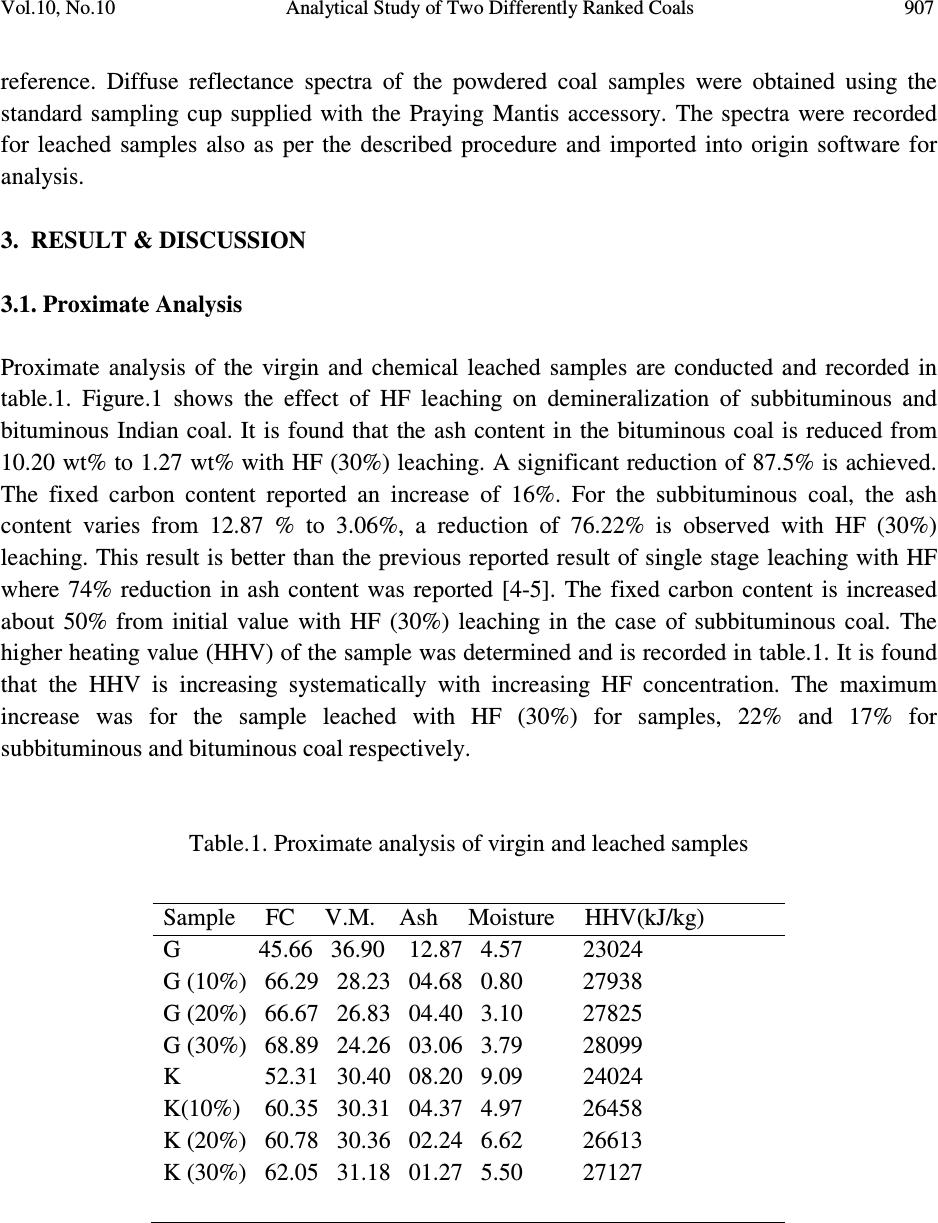 Vol.10, No.10 Analytical Study of Two Differently Ranked Coals 907 reference. Diffuse reflectance spectra of the powdered coal samples were obtained using the standard sampling cup supplied with the Praying Mantis accessory. The spectra were recorded for leached samples also as per the described procedure and imported into origin software for analysis. 3. RESULT & DISCUSSION 3.1. Proximate Analysis Proximate analysis of the virgin and chemical leached samples are conducted and recorded in table.1. Figure.1 shows the effect of HF leaching on demineralization of subbituminous and bituminous Indian coal. It is found that the ash content in the bituminous coal is reduced from 10.20 wt% to 1.27 wt% with HF (30%) leaching. A significant reduction of 87.5% is achieved. The fixed carbon content reported an increase of 16%. For the subbituminous coal, the ash content varies from 12.87 % to 3.06%, a reduction of 76.22% is observed with HF (30%) leaching. This result is better than the previous reported result of single stage leaching with HF where 74% reduction in ash content was reported [4-5]. The fixed carbon content is increased about 50% from initial value with HF (30%) leaching in the case of subbituminous coal. The higher heating value (HHV) of the sample was determined and is recorded in table.1. It is found that the HHV is increasing systematically with increasing HF concentration. The maximum increase was for the sample leached with HF (30%) for samples, 22% and 17% for subbituminous and bituminous coal respectively. Table.1. Proximate analysis of virgin and leached samples Sample FC V.M. Ash Moisture HHV(kJ/kg) G 45.66 36.90 12.87 4.57 23024 G (10%) 66.29 28.23 04.68 0.80 27938 G (20%) 66.67 26.83 04.40 3.10 27825 G (30%) 68.89 24.26 03.06 3.79 28099 K 52.31 30.40 08.20 9.09 24024 K(10%) 60.35 30.31 04.37 4.97 26458 K (20%) 60.78 30.36 02.24 6.62 26613 K (30%) 62.05 31.18 01.27 5.50 27127  908 B. Manoj and A.G.Kunjomana Vol.10, No.10 Figure 1. Effect of chemical leaching on ash content 3.2 UV-Vis-NIR Spectrum The electronic absorption spectrum of various coal powders had been measured by diffuse reflectance spectrometry in the UV-Visible and NIR regions and was shown in Figure.2 and Figure.3. The electronic absorption spectra of sub-bituminous and bituminous coal were measured by the diffuse reflectance spectrometry in the UV-Visible and near IR regions (200- 800 nm). The molecular moieties likely to absorb light in the 200 to 800 nm region were Pi- electron functions and hetro atoms having non-bonding valence shell electron pairs. Such light absorbing groups are referred to as chromophores. Some chromophores like in C=O, n →П* transitions gave rise to λ max at 290 nm and N=O (n → П*) transition at 275 nm. The presence of chromophores in a molecule was best documented by UV-Visible spectroscopy. In the measured spectra (Figure 2 and Figure 3) the σ band (260-270 nm) had defined structure. This absorption increases with leaching with strong absorption for HF leached samples. The general shape of the spectrum was characteristic for hydrocarbons with a single benzene ring. The presence of napthalenoid hydrocarbons would show up in the spectrum and could be judged qualitatively only in the 320 nm regions, where benzoid hydrocarbon give practically no absorption of UV radiation. The two principal bands that were the characteristic for the naphthalene system (220 & 280 nm) were masked by the absorption regions of monoaromatic rings; this indicated that the content of napthalenoid hydrocarbon was very low [1-7].The absorption maximum of benzene- oxygen (1/1) system was found between 240-270 nm. This was due to the benzene –oxygen charge transfer band and was showing a red shift with leaching. The two common transitions of isolated carbonyl groups are n→p* transition was lower in energy ( λ max =290 nm) than the p-p* transition (λ max = 180 nm), but the excitation of former is thousand times smaller than the latter. From the spatial distribution of these orbitals it was clear that, the n-orbitals did not overlap at all well with the p* orbital, so the probability of excitation was small. 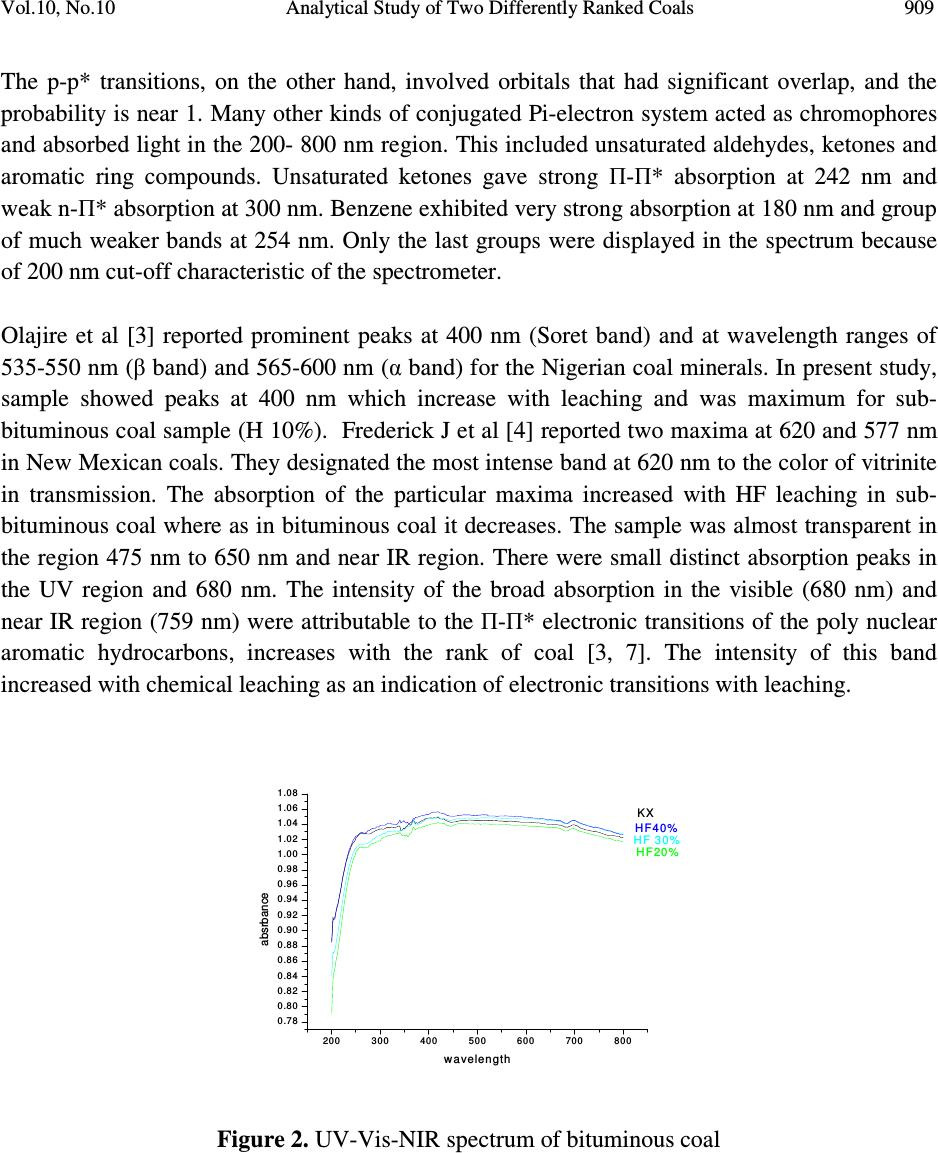 Vol.10, No.10 Analytical Study of Two Differently Ranked Coals 909 The p-p* transitions, on the other hand, involved orbitals that had significant overlap, and the probability is near 1. Many other kinds of conjugated Pi-electron system acted as chromophores and absorbed light in the 200- 800 nm region. This included unsaturated aldehydes, ketones and aromatic ring compounds. Unsaturated ketones gave strong П-П* absorption at 242 nm and weak n-П* absorption at 300 nm. Benzene exhibited very strong absorption at 180 nm and group of much weaker bands at 254 nm. Only the last groups were displayed in the spectrum because of 200 nm cut-off characteristic of the spectrometer. Olajire et al [3] reported prominent peaks at 400 nm (Soret band) and at wavelength ranges of 535-550 nm (β band) and 565-600 nm (α band) for the Nigerian coal minerals. In present study, sample showed peaks at 400 nm which increase with leaching and was maximum for sub- bituminous coal sample (H 10%). Frederick J et al [4] reported two maxima at 620 and 577 nm in New Mexican coals. They designated the most intense band at 620 nm to the color of vitrinite in transmission. The absorption of the particular maxima increased with HF leaching in sub- bituminous coal where as in bituminous coal it decreases. The sample was almost transparent in the region 475 nm to 650 nm and near IR region. There were small distinct absorption peaks in the UV region and 680 nm. The intensity of the broad absorption in the visible (680 nm) and near IR region (759 nm) were attributable to the П-П* electronic transitions of the poly nuclear aromatic hydrocarbons, increases with the rank of coal [3, 7]. The intensity of this band increased with chemical leaching as an indication of electronic transitions with leaching. 200 300 400 500 600 700 800 0.78 0.80 0.82 0.84 0.86 0.88 0.90 0.92 0.94 0.96 0.98 1.00 1.02 1.04 1.06 1.08 KX HF 30% H F 40 % H F 20 % absrbance w a ve le n gth Figure 2. UV-Vis-NIR spectrum of bituminous coal  910 B. Manoj and A.G.Kunjomana Vol.10, No.10 200 300 400 500600 700 800 0 .8 2 0 .8 4 0 .8 6 0 .8 8 0 .9 0 0 .9 2 0 .9 4 0 .9 6 0 .9 8 1 .0 0 1 .0 2 1 .0 4 1 .0 6 1 .0 8 HF 1 0 % HF 4 0 % HF 3 0 % G X absorb ance wav ele n g th Figure 3. UV-Vis-NIR spectrum of sub-bituminous coal sample In the absorption spectra, small spikes were observed at between 350-400 nm and 450 nm. This was assigned to sulphur dioxide (SO 2 ) in the sample [9]. The absorption of this spikes increases with HF leaching and was generally showing a shift towards higher wavelength in the case of sub-bituminous coal compared to bituminous coal. This red shift in the wavelength was an indication of decrease of absorption with leaching. Maximum absorption was shown by sample leached with HF 10% in the case of subbituminous coal (Figure.3) and in the case of bituminous coal HF 40% is showing maximum increase. For HF 30% and 20% absorbance was less. Osamu Ito [3,10] reported that the absorption spectra in the UV-Visible and near-IR regions, as measured by diffuse reflectance, change with the rank of coal. With HF leaching absorption in both samples were showing a shift to higher wavelength. This might be due to the change in chemical environment of the organic molecule. The electron-releasing groups increased both the wavelength and the intensity of the secondary absorption band. 4. CONCLUSIONS In the measured spectra, the σ band (260- 270 nm) had defined structure. This part of the spectrum was characteristic for hydrocarbons with single benzene ring. The characteristic bands of naphthalene ring system (220 and 280 nm) were masked by the absorption regions of the monoaromatic rings; indicating the content of napthalenoid was very low. The band in the region 680 nm was attributed to the П-П* electronic transitions of the polynuclear aromatic hydrocarbons. Intensity of this band increases with chemical leaching was an indication of increase of electronic transitions with leaching. The weak bands observed in the visible region (450 nm) were due to the presence of SO 2 in the sample and was showing a red shift with HF leaching. The electron releasing groups increases both the wavelength and intensity of the secondary absorption band. It was found that the ash content is reduced by 87.5% & 76.2% in bituminous and subbituminous coal respectively with HF (30%) leaching  Vol.10, No.10 Analytical Study of Two Differently Ranked Coals 911 REFERENCES 1. Lazarev, A.N.,1972. “Vibrational Spectra and Structure of Silicates” Newyork: Plenum Press, pp.123-124. 2. Farmer, V.C., 1974. “The layer silicates:Ch 15. The Infrared Spectra of Minerals” Farmer,V.C. (Eds),London: Mineralogical Society, pp.331-363. 3. Osamu Ito., 1992. “Diffuse Reflectance Spectra of Coals in the UV-Visble and NIR regions” Energy and Fuels,Vol.6, pp.662-665 4. Manoj.B., Kunjomana.A.G.,2010.”Chemical Solubilization of Coal Using HF and Characterization of the Products by FTIR, FT Raman, SEM and Elemental Analysis”, J. of Minerals and Materials Characterization &Engineering, Vol.9 No.10, pp.919-928. 5. Wu.Z., Steel.K.M.,2007. “ Demineralization of a UK bituminous coal using HF and Ferric ions” Fuel, Vol.86.pp.2194-2200. 6. Siryuk, A.G., Radchenko, F.D., Fernandes-Games,M.M.,1979.”Analysis of Aromatic Hydrocarbons in Fuels by means of UV Absorption Spectra” Chemistry and Tech. of Fuels and oils, Vol.15, No. 7,pp. 530-534. 7. Satoshi Hashimoto., Hajime Akimoto,1989.”UV Absorption Spectra and Photochemical Reactions of simple aromatic Hydrocarbons in the Cryogenic Oxygen Matrix” J.Phys.Chem, Vol. 93, No.2. pp.571-577. 8. Olajire,A.A., AmeenA.B., Abdlil-Hammed,M., Adek2la, F.A.,2007.”Occurrence and Distribution of Metals and Porhyrins in Nigerian Coal Minerals” Journal of Fuel chemistry and technology, Vol.35, No.6, pp.641-647. 9. Frederick J.Kuellmes, Frank Kimbler and Janet Nuter, 1983. “ Preliminary report on the Diffuse Reflectivity of Some New Mexico Coals” Int.National Journal of Coal geology, Vol.2, No.2, pp. 261-277. 10. Osamu Ito,1993. “UV-Visble and Near-IR Spectra of Heat-Treated Pitches during Mesphase Formation” Carbon, Vol.31, No.3, pp. 401-406. |