Paper Menu >>
Journal Menu >>
 Journal of Minerals & Materials Characterization & Engineering, Vol. 10, No.9, pp.855-863, 2011 jmmce.org Printed in the USA. All rights reserved 855 Mineralogical Characterization of Kuru Cassiterite Ore by SEM-EDS, XRD and ICP Techniques 1 Martin Ogwuegbu, *1 Gerald Onyedika, 2 Jiann-Yang Hwang, 1 Asuwaji Ayuk, 2 Zhiwei Peng, 2 Bowen Li, 1 Ejike, E.N.O. and 2 Matt Andriese 1 Department of Chemistry, Federal University of Technology,P.M.B. 1526, Owerri , Nigeria. 2 Materials Science and Engineering, Michigan Technological University, 1400 Townsend Dr., Houghton , Michigan, U.S.A. *Correspondence author: gonyedik@mtu.edu ABSTRACT The morphology and elemental characteristics of Kuru Cassiterite ore deposit was performed by the combination of different instruments. This is vital to obtain accurate mineralogical, surface properties and compositions of the ore. Mineral particles were prepared on epoxy resin, polished and analyzed by a SEM coupled with an EDS. X- ray diffraction showed that the ore contained different minerals of cassiterite, coffinite, siderophyllite,ilmenite, qartz, rutile, manganocolumbite, zircon, tilleyite and monazite. Further quantitative analysis using inductive coupled plasma – optical emission spectrometry gave the elemental analysis as follows; Sn (28.0%), Si (5.5%), Fe (5.16%),Ti (3.51%), Al (2.48%), Y (1.06%), and Nb (2.53%). The other trace elements found include Mn, K, Na, Mg, La, Ce, U and Ca. The ICP-OES data was correlated with the XRD data obtained using the Guassian Pro 8.1 origin software and it showed significant correlation. Key words: Cassiterite, Mineral phase, ore, characterization 1. INTRODUCTION Tin occurs in Nigeria in the form of casiterite with varying amounts of assoiated mnerals [1]. The major sources of ore bearing cassiterite in Nigeria are the alluvial and eluvial deposits from the biotite granites within the jurssic alkaline ring complex of the Jos Plateau. Moreso, less than 5 % of the total production has been recovered from the pegmatits within the largely Precambrian basement complex consisting of magnesites, gneisses, but with the rapidly depleting reserves [2]. Figure 1 shows the map of Kuru , a typical mining area, 20 Km away from Jos. Tin mining in Nigeria is over 100 years old. Prior to 1975, Nigeria was a major tin exporter of casiterite concentrates which peaked at about 11,000 tonnes. Their has been a  856 Martin Ogwuegbu, et al Vol.10, No.9 dramatic declne to about 2000 tonnes. Among the factors accounting for the collapse of this tin industry include the inaccssiblilty of placer deposits and the current prohibitive cost of mining the ores beneath the basalt flows of Jos [3]. In the nineties, theavailable techniques used for ore analysis in Nigeria is the solution methods of either fusion or acid digestion [4]. These were believed to report low data due to incomplete solubilization of the ore minerals in aqeous medium [5]. This has resulted in large number of tailing dumps. The residues contain tin ores and other heavy metals which today could be extracted as ehe prize of tin has risen to $23,300 per tonne, ranking more than Nickel [6].Presently, several attempts has been made to correct the analytical deficiency. Either one or sometimes two are employed [4,7,8]. In each of these, either the elemental analysis was carried out or just the phase analysis which provides incomplete information about the ore. This work is aimed at characterizing a typical Nigerian ore with different modern instruments for the purpose of compositional elucidation and documentation. Consequently, the primary objective is to provide comprehensive data about the physical and chemical characteristics of a typical Nigeria cassiterite ore. These include mineral morphology, phase analysis, elemental composition and degree of liberation, with a view to finding out and understanding the best possible practice or extraction route by which tin could possibly be extracted. 2. MATERIALS AND METHOD 2.1 Sample Preparation Cassiterite ore weighing 3.0kg was collected from Kuru mining site through the National Metallurgical Development Center, (NMDC), Jos, Nigeria. The ore was dried in the sun and ground using the crusher. The sample was seived using seive sizes of ASTM of 850 µm, 425 µm and 212 µm. All the samples used for the various analysis was obtained by quatering techniques. 2.2 Scanning Electron Microscopy (SEM) The representative sample was prepared using epoxy resins, polished and made conductive by carbon coating in a Dentom vacuum, DV-502A. The morphology of the cassiterite ore was analyzed in a JEOL JSM-6400 scanning electron microscope at accelerating voltage of 20KVA, realtime of 21-36 and livetime of 60 seconds. It was configured with an ultra thin window energy dispersive X-ray spectrometry, three WDS spectrometers and a Geller dSpec automation system controlling the spectrometers and motorized stage. Images were made using the back scattering electron detectors. The chemical elements of the sample was determined by the EDS. The images were shown with point analysis at the positions of the ore particles. 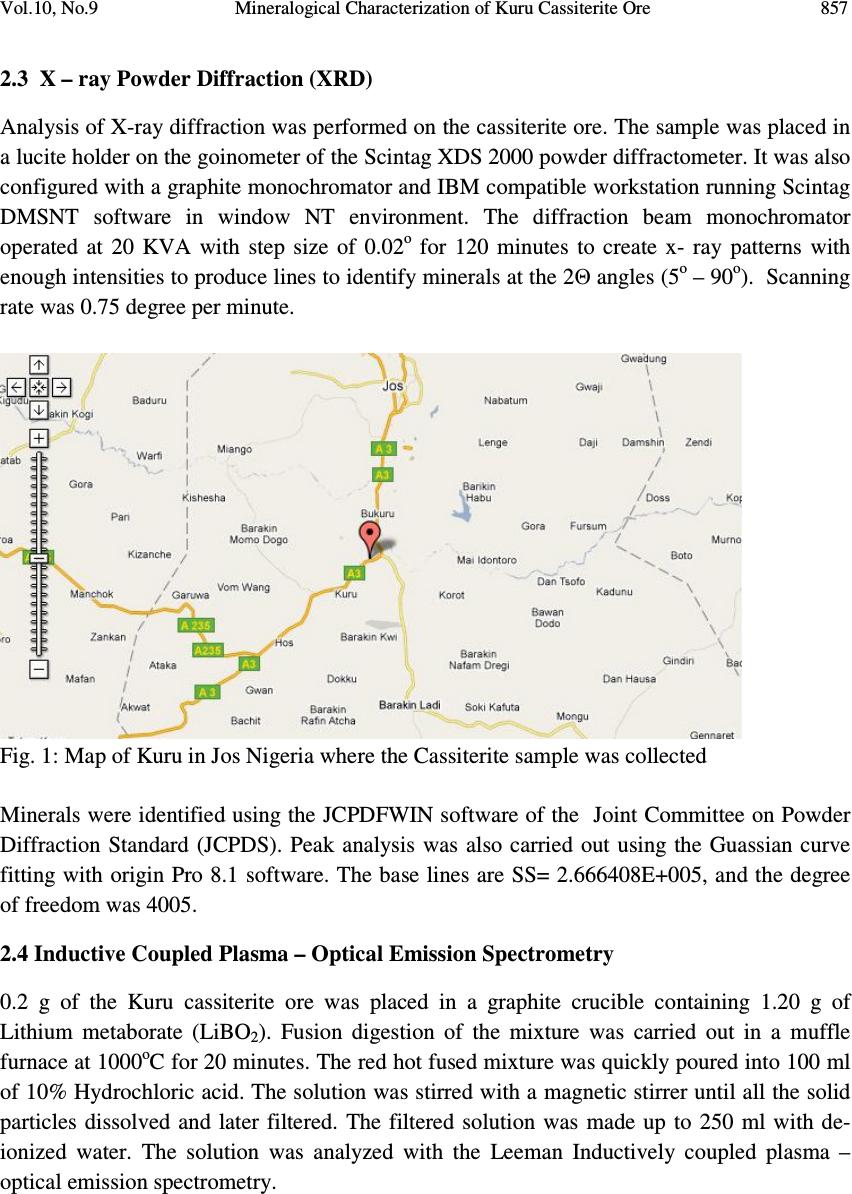 Vol.10, No.9 Mineralogical Characterization of Kuru Cassiterite Ore 857 2.3 X – ray Powder Diffraction (XRD) Analysis of X-ray diffraction was performed on the cassiterite ore. The sample was placed in a lucite holder on the goinometer of the Scintag XDS 2000 powder diffractometer. It was also configured with a graphite monochromator and IBM compatible workstation running Scintag DMSNT software in window NT environment. The diffraction beam monochromator operated at 20 KVA with step size of 0.02 o for 120 minutes to create x- ray patterns with enough intensities to produce lines to identify minerals at the 2Θ angles (5 o – 90 o ). Scanning rate was 0.75 degree per minute. Fig. 1: Map of Kuru in Jos Nigeria where the Cassiterite sample was collected Minerals were identified using the JCPDFWIN software of the Joint Committee on Powder Diffraction Standard (JCPDS). Peak analysis was also carried out using the Guassian curve fitting with origin Pro 8.1 software. The base lines are SS= 2.666408E+005, and the degree of freedom was 4005. 2.4 Inductive Coupled Plasma – Optical Emission Spectrometry 0.2 g of the Kuru cassiterite ore was placed in a graphite crucible containing 1.20 g of Lithium metaborate (LiBO 2 ). Fusion digestion of the mixture was carried out in a muffle furnace at 1000 o C for 20 minutes. The red hot fused mixture was quickly poured into 100 ml of 10% Hydrochloric acid. The solution was stirred with a magnetic stirrer until all the solid particles dissolved and later filtered. The filtered solution was made up to 250 ml with de- ionized water. The solution was analyzed with the Leeman Inductively coupled plasma – optical emission spectrometry. 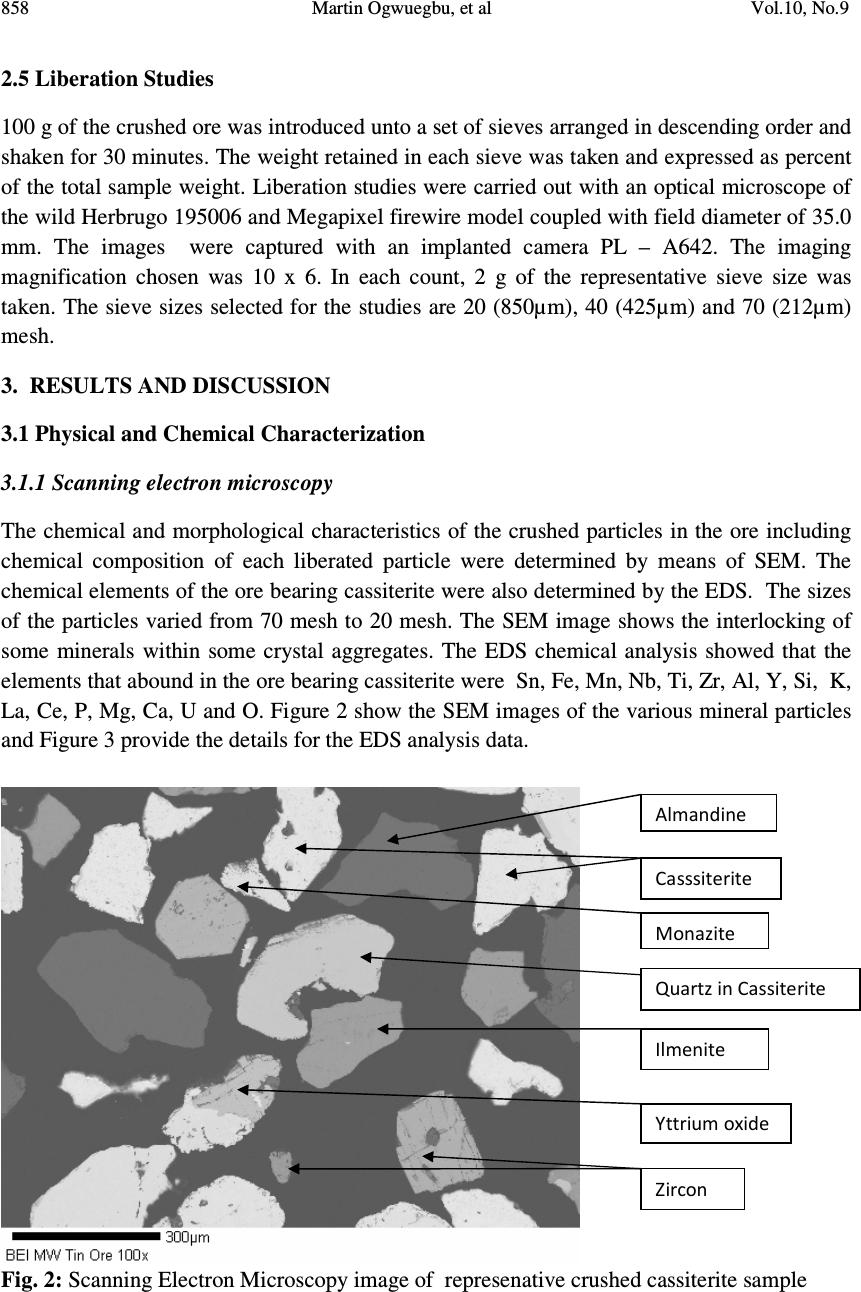 858 Martin Ogwuegbu, et al Vol.10, No.9 2.5 Liberation Studies 100 g of the crushed ore was introduced unto a set of sieves arranged in descending order and shaken for 30 minutes. The weight retained in each sieve was taken and expressed as percent of the total sample weight. Liberation studies were carried out with an optical microscope of the wild Herbrugo 195006 and Megapixel firewire model coupled with field diameter of 35.0 mm. The images were captured with an implanted camera PL – A642. The imaging magnification chosen was 10 x 6. In each count, 2 g of the representative sieve size was taken. The sieve sizes selected for the studies are 20 (850µm), 40 (425µm) and 70 (212µm) mesh. 3. RESULTS AND DISCUSSION 3.1 Physical and Chemical Characterization 3.1.1 Scanning electron microscopy The chemical and morphological characteristics of the crushed particles in the ore including chemical composition of each liberated particle were determined by means of SEM. The chemical elements of the ore bearing cassiterite were also determined by the EDS. The sizes of the particles varied from 70 mesh to 20 mesh. The SEM image shows the interlocking of some minerals within some crystal aggregates. The EDS chemical analysis showed that the elements that abound in the ore bearing cassiterite were Sn, Fe, Mn, Nb, Ti, Zr, Al, Y, Si, K, La, Ce, P, Mg, Ca, U and O. Figure 2 show the SEM images of the various mineral particles and Figure 3 provide the details for the EDS analysis data. Fig. 2: Scanning Electron Microscopy image of represenative crushed cassiterite sample Casssiterite Monazite Quartz in Cassiterite Ilmenite Yttrium oxide Zircon Almandine 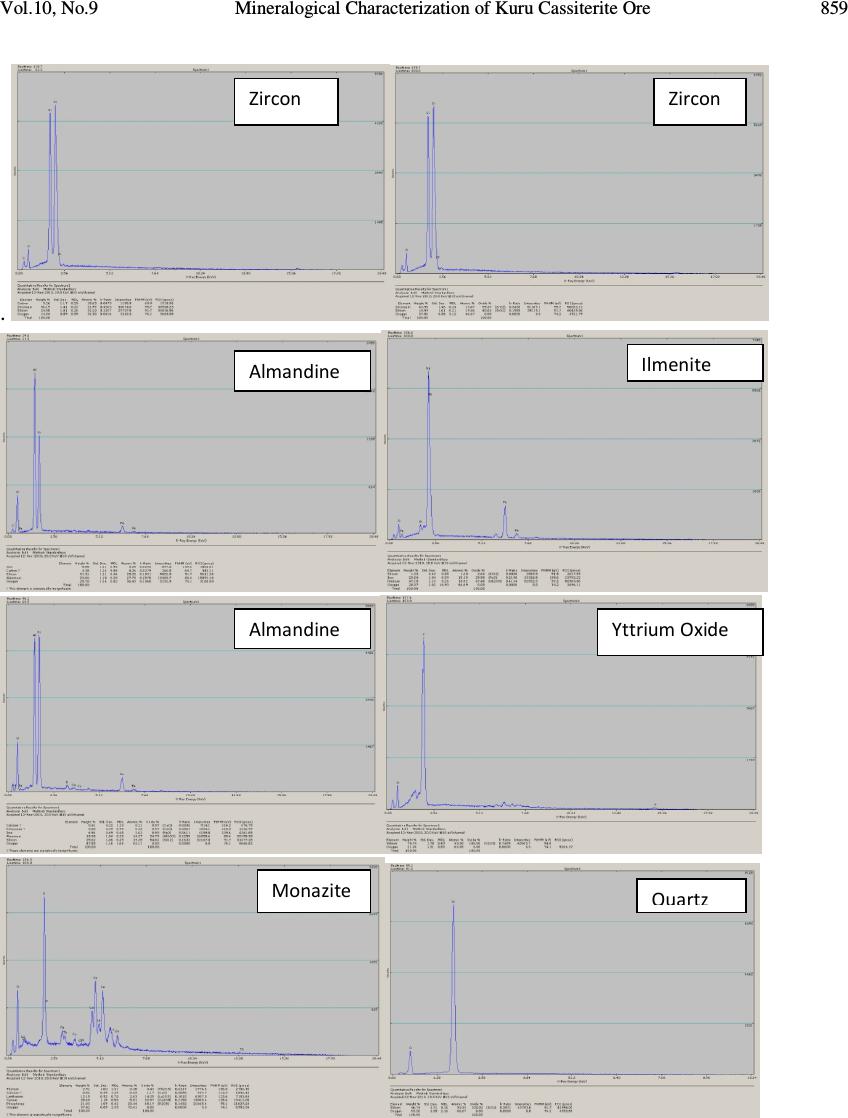 Vol.10, No.9 Mineralogical Characterization of Kuru Cassiterite Ore 859 . Zircon Zircon Almandine Ilmenite Almandine Yttrium Oxide Monazite Quartz  860 Martin Ogwuegbu, et al Vol.10, No.9 Fig. 3: EDS peaks for the various minerals in the Kuru Cassiterite Ore deposit showing different elemental compositions. 3.1.2 X – ray diffraction The mineralogical component of the crushed ore bearing cassiterite was carried out by X – ray diffraction technique. The main minerals found in the sample were cassiterite with JCPDS card numbers 41-14445, rutile with JCPDS card number 21-1276, manganocolumbite with JCPDS card number 45-1360, coffinite (46-1304), tilleyite (24-0184), zircon (06-0266), quartz in the form of rodiocolite (50-1635), monazite, siderophyllite (JCPDS 25-1355). Each JCPDS card number has the phase information from the XRD patterns. The peak analysis using the Guassian curve fitting gave the percent area integration of the various phases which correlated to the quantity of the various minerals in the ore. The integrated peak area for cassiterite that showed 4.52% was rejected due to high standard deviation of 74. Figure 4 shows the XRD phase pattern and Table 1 shows the percent quantity of the mineral components from XRD peak analysis. Zirconium Silicate Cassiterite Cassiterite Ilmenite(Ti, Fe, Mn, O) 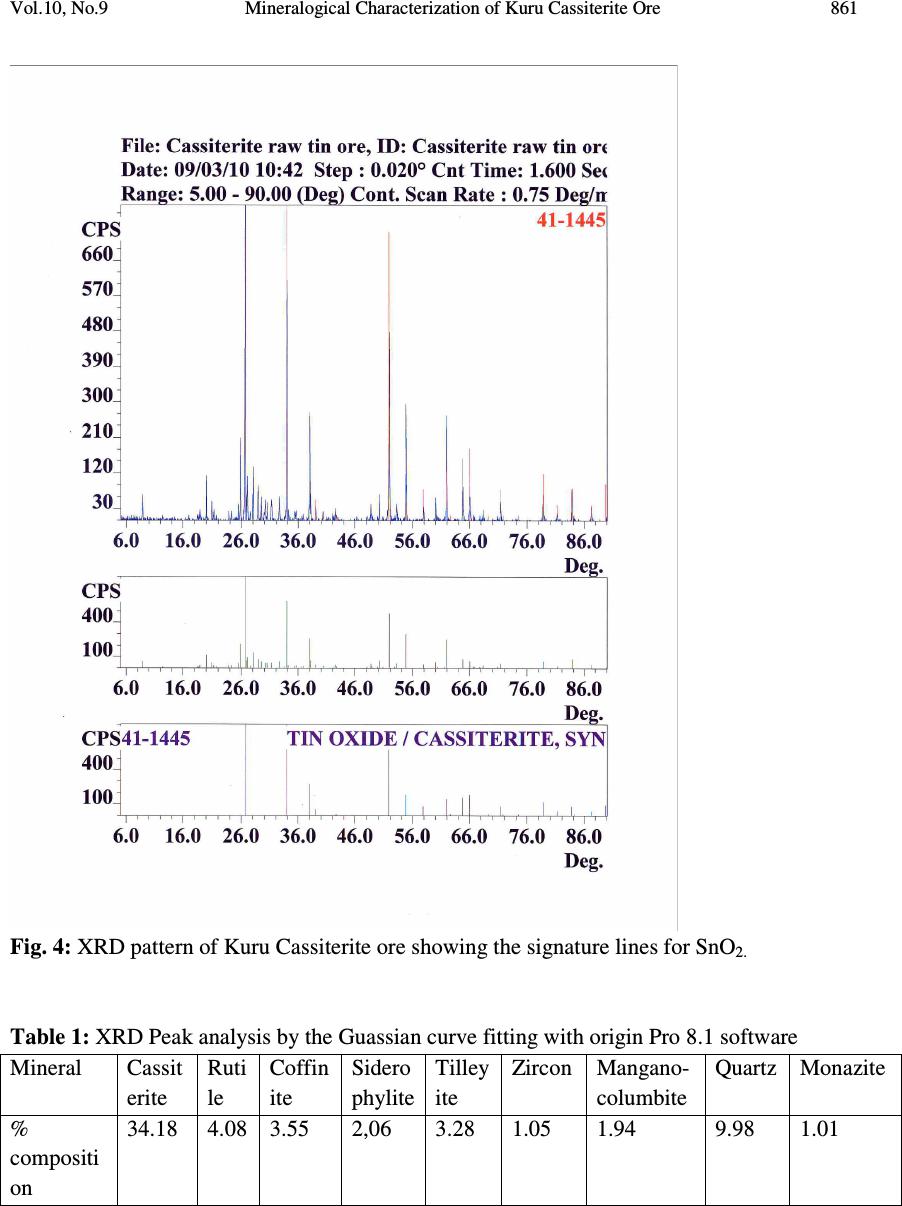 Vol.10, No.9 Mineralogical Characterization of Kuru Cassiterite Ore 861 Fig. 4: XRD pattern of Kuru Cassiterite ore showing the signature lines for SnO 2. Table 1: XRD Peak analysis by the Guassian curve fitting with origin Pro 8.1 software Mineral Cassit erite Ruti le Coffin ite Sidero phylite Tilley ite Zircon Mangano- columbite Quartz Monazite % compositi on 34.18 4.08 3.55 2,06 3.28 1.05 1.94 9.98 1.01 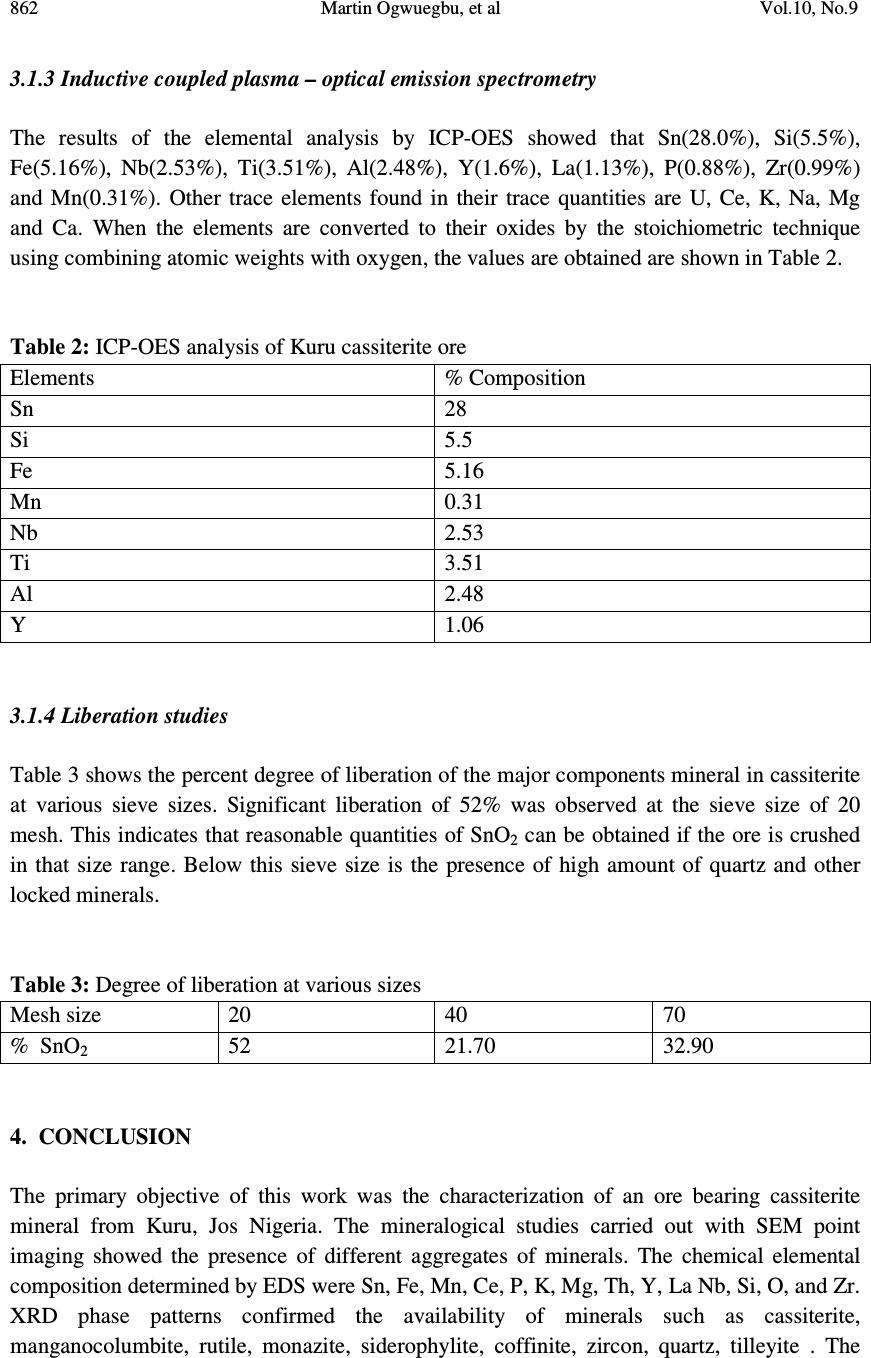 862 Martin Ogwuegbu, et al Vol.10, No.9 3.1.3 Inductive coupled plasma – optical emission spectrometry The results of the elemental analysis by ICP-OES showed that Sn(28.0%), Si(5.5%), Fe(5.16%), Nb(2.53%), Ti(3.51%), Al(2.48%), Y(1.6%), La(1.13%), P(0.88%), Zr(0.99%) and Mn(0.31%). Other trace elements found in their trace quantities are U, Ce, K, Na, Mg and Ca. When the elements are converted to their oxides by the stoichiometric technique using combining atomic weights with oxygen, the values are obtained are shown in Table 2. Table 2: ICP-OES analysis of Kuru cassiterite ore Elements % Composition Sn 28 Si 5.5 Fe 5.16 Mn 0.31 Nb 2.53 Ti 3.51 Al 2.48 Y 1.06 3.1.4 Liberation studies Table 3 shows the percent degree of liberation of the major components mineral in cassiterite at various sieve sizes. Significant liberation of 52% was observed at the sieve size of 20 mesh. This indicates that reasonable quantities of SnO 2 can be obtained if the ore is crushed in that size range. Below this sieve size is the presence of high amount of quartz and other locked minerals. Table 3: Degree of liberation at various sizes Mesh size 20 40 70 % SnO 2 52 21.70 32.90 4. CONCLUSION The primary objective of this work was the characterization of an ore bearing cassiterite mineral from Kuru, Jos Nigeria. The mineralogical studies carried out with SEM point imaging showed the presence of different aggregates of minerals. The chemical elemental composition determined by EDS were Sn, Fe, Mn, Ce, P, K, Mg, Th, Y, La Nb, Si, O, and Zr. XRD phase patterns confirmed the availability of minerals such as cassiterite, manganocolumbite, rutile, monazite, siderophylite, coffinite, zircon, quartz, tilleyite . The  Vol.10, No.9 Mineralogical Characterization of Kuru Cassiterite Ore 863 XRD peak analysis by the Guassian Pro 8.1 software showed over 34% cassiterite in the form of SnO 2 (JCPDS card 41-1445). ICP-OES analysis gave the quantity of SnO 2 in the ore to be 35.55%. The composition of cassiterite as observed in the XRD indicated that XRD analysis coupled with the Guassian curve fitting could be used for quantitative estimation of cassiterite in the ore. Also, liberation study has shown that SnO 2 are physically concentrated at particle size of 20 mesh. From the above mentioned, the use of SEM-EDS , XRD and ICP- OES provided excellent information on mineral composition of Kuru ore deposit. ACKNOWLEDGEMENT: Special appreciation goes to Institute of Material Processing, Michigan Technological University, USA for providing facilities and Nigeria Education Tax Fund in collaboration with Federal University of Technology, Owerri, Nigeria for their sponsorship. REFERENCES [1] Ofor,O., 1992, Extraction of tin from cassiterite tailing by leaching – electrowinning process, Journal of Mining and Geology, Vol. 28, No. 1, pp 125-128. [2] Pastor, J. and Ogezi, A.E., 1986, New evidence of cassiterite bearing Precambrian basement rocks of the Jos Plateau, Nigeria – the Gurum case study, Mineralium Deposita, Vol. 21, No. 1, pp 81-83. [3] Metallic Minerals, October2, 2010. http;//www.onlinenigeria.com/minerals/?blurb=517. [4] Funtua, I.I., Idris, Y., Oyewale, A.O., Umar, I.M. and Elegba, S.B., 1997, Determination of Tin in cassiterite ores and tailings by 241 Am source X- ray Flourescence Spectrometry, Appl. Radiat. Isot. Vol. 48. No.1 , pp 103-104. [5] Evans , J.R. and Jackson, J.C., 1989, Determination of tin in silicate rocks by energy dispersive X –ray fluorescence spectrometry. X – Ray Spectrom. 18, pp 139. [6] Tin Investing News, September 30, 2010, Tin Advances on supply threats. http://tininvestingnews.com/483-tin-advances-on-supply-threats.html [7] Abubakre, O.K., Sule, Y.O. and Muriana, R.A., 2009, Exploring the Potentials of tailings of Bukuru cassiterite Deposit for the Production of Iron ore Pellets, JMMCE, Vol. 8, No. 5, pp 359-366. [8] Xiaohui Wang, Shili Zheng, Hongbin Xu and Yi Zhang, 2009, Leaching of niobium and tantalum from a low – grade ore using a KOH roast-water leach system, Hydrometallurgy, Vol. 98, Issues3-4, pp 219-223. |