Paper Menu >>
Journal Menu >>
 Journal of Minerals & Materials Characterization & Engineering, Vol. 10, No.9, pp.827-8 42, 2011 jmmce.org Printed in the USA. All rights reserved 827 Effect of FCAW Process Parameters on Weld Bead Geometry in Stainless Steel Cladding V. Vasantha Kumar1* and N. Murugan2 1CIT Sandwich Polytechnic College, Coimbatore - 641014, India. 2Coimbatore Institute of Technology, Coimbatore - 641014, India. *Corresponding Author: vasanthkumarvairamuthu@yahoo.com ABSTRACT Recently automated and / or robotic welding systems have received a great deal of attention because they are highly suitable not only to enhance production rate and quality, but also to decrease cost and time to manufacture for a given product. To get the desired quality welds it is essential to have complete control over the relevant process parameters in order to obtain the required bead geometry. Mathematical models need to be developed to have such control and to make effective use of automated and / or robotic arc welding process. 1. INTRODUCTION Process industries are associated with handling, storing and processing various types of chemicals such as alkalis hydrocarbons, inorganic chemicals and water with divergent qualities. As a result the equipment handling these process chemicals demand materials of construction with good corrosion resistance and appropriate mechanical properties. Weld cladding has been a popular method for achieving a corrosion resistant surface. Cladding is a process of depositing a thin layer of anticorrosive metal on a corrosive base metal to impart corrosion resistance. Chandle showed that mathematical model derived from the experiment results could be employed to predict bead geometry, and the arc current had the greatest influence on the bead geometry [1]. Doumanidis and Hale had attempted to derive simple dynamic models to control bead width, penetration heat affected zone and cooling rate at the centre line of the weld [2]. Despite the large number of attempts to analyze arc-welding process, mathematical models relating input to output parameters in the arc welding process are still lacking. Hence this paper deals with the development of mathematical model, capable of accurate prediction of weld bead  828 V. Vasantha Kumar and N. Murugan Vol.10, No.9 dimensions viz., depth of penetration (P), height of reinforcement ( R ), bead width (W), dilution (D) for the input process parameters such as welding current (I), welding speed (S), open circuit voltage (V), nozzle - to -p la te d is t ance (N) and electrode angle (A). In this research work, five level factorial technique is employed to develop the design matrix. The experiments were conducted as per the design matrix based on central composite rotatable design. The results obtained from this experiments were utilized to develop mathematical models by regression analysis and to find the linear, quadratic and two-way interactive effects of the welding variables on the bea d ge o metry. The main and interaction effects of process parameters on bead dimensions predicted from the mathematical models have been shown in graphical form. Response surface methodology has been employed to analyze the intera ction effects of the process parameter on bead geometry. The study was carried out using 1.2 mm diameter, 317L, Stainless Steel (AWS: A5-22-95; EN 12073) flux cored wire deposited on IS:2062 structural steel plate under the shield of CO2 gas . The chemical compositions of base and filler material are given in Table 1. Table 1. Chemical Composition of materials used 2. AIM OF INVESTIGATION The main aims of this investigation are to study the effects of process parameters on the bead geometry using the developed mathematical models. 3. DIAGRAMME OF INVESTIGATION The research work was carried out as detailed below: 1. Experimental Proce dure for conducting the experiments as per t he design matrix. 2. Recording the responses viz., penetration (P), bead width (W), reinforcement (R) and calculating % dilution (D). 3. Developing mathematical models using regression analysis for accurate prediction of weld bead dimensions. 4. Response surface analysis for finding out the effect of process parameters. Materials used Element, weight % C Mn Si S P Cr Mo Ni Cu N2 E-317L 0.021 1.38 0.89 0.0070.01618.463.1813.100.007 0.057 IS:2062 0.18 0.98 0.18 0.0160.016- - - - - 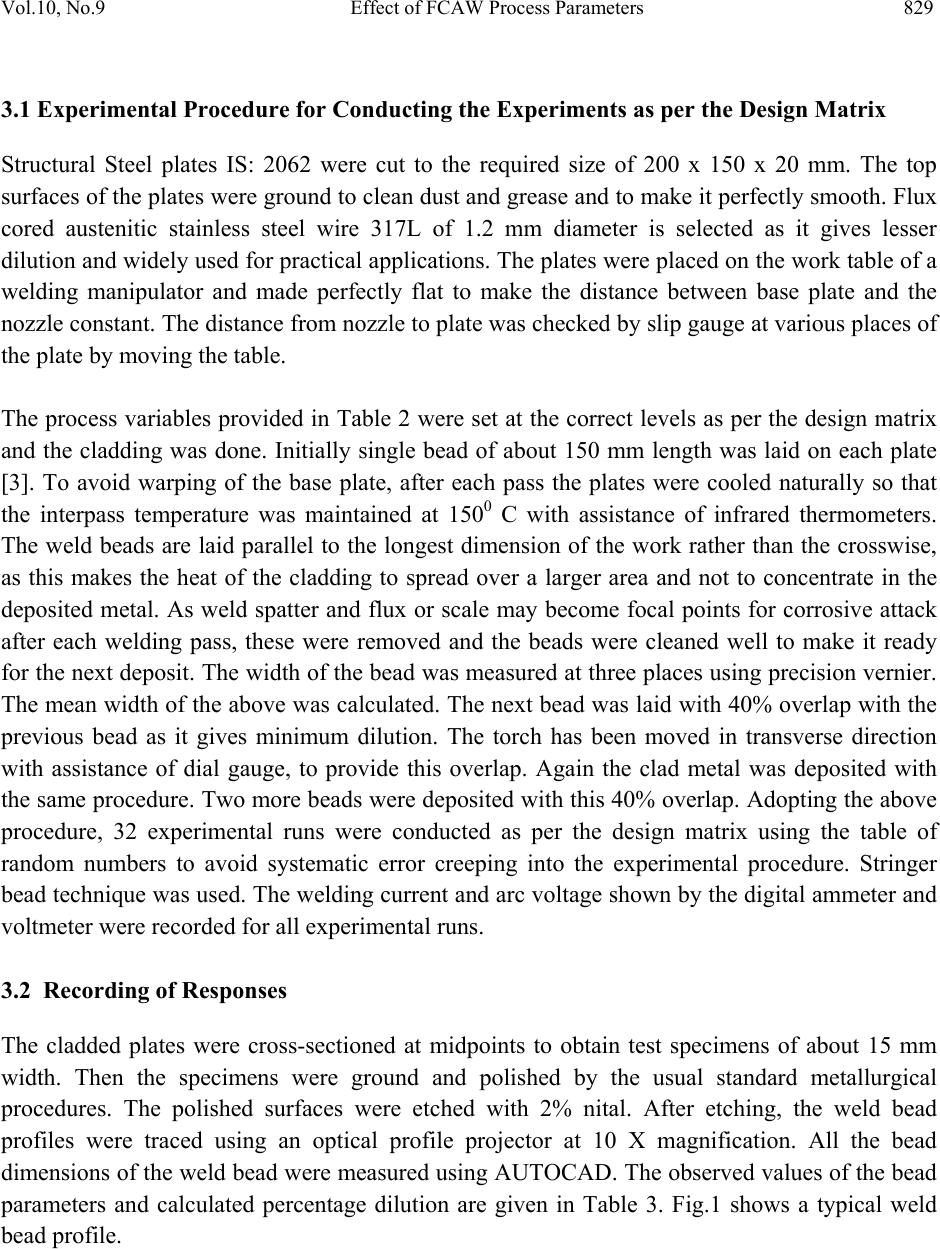 Vol.10, No.9 Effect of FCAW Process Parameters 829 3.1 Experimental Procedure for Conducting the Experiments as per the Design Matrix Structural Steel plates IS: 2062 were cut to the required size of 200 x 150 x 20 mm. The top surfaces of the plates were ground to clean dust and grease and to make it perfectly smooth. Flux cored austenitic stainless steel wire 317L of 1.2 mm diameter is selected as it gives lesser dilution and widely used for practical applications. The plates were placed on the work table of a welding manipulator and made perfectly flat to make the distance between base plate and the nozzle constant. The distance from nozzle to plate was checked by slip gauge at various places of the plate by moving the table. The process variables provided in Table 2 were set at the correct levels as per the design matrix and the cladding was done. Initially single bead of about 150 mm length was laid on each plate [3]. To avoid warping of the base plate, after each pass the plates were cooled naturally so that the interpass temperature was maintained at 1500 C with assistance of infrared thermometers. The weld beads are laid parallel to the longest dimension of the work rather than the crosswise, as this makes the heat of the cladding to spread over a larger area and not to concentrate in the deposited metal. As weld spatter and flux or scale may become focal points for corrosive attack after each welding pass, these were removed and the beads were cleaned well to make it ready for the next deposit. The width of the bead was measured at three places using precision vernier. The mean width of the above was calculated. The next bead was laid with 40% overlap with the previous bead as it gives minimum dilution. The torch has been moved in transverse direction with assistance of dial gauge, to provide this overlap. Again the clad metal was deposited with the same procedure. Two more beads were deposited with this 40% overlap. Adopting the above procedure, 32 experimental runs were conducted as per the design matrix using the table of random numbers to avoid systematic error creeping into the experimental procedure. Stringer bead technique was used. The welding current and arc voltage shown by the digital ammeter and voltmeter were recorded for all experimental runs. 3.2 Recording of Responses The cladded plates were cross-sectioned at midpoints to obtain test specimens of about 15 mm width. Then the specimens were ground and polished by the usual standard metallurgical procedures. The polished surfaces were etched with 2% nital. After etching, the weld bead profiles were traced using an optical profile projector at 10 X magnification. All the bead dimensions of the weld bead were measured using AUTOCAD. The observed values of the bead parameters and calculated percentage dilution are given in Table 3. Fig.1 shows a typical weld bead profile. 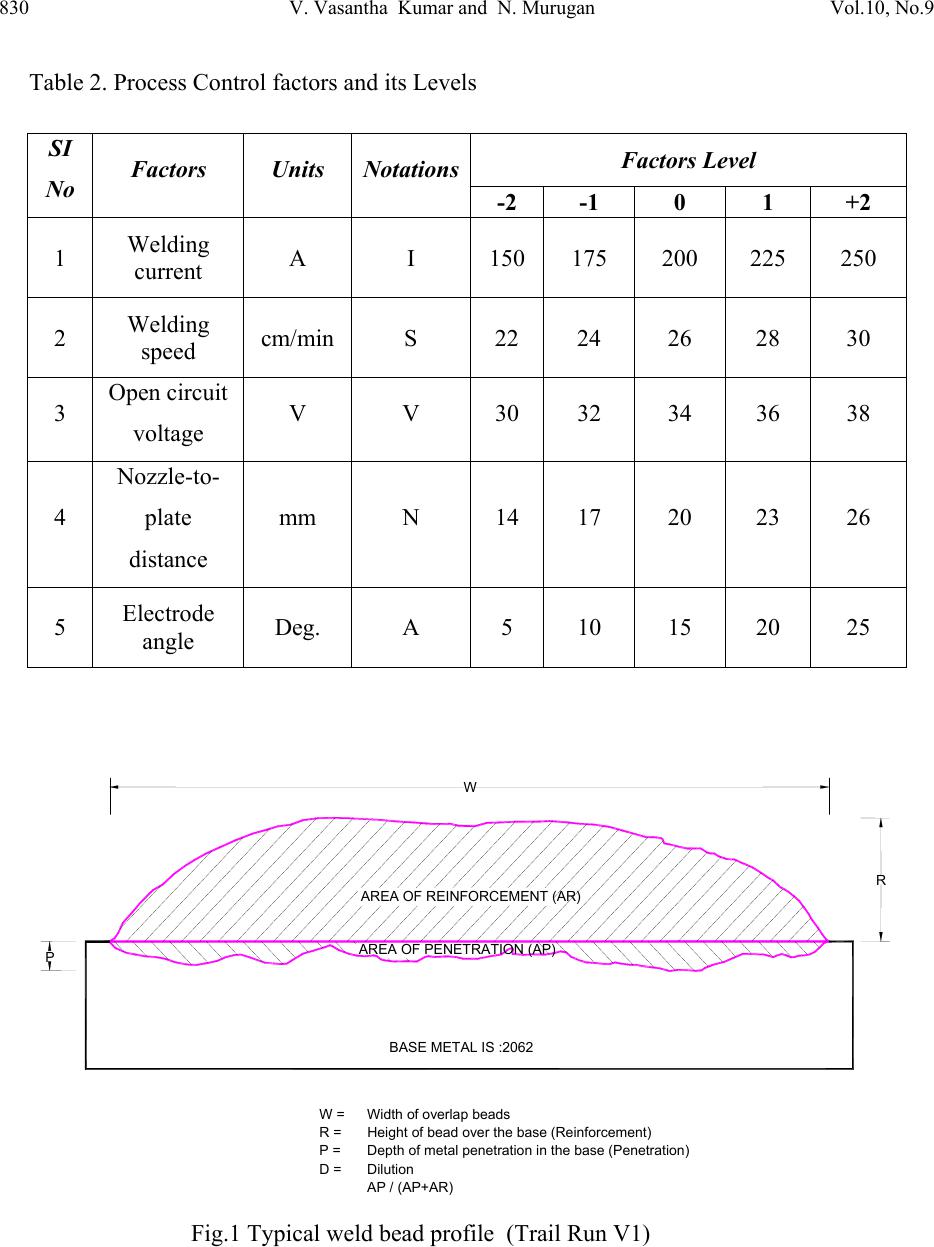 830 V. Vasantha Kumar and N. Murugan Vol.10, No.9 Table 2. Process Control factors and its Levels Fig.1 Typical weld bead profile (Trail Run V1) SI No Factors Units NotationsFactors Level -2 -1 0 1 +2 1 Welding current A I 150 175 200 225 250 2 Welding speed cm/min S 22 24 26 28 30 3 Open circuit voltage V V 30 32 34 36 38 4 Nozzle-to- plate distance mm N 14 17 20 23 26 5 Electrode angle Deg. A 5 10 15 20 25 A REA OF REINFORCEMENT (AR) A REA OF PENETRATION (AP) W = Width of overlap beads R = Height of bead over the base (Reinforcement) P = Depth of metal penetration in the base (Penetration) D =Dilution A P / (AP+AR) P R W BASE METAL IS :2062  Vol.10, No.9 Effect of FCAW Process Parameters 831 Table 3. Design Matrix and observed values of bead dimensions. Trail Run I Amps S cm/ min O.C.V Volts NPD mm ANGL E Deg Width mm Reinforce ment mm Penetra tion mm Dilution % v1 -1 -1 -1 -1 1 24.20 4.05 0.98 14.72 v2 1 -1 -1 -1 -1 29.75 4.78 1.05 11.65 v3 -1 1 -1 -1 -1 24.38 3.60 1.18 19.91 v4 1 1 -1 -1 1 24.38 3.60 1.20 20.41 v5 -1 -1 1 -1 -1 25.63 3.90 1.13 15.91 v6 1 -1 1 -1 1 30.03 4.78 0.98 13.34 v7 -1 1 1 -1 1 24.15 3.73 0.83 14.73 v8 1 1 1 -1 -1 29.85 4.23 1.15 14.49 v9 -1 -1 -1 1 -1 24.23 4.08 0.90 11.54 v10 1 -1 -1 1 1 28.08 5.13 0.83 9.22 v11 -1 1 -1 1 1 20.95 3.80 0.78 11.38 v12 1 1 -1 1 -1 27.95 4.48 1.15 14.12 v13 -1 -1 1 1 1 23.10 3.65 0.85 12.47 v14 1 -1 1 1 -1 29.98 4.68 1.23 16.41 v15 -1 1 1 1 -1 26.00 3.88 0.95 18.34 v16 1 1 1 1 1 25.88 4.90 0.98 13.03 v17 -2 0 0 0 0 17.80 4.05 0.80 10.42 v18 2 0 0 0 0 26.48 5.63 1.05 11.02 v19 0 -2 0 0 0 27.70 4.58 1.00 13.28 v20 0 2 0 0 0 22.63 4.28 1.43 15.94 v21 0 0 -2 0 0 21.23 4.68 1.08 12.41 v22 0 0 2 0 0 27.80 3.60 0.93 16.71 v23 0 0 0 -2 0 27.35 3.85 1.15 17.97 v24 0 0 0 2 0 23.60 4.50 0.71 10.48 v25 0 0 0 0 -2 23.78 4.30 1.10 14.39 v26 0 0 0 0 2 23.33 4.48 0.85 11.58 v27 0 0 0 0 0 24.38 4.58 1.28 14.49 v28 0 0 0 0 0 24.80 4.53 1.15 13.77 v29 0 0 0 0 0 24.50 4.63 1.25 14.55 v30 0 0 0 0 0 23.15 4.58 1.18 14.02 v31 0 0 0 0 0 26.65 4.10 1.18 14.75 v32 0 0 0 0 0 24.38 4.78 1.14 12.50  832 V. Vasantha Kumar and N. Murugan Vol.10, No.9 3.3 Developing Mathematical Models using Regression Analysis for Accurate Prediction of Weld Bead Dimensions. Using the measured values of bead geometry provided in Table 3, mathematical models were developed using popular method of regression analysis. The developed final models for bead geometry are given below: P =1.199 + 0.061 I + 0.047 S - 0.071 N - 0.076 A - 0.060 I2 - 0.041 V2 - 0.059 N2- 0.048 A2 + 0.033 IS + 0.027IN - 0.052 SV + 0.042 VN R = 4.606 + 0.376 I - 0.143 S - 0.080 V + 0.134N - 0.059 S2 - 0.130 V2 - 0.12 N2 - 0.068 A2 - 0.092 IS + 0.105 IN + 0.142 SV + 0.117 SN W = 24.117 + 2.108 I - 0.900 S + 0.910 V - 0.571 N - 0.746 A - 0.504 I2 + 0.467 V2 + 0.582 N2 - 0.506 IS - 0.541SA D = 13.755 + 1.103S + 0.599V - 1.401N - 0.778A - 0.601I2 + 0.372S2 + 0.360V2 + 0.276N2 + 0.734IA - 1.015SV - 0.418SN + 1.390VN - 0.631 VA - 0.972NA Where P = depth of penetration, mm R = height of reinforcement, mm W = weld width, mm D = dilution, % The developed models were tested with the help of scatter plots. A typical scatter plot is shown in Fig.2. For the computational ease and enhanced interpretability, the equations containing the parameters in coded form were employed for drawing graphs and further analysis of results [4- 11]. 3.4 Response Surface Analysis The effect of individual welding variables and their significant interaction on all the bead parameters and dilutions are calculated quantitatively. The main and interaction effect of welding variables on various response parameters have been presented graphically for quick analyses. These graphs satisfactorily assist to interpret the effect of various process variables [12]. The possible causes for the effects of different process variables on bead geometry are analyzed and presented below.  Vol.10, No.9 Effect of FCAW Process Parameters 833 4. RESULTS AND DISCUSSIONS Based on the mathematical models developed for predicting the bead geometry and dilution, the effects of welding process parameters on the bead parameters are presented graphically in Figs. 3~23. The effects of various process variables on the bead geometry are presented under different headings as follows. 4.1 Direct Effects of Welding Variables on Bead Geometry 4.1.1 Effects of process variables on depth of penetration (P) Fig. 3 shows that the penetration initially increases with the increase in current (I) and voltage (V) and then decreases with further increase in I and V. The slight increase in P may be attributed due to increase in heat input with the increase in V. There is a increase in penetration with an increase in welding speed. This is due to the fact that, at higher welding speeds, the weld pool becomes smaller providing lesser cushioning effect and causing deeper penetration [13]. This may be also due to the flux shield on the bead causes more time for the heat to dissipate to the surrounding resulting in slight increase in both penetration and area of penetration [14]. Increase in nozzle-to-plate distance (N) initially increases penetration slightly and penetration decreases with further increase in N. This may be due to the decrease in welding current with the increase in N. It is found from the experiment that when the N was at 14 mm the welding current was 209 amps and when N was 26 mm the welding current was just 171 amps. This is due to the fact that the increased electrode extension by raising N augments the resistance in the welding circuit and with the voltage being constant the current might have reduced according to Ohm’s law. Increase in electrode angle (A) initially increases penetration slightly and further increase in A penetration decreases. Fig.2 Scatter diagram for penetration model Fig.3 Direct effects of parameters on Penetration  834 V. Vasantha Kumar and N. Murugan Vol.10, No.9 4.1.2 Effects of process variables on reinforcement (R) From Fig. 4 it can be observed that an increase in welding current results in increase in convexity of the weld bead due to increased melting rate hence reinforcement increases. Whereas with an increase in welding speed, the reinforcement decreases. The fusion rate of the wire is kept constant for all the values of welding speeds. Hence at low speeds the bead is large in size whereas at high speeds, it is small in size. If S decreases, the bead becomes wider, flatter and smoother [14]. It is evident that the reinforcement initially increases with the increase in voltage and then decreases with the further increase in V. This may be due to the spread of arc cone when the voltage increases, resulting in the reduction of reinforcement. The height of reinforcemen t i ncreases slightly and decreases with the further increase in N and A. 4.1.3. Effects of process variables on bead width (W) Fig. 5 shows that I and S have contradicting influence on width similar to reinforcement. It can be noted that the bead width increases with an increase in I. Higher deposition rate with higher fluidity of the molten wire may be attributed for this increase in bead width with current. The bead width decreases and then increases slightly as the welding speed increases. At high travel speed volume of metal is deposited per unit length decreases over a long distance. Also the heat input per unit length is also less resulting in thinner and narrow bead. It is clear that the bead width increases when voltage increases, because when the voltage increases arc length also increases which spreads the arc cone at the base causing increase in bead width. Initially the bead width decreases with the increase in N and then increases with the increase in N. This is due to the decrease in welding current when N is increased. The drop in current results in reduced base metal melting and hence weld bead width decreases. The bead width decreases with increase in A. Fig. 4 Direct effects of parameters on Fig. 5 Direct effects of parameters on Width Reinforcement  Vol.10, No.9 Effect of FCAW Process Parameters 835 4.1.4 Effects of process variables on % dilution (D) Effects of the I, S. V, N and A on D are depicted in Fig.6 which shows that the percentage dilution decreases with the increase of E and N. This may be due to the increase in the melting rate of electrode and diffusing energy of the arc as it strikes on the base metal when N increases. As discussed earlier the raise in N decreases the depth of penetration and width and increases the area of reinforcement due to reduction in welding current and causing a decline in the dilution with increase of E and N. It is evident that the dilution initially decreases with the increase in V but D increases with the further increase V. This may be due to the increase in heat input with the increase in V. Also as discussed when voltage increases reinforcement decreases. But as penetration is not significantly increased with the increase in voltage dilution increases with the increase in voltage. Dilution increases with increase in welding speed. This matches with the finding of Cornu [15]. It is stated that the dilution of the base metal in the weld pool increases with the increase in the welding speed since the weight of the deposited metal per unit length decreases while the cross section of the bead decreases very little. 4.2. Interaction Effects of Process Parameters on Bead Geometry 4.2.1 Interaction effects of welding current and welding speed on penetration (P) From Fig. 7 it is evident that P initially increases with an increase in welding current at all levels of welding speed and then decreases with the further increase in I. The rate of increase in P is higher at higher welding speed. This may be due to the fact that, if the welding speed is reduced, the weld pool becomes larger; penetration decreases due to cushioning of arcs. Fig. 6 Direct effects of parameters on Fig. 7 Interaction effects of I and S on P % Dilution  836 V. Vasantha Kumar and N. Murugan Vol.10, No.9 4.2.2 Interaction effects of welding current and welding speed on reinforcement (R) From Fig. 8 it can be observed that the reinforcement increases with an increase in welding speed upto 26 cm/min, but it is also evident that the reinforcement decreases when welding speed is above 26 cm/min for all levels of welding current. Therefore, the current and welding speed can both be used to change the weight of metal deposited per unit bead length. 4.2.3 Interaction effects of welding current and welding speed on bead width (W) Fig. 9 depicts the effect of I and S on W and it is evident that the bead width increases with an increase in welding current at all levels of welding speed. The rate of increase in W with the increase in I decreases when S decreases. This is due to at high travel speed volume of metal deposited decreases. The rate of increase in W with the increase in I decreases when S decreases. Fig. 8 Interaction effects of I and S on R Fig. 9 Interaction effects of I and S on W 4.2.4 Interaction effects of welding current and N on penetration (P) From Fig. 10 it can be observed that penetration increases to a maximum and then decreases slightly with all values of N for all levels of welding current. P is low when N is high. 4.2.5 Interaction effects of voltage and N on penetration (P) From Fig. 11 it can be observed that penetration increases to a maximum and then decreases slightly with all values of N for all levels of V. It is found that at low N the penetration decreases with increase in V.  Vol.10, No.9 Effect of FCAW Process Parameters 837 Fig.10 Interaction effects of I and N on P Fig.11 Interaction effects of V and N on P 4.2.6 Interaction effects of welding speed and OCV on penetration (P) Fig. 12 depicts the effect of S and V on P and it is evident that the penetration increases with the increase in welding speed when OCV is upto 34 V, and the penetration decreases with the increase in welding speed, when OCV is more than 34 V. 4.2.7 Interaction effects of welding cu rr en t a nd N o n r ei nf orc em ent (R) From Fig. 13 it is evident that the reinforcement decreases with increase in welding current when N is upto 17 mm and the reinforcement increases with the increase in welding current, when N is more than 17 mm. Fig.12 Interaction effects of S and V on P Fig.13 Interaction effects of I and N on R  838 V. Vasantha Kumar and N. Murugan Vol.10, No.9 4.2.8 Interaction effects of welding speed and N on reinforcement (R) From Fig. 14 it is evident that the reinforcement decreases with increase in welding speed when N is upto 20 mm and the reinforcement increases and then decreases slightly with the increase in welding speed when N is more than 20 mm. 4.2.9 Interaction effects of welding speed and OCV on reinforcement (R) Fig. 15 depicts the effect of S and V on R and it is clear that reinforcement decreases with the increase in welding speed when OCV is 34 V and reinforcement increases with the increase in welding speed when OCV is more than 34 V. Fig.14 Interaction effects of S and N on R Fig.15 Interaction effects of S and V on R 4.2.10 Interaction effects of welding speed and A on width (W) From Fig. 16 it is observed that the bead width increases with the increase in welding speed when A is 5 degree and bead width decreases with the increase in welding speed when A is more than 5 degree. The rate of decrease in bead width is higher at higher electrode angle. 4.2.11 Interaction effects of welding current and A on percentage dilution (D) From Figs. 17&18 it is observed that the percentage dilution decreases with the increase in welding current when A is 5 degree and percentage dilution increases and then decreases with the increase in welding current when A is more than 5 degree. The response surface is shown in the Fig. 21.  Vol.10, No.9 Effect of FCAW Process Parameters 839 Fig.16 Interaction effects of S and A on W Fig.17 Interaction effects of I and A on D 4.2.12 Interaction effects of OCV and N on percentage dilution (D) From Fig. 19 it is observed that D decreases with the increase in OCV when N is 17 mm and D increases with the increase in OCV when N is more than 17 mm. Fig.18 Response surface for interaction Fig.19 Interaction effects of V and N on D effects of I and A on D  840 V. Vasantha Kumar and N. Murugan Vol.10, No.9 4.2.13 Interaction effects of welding speed and OCV on percentage dilution (D) From Fig. 20 it is observed that D increases with the increase in welding speed when OCV is 34 V and D decreases with the increase in welding speed when OCV is more than 34 V. 4.2.14 Interaction effects of welding speed and N on percentage dilution (D) From Fig. 21 it is evident that D increases with the increase in welding speed when N is upto 20 mm and D decreases and then increases slightly with the increase in welding speed when N is more than 20 mm. Fig.20 Interaction effects of S and V on D Fig.21 Interaction effects of S and N on D 4.2.15 Interaction effects of OCV and A on percentage dilution (D) From Fig. 22 it is evident that D increases with the increase in OCV when electrode angle is 15 degree and D decreases initially with the increase in OCV and then increases when A is more than 15 degree. 4.2.16 Interaction effects of N and A on percentage dilution (D) From Fig. 23 it is evident that the percentage dilution increases with the increase in N when A is 5 degree and percentage dilution decreases with the increase in N when A is more than 5 degree. The rate of decrease in percentage dilution is higher at higher electrode angle.  Vol.10, No.9 Effect of FCAW Process Parameters 841 Fig.22 Interaction effects of V and A on D Fig.23 Interaction effects of N and A on D 5. CONCLUSION P, W and R increase with the increase in welding current, but decrease with the increase in welding speed. P, W decrease with the increase in N and A whereas R increase with increase in N and A. However, D increases with the increase in I, S and OCV and decreases with increase in N and A. It was observed that interaction effects have considerable influence over the weld bead geometry and their effects cannot be neglected. REFERENCES 1. Chandle .R.S, “Mathematical modeling of gas metal arc weld features”, Proceeding of the Fourth International Conference on Modeling and Casting of Welding Processes, USA, April 10 th 1983, pp 109-120. 2. Doumanidis .G, Hale .M, “Multivariable control of arc welding process”, Proceedings of the International Conference on Trends in Welding Research, Gatlinburg, USA, 18-22 nd May 1986, pp 440-457. 3. Wells .T.C, “A review of surface treatments and coatings”, Surfacing Journal, Vol. 9, No.4, 1978, pp 2-9. 4. Murugan .N, Parmer .R .S, “Mathematical models for bead geometry prediction in austenitic stainless steel surfacing by MIG welding”, Int. J Join Mater 7(23): 1995, pp 71 - 80  842 V. Vasantha Kumar and N. Murugan Vol.10, No.9 5. Murugan .N, Parmar .R .S, “Stainless steel cladding deposited by automatic gas metal arc welding”, Weld J 76 (10): 1997, pp 391-s – 402-s. 6. Montgomery .D .C, Runger .G .C, “Applied statistics and probability for engineers”, 2nd edn. Wiley, New York, 1999. 7. Walpole .R .E, Myers .R .H, “Probability and statistics for engineers and scientists”, 6th edn. Prentice Hall, Upper Saddle River, NJ, 1998. 8. Cheremisinoff .N .P, “Practical statistics for engineers and scientists”, Technomic Publishing, Lancaster, PA, 1987. 9. Cochran .W .G, Cox .G .M, “Experimental designs”, 2nd edn, W iley, Singapore, 1957. 10. Khuri .A .L, Cornell .J .A, “Response surfaces, designs and analyses”, Marcell Dekker, New York, 1996. 11. Montgomery .D .C, “Design and analysis of experiments”, 5th edn. Wiley, New York, 2001. 12. Andre I. Khuri and John A. Cornell, “Response Surfaces – Design and Analysis”, Marcel Dekker, Inc., New York, 1970. 13. Palani .P .K, “Development of mathematical models for prediction of weld bead geometry in cladding by flux cored arc welding”, The International Journal of Advanced Manufacturing Technology, 10/2006. 14. Drayton .P.A, “An examination of the influence of the process parameter in Submerged arc welding”, Institute Research Report, 1970R/RB/PE4/70. 15. Jean Cornu, “Ad v an c e d W e ld i ng S ys t e ms”, Vol.2, IFS Publications Ltd., U.K., 1988. |