Paper Menu >>
Journal Menu >>
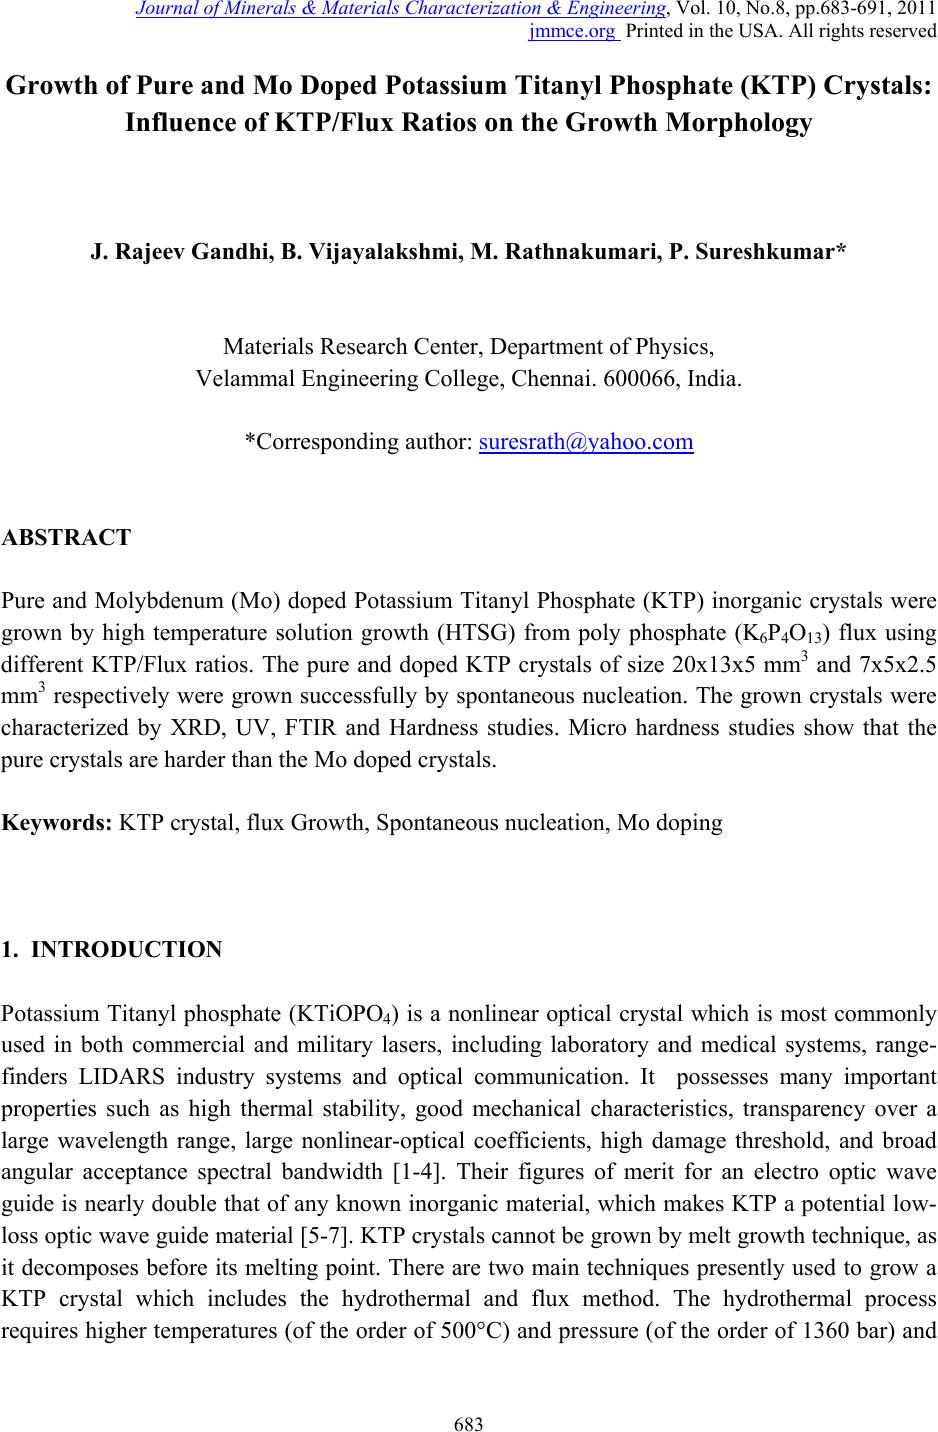 Journal of Minerals & Materials Characterization & Engineering, Vol. 10, No.8, pp.683-691, 2011 jmmce.org Printed in the USA. All rights reserved 683 Growth of Pure and Mo Doped Potassium Titanyl Phosphate (KTP) Crystals: Influence of KTP/Flux Ratios on the Growth Morphology J. Rajeev Gandhi, B. Vijayalakshmi, M. Rathnakumari, P. Sureshkumar* Materials Research Center, Department of Physics, Velammal Engineering College, Chennai. 600066, India. *Corresponding author: suresrath@yahoo.com ABSTRACT Pure and Molybdenum (Mo) doped Potassium Titanyl Phosphate (KTP) inorganic crystals were grown by high temperature solution growth (HTSG) from poly phosphate (K6P4O13) flux using different KTP/Flux ratios. The pure and doped KTP crystals of size 20x13x5 mm3 and 7x5x2.5 mm3 respectively were grown successfully by spontaneous nucleation. The grown crystals were characterized by XRD, UV, FTIR and Hardness studies. Micro hardness studies show that the pure crystals are harder than the Mo doped crystals. Keywords: KTP crystal, flux Growth, Spontaneous nucleation, Mo doping 1. INTRODUCTION Potassium Titanyl phosphate (KTiOPO4) is a nonlinear optical crystal which is most commonly used in both commercial and military lasers, including laboratory and medical systems, range- finders LIDARS industry systems and optical communication. It possesses many important properties such as high thermal stability, good mechanical characteristics, transparency over a large wavelength range, large nonlinear-optical coefficients, high damage threshold, and broad angular acceptance spectral bandwidth [1-4]. Their figures of merit for an electro optic wave guide is nearly double that of any known inorganic material, which makes KTP a potential low- loss optic wave guide material [5-7]. KTP crystals cannot be grown by melt growth technique, as it decomposes before its melting point. There are two main techniques presently used to grow a KTP crystal which includes the hydrothermal and flux method. The hydrothermal process requires higher temperatures (of the order of 500°C) and pressure (of the order of 1360 bar) and  684 J. Rajeev Gandhi, B. Vijayalakshmi, M. Rathnakumari, P. Sureshkumar Vol.10, No.8 the growth rate of KTP crystal is very low [8-9]. Large single crystals of KTP mostly grown by flux techniques and it is the most popular method. The significant advantage of using the flux process is that it operates at atmospheric pressure and hence does not require sophisticated pressure equipment and it is easy to design scaled-up furnaces. To grow KTP crystals by flux growth technique, different type of fluxes such as K6, K4, K8 and K15 have been used [10-11]. The most commonly used flux is polyphosphate K6 (K6P4O13) which has been identified as a viable high temperature solvent for crystal growth of KTP [12]. The quality and external morphology of grown the crystals depends on many parameters such as initial chemical compositions, growth temperature, super saturation around the nuclei, position of the crystal in the crucible, hydrodynamic conditions, defect content in the crystal, etc. [13-15]. Presently we have tried to grow crystals of good quality KTP (i) by varying the precursor ratios i.e. KTP-flux ratios, (ii) by adding molybdenum as a dopant which acts as flux modifier to reduce multi nucleation. 2. METHODS AND MATERIALS: 2.1 Synthesis The starting materials potassium di-hydrogen orthophosphate (KH2PO4), Di-Potassium hydrogen orthophosphate (K2HPO4), Titanium dioxide (TiO2) were weighed and directly taken in the Platinum crucible. In the present work two sets of charges were prepared for the growth of KTP crystals one with (KTP)/ (K6) flux in the ratio 1:1 and the other with 7:3. The initial compounds were prepared by the following reaction for KTP/Flux in the ratio 1:1 32 4 (1) For KTP/Flux in the ratio 7:3 the following reaction was followed. 136 7 7 3 16 (2) These reactions are preferred since it results in the evolution of a smaller volume of gaseous products [16]. Charge of about 60g weight was loaded into a 50 ml Platinum crucible and subjected to ~30h soaking through homogenization aided by a constant stirring by Platinum rod. The crucible was mounted in a double zone resistance furnace with a long hot zone having a relatively small temperature gradient, not exceeding 2 °C in the solution. The flux used for the growth of pure KTP is a mixture of potassium phosphates - Polyphosphate (K6P4O13). This system has a high kinematic viscosity which will results in the growth kinetics being dominated by diffusion within the flux. 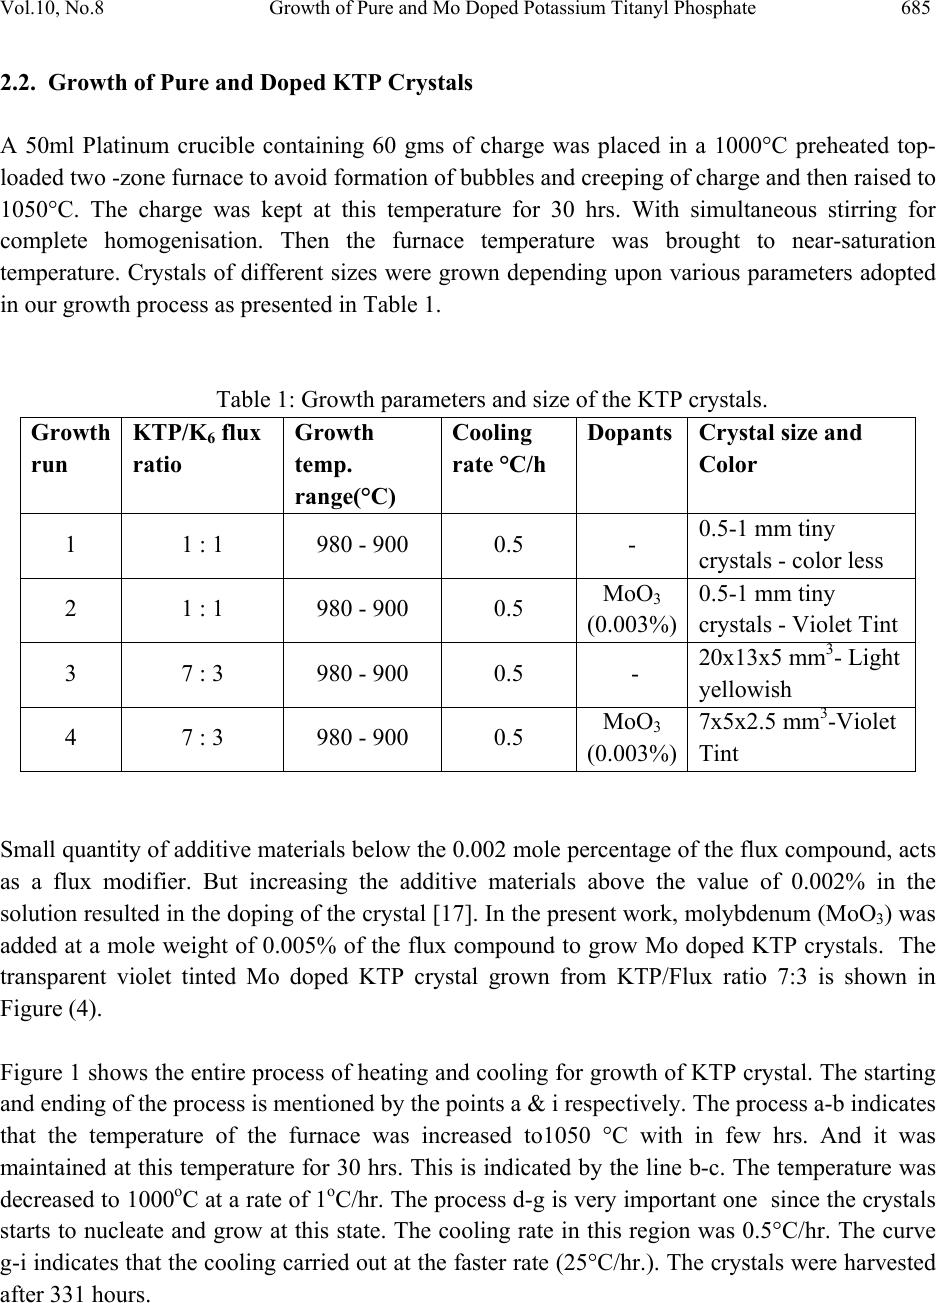 Vol.10, No.8 Growth of Pure and Mo Doped Potassium Titanyl Phosphate 685 2.2. Growth of Pure and Doped KTP Crystals A 50ml Platinum crucible containing 60 gms of charge was placed in a 1000°C preheated top- loaded two -zone furnace to avoid formation of bubbles and creeping of charge and then raised to 1050°C. The charge was kept at this temperature for 30 hrs. With simultaneous stirring for complete homogenisation. Then the furnace temperature was brought to near-saturation temperature. Crystals of different sizes were grown depending upon various parameters adopted in our growth process as presented in Table 1. Table 1: Growth parameters and size of the KTP crystals. Growth run KTP/K6 flux ratio Growth temp. range(°C) Cooling rate °C/h Dopants Crystal size and Color 1 1 : 1 980 - 900 0.5 - 0.5-1 mm tiny crystals - color less 2 1 : 1 980 - 900 0.5 MoO3 (0.003%) 0.5-1 mm tiny crystals - Violet Tint 3 7 : 3 980 - 900 0.5 - 20x13x5 mm3- Light yellowish 4 7 : 3 980 - 900 0.5 MoO3 (0.003%) 7x5x2.5 mm3-Violet Tint Small quantity of additive materials below the 0.002 mole percentage of the flux compound, acts as a flux modifier. But increasing the additive materials above the value of 0.002% in the solution resulted in the doping of the crystal [17]. In the present work, molybdenum (MoO3) was added at a mole weight of 0.005% of the flux compound to grow Mo doped KTP crystals. The transparent violet tinted Mo doped KTP crystal grown from KTP/Flux ratio 7:3 is shown in Figure (4). Figure 1 shows the entire process of heating and cooling for growth of KTP crystal. The starting and ending of the process is mentioned by the points a & i respectively. The process a-b indicates that the temperature of the furnace was increased to1050 °C with in few hrs. And it was maintained at this temperature for 30 hrs. This is indicated by the line b-c. The temperature was decreased to 1000oC at a rate of 1oC/hr. The process d-g is very important one since the crystals starts to nucleate and grow at this state. The cooling rate in this region was 0.5°C/hr. The curve g-i indicates that the cooling carried out at the faster rate (25°C/hr.). The crystals were harvested after 331 hours. 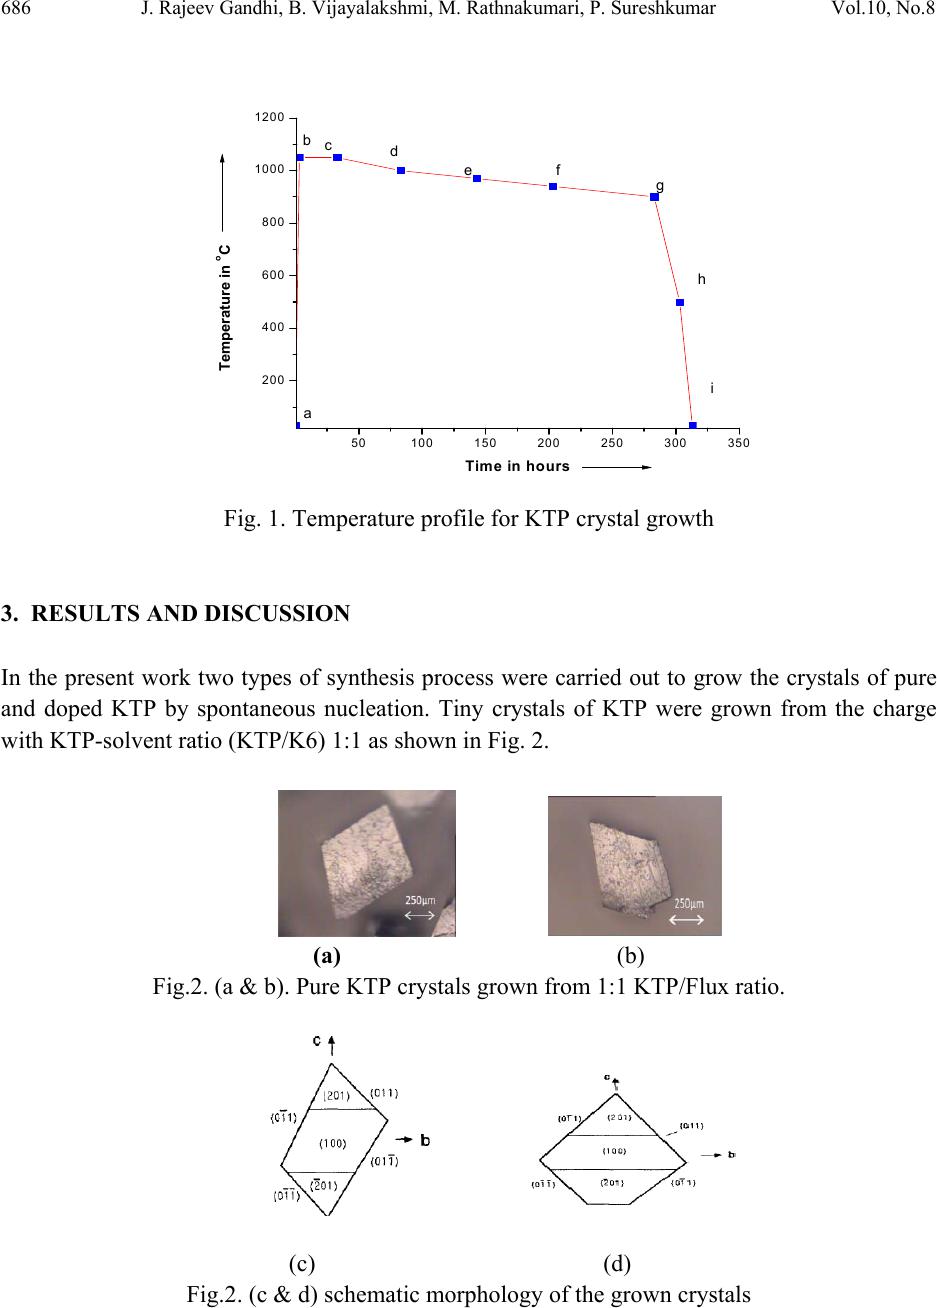 686 J. Rajeev Gandhi, B. Vijayalakshmi, M. Rathnakumari, P. Sureshkumar Vol.10, No.8 50100 150 200 250 300 350 200 400 600 800 1000 1200 Temperature i n o C Time in hours a bcdefg h i Fig. 1. Temperature profile for KTP crystal growth 3. RESULTS AND DISCUSSION In the present work two types of synthesis process were carried out to grow the crystals of pure and doped KTP by spontaneous nucleation. Tiny crystals of KTP were grown from the charge with KTP-solvent ratio (KTP/K6) 1:1 as shown in Fig. 2. (a) (b) Fig.2. (a & b). Pure KTP crystals grown from 1:1 KTP/Flux ratio. (c) (d) Fig.2. (c & d) schematic morphology of the grown crystals 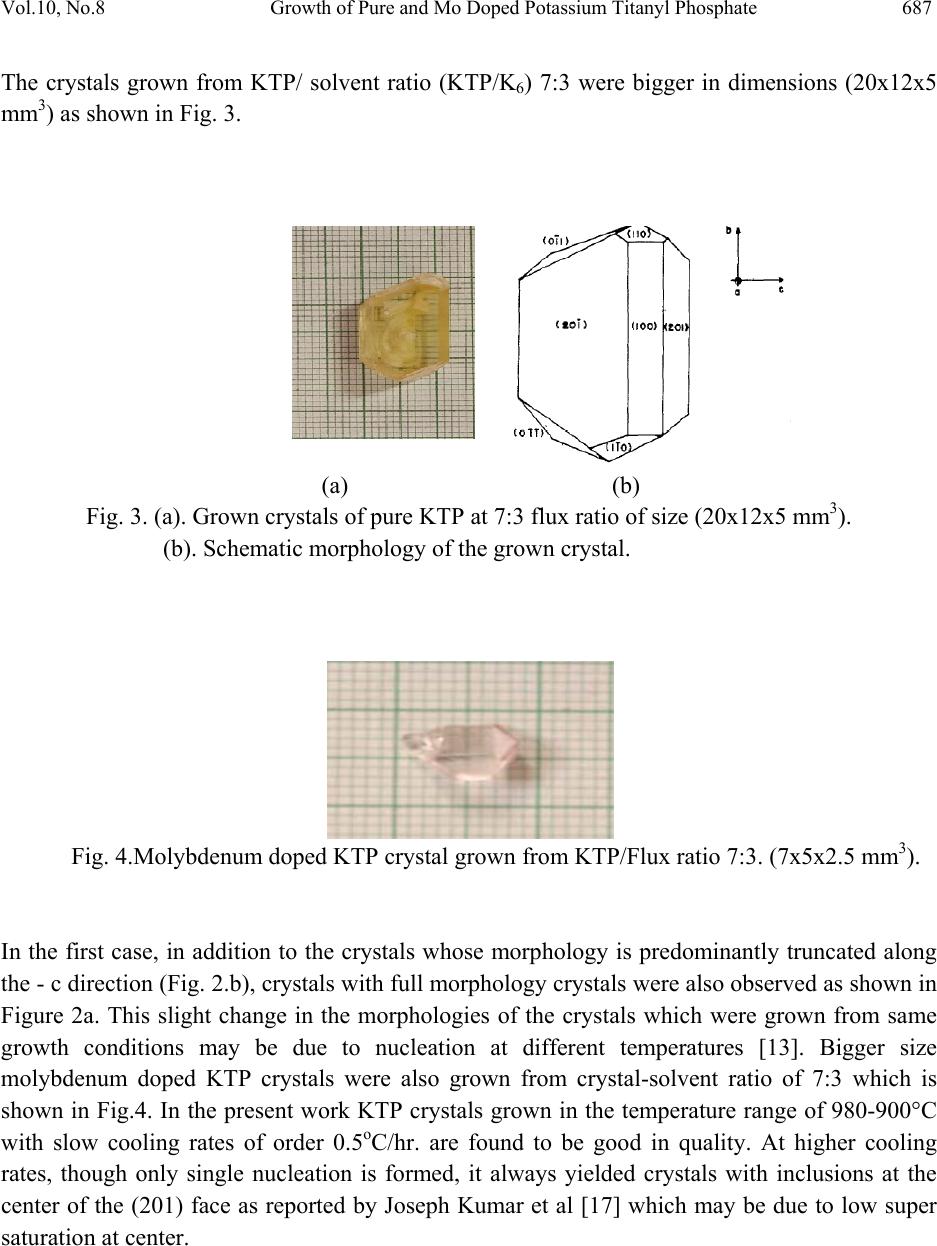 Vol.10, No.8 Growth of Pure and Mo Doped Potassium Titanyl Phosphate 687 The crystals grown from KTP/ solvent ratio (KTP/K6) 7:3 were bigger in dimensions (20x12x5 mm3) as shown in Fig. 3. (a) (b) Fig. 3. (a). Grown crystals of pure KTP at 7:3 flux ratio of size (20x12x5 mm3). (b). Schematic morphology of the grown crystal. Fig. 4.Molybdenum doped KTP crystal grown from KTP/Flux ratio 7:3. (7x5x2.5 mm3). In the first case, in addition to the crystals whose morphology is predominantly truncated along the - c direction (Fig. 2.b), crystals with full morphology crystals were also observed as shown in Figure 2a. This slight change in the morphologies of the crystals which were grown from same growth conditions may be due to nucleation at different temperatures [13]. Bigger size molybdenum doped KTP crystals were also grown from crystal-solvent ratio of 7:3 which is shown in Fig.4. In the present work KTP crystals grown in the temperature range of 980-900°C with slow cooling rates of order 0.5oC/hr. are found to be good in quality. At higher cooling rates, though only single nucleation is formed, it always yielded crystals with inclusions at the center of the (201) face as reported by Joseph Kumar et al [17] which may be due to low super saturation at center.  688 J. Rajeev Gandhi, B. Vijayalakshmi, M. Rathnakumari, P. Sureshkumar Vol.10, No.8 4. CHARACTERIZATION STUDIES OF GROWN CRYSTAL 4.1. Powder X-Ray Diffraction Pattern of KTP Crystal Powder X-ray diffraction studies were performed on the crystals of KTP grown from different precursor ratios and MoO3 doped KTP crystal to identify the phase formation and to determine the lattice parameter values. X-ray powder patterns of KTP were recorded using bruker D4 X-ray diffractometer. Monochromatic intense X-ray of wave length 1.540598 A° (cu kα) was used. Fig.5 shows the X-ray diffraction pattern of KTP crystals grown at different KTP/K6 ratio and MoO3 doped crystals. The powder X-ray diffraction spectrum shows that the data agrees well with the data of ASTM standard for KTiOPO4. 10 20 30 40 50 60 70 (603) (024) (044) (402) (411) (013) (310) (011)(201) (110) Intens ity 2 Theta (deg ree)X Y (233) (424) (233) KTP/K6 Ratio(7:3) Pure KTP crystal KTP/K6 Ratio(1:1) Pure KTP crystal MoO3Doped KTP crystal KTP/K6 Ratio(7:3) (313) Fig. 5. XRD-spectrum of pure and doped KTP crystal 4.2. UV-Absorption Studies The absorption spectra of grown crystals were studied using Varian Cary 5E UV-visible –NIR spectrometer in the spectral region of 200-2500 nm. Fig.6 Shows the UV-Spectrum of pure and Mo doped KTP crystals. The curve found to have cut- off wavelength for pure and doped at 353 nm and 398 nm respectively. The MoO3 doped KTP crystals shows a very sharp absorption at the UV-Cut off unlike the pure KTP crystal. In the latter the absorption curve of MoO3 doped KTP shows an absorption peak at 775 nm.  Vol.10, No.8 Growth of Pure and Mo Doped Potassium Titanyl Phosphate 689 5001000 1500 2000 2500 Wave len g th (n m) Absorption (%) Y X pure KTP MoO3+KTP Fig. 6.UV-Absorption spectrum of pure and doped KTP crystal 4.3. FTIR-Analysis The grown crystal is subjected to Fourier Transform Infra-Red (FTIR) analysis in order to determine the functional groups in the crystal. The vibrational mode of KTP in the Fig.7 was determined with the help of Bruker IFS 66 V spectrophotometer in the range of 2500-450 cm-1 by KBr pellet method. The unit cell of KTP contains eight formula units. The structure of KTP is characterized by chains of corner linked octahedral which are separated by tetrahedral. Alternating long and short Ti-O bonds occur along the chain resulting in a large directional polarization. The K+ ion which has high co-ordination number site is weakly bounded to both octahedral and tetrahedral which results in the arise of super ionic conductivity properties. The absorption peak at 2085 cm-1 can be assigned to the stretching vibration of second overtone bands of . The absorption peaks around 973 cm-1 and 1648 cm-1 confirms the stretching vibration of first over tone bands of the . The peaks at 1552 cm-1 and 1466 cm-1 represent the vibration of combination bands of . The absorption peak at 1043 cm- 1 and 1022 cm-1 indicates the presence of medium board vibration of (ν3). The absorption at 970 cm-1 and 997 cm-1 indicates the vibration of strong bonds. The presence of (ν3) confirmed by the vibration at 822 cm-1 and 782 cm-1. The very strong vibration of is indicated by the absorption peak at 703 cm-1. The absorption at 639 cm-1 and 597 cm-1 indicates the vibration of (ν4). The absorption peaks at 491 cm-1 and 467 cm-1 indicates the very strong vibration of (ν4).  690 J. Rajeev Gandhi, B. Vijayalakshmi, M. Rathnakumari, P. Sureshkumar Vol.10, No.8 2500 2000 1500 1000500 Transmittanse (%) Wavenumber (cm-1) 467 503 556 597 639 703 782 970 1043 1648 1926 1943 2014 2085 2136 822 1552 1466 Pure KTP MoO3+ KTP 2323 16341458 823 1050 972 793 714 638 598 553 508 Fig. 7. FTIR Spectrum of KTP crystal 4.4. Hardness Studies The micro hardness of pure and molybdenum doped KTP crystal was measured by REICHERT MD 4000E ultra micro hardness tester using a Vickers diamond indenter. The variation of micro hardness (Hv) with the applied loads for KTP crystals is shown in Fig (8). By knowing the average diagonal length of the indented impression the micro hardness number (Hv) was found from the relation Ө .The micro hardness number found decreases with the increase of load and becomes constant beyond 175g. The hardness of pure KTP crystal is higher compared to molybdenum doped KTP crystal. Fig. 8. Hardness vs load 406080100 120 140 160 180 200 220 250 300 350 400 450 500 Vickers Hardness(Hv) Load in (g) Pure KTP MoO3Doped KTP  Vol.10, No.8 Growth of Pure and Mo Doped Potassium Titanyl Phosphate 691 5. CONCLUSION 3. Results and discussion Pure and Mo doped KTP crystals were successfully grown using K6 flux with varying KTP/Flux ratios. The dependence of growth parameters and initial precursor ratio on crystal morphology and size were studied. Crystals grown from KTP/Flux ratios 7:3 found to be bigger in size compared to the crystal grown from 1:1 ratios. The grown crystals were characterised by XRD, UV, FTIR, and Hardness studies. The powder X-Ray diffraction study on the grown KTP crystals was performed to determine the lattice parameters. The UV and FTIR spectrum shows the presence of absorbance and functional groups of KTP crystals. The hardness of the pure KTP crystal found to be higher than the Mo doped KTP crystal. ACKNOWLEDGEMENT The authors would like to thank DRDO for the research grant to carry out this Project. (Ref.No.ERIP/ER/0504330/M/01/917) REFERENCES [1]. K. Iliev, P. Peshev, V. Nikolov, I. Koseva, J. Cryst. Growth 219 (1990) 100. [2]. J.D. Bierlein, C.B. Arweiler, Appl. Phys. Lett. 49 (1986) 917. [3]. J.D. Bierlein, H. Vanherzeele, J. Opt. Soc. Am. B 6 (1989) 622. [4]. J.C. Jacco, G.M. Loiacono, M. Jaso, G. Mizell, B. Greenberg, J. Cryst. Growth 70 (1984) 484. [5]. J.D. Bierlein, A. Ferretti, L.H. Brizner, W.Y. Hsu, Appl. Phys.Lett. 50 (1987) 1216. [6]. J.D. Bierlein, H. Vanherzeele, J. Opt. Soc. Am. B6 (1989) 622. [7]. Ashutosh Kacker, Max April , Robert F. Ward , International Journal of Pediatric Otorhinolaryngology 59 (2001) 15 [8]. J.D. Bierlein, H. Vanherzeele, J. Opt. Soc. Am. B6 (1989) 622. [9]. R.A. Laudise, R.J. Cava, A.J. Caporaso, J. Crystal Growth 74 (1986) 275. [10]. CAI Defan and YANG Zhengtang, J.Cryst.Growth 79 (1986)974. [11]. L.K. Chang, L.T. Chang, J.Galperin, P.A.Morris Hotsenpiller, J.D. Birerlein, J. Cryst. Growth 137 (1994) 107. [12]. G.M. Loiacono, T.F. McGee, G. Kostecky, J. Crystal Growth 104 (1990) 389. [13]. M.N. Satyanarayan, H.L. Bhat, Journal of Crystal Growth 181 (1997) 281. [14]. G.Dhanaraj and H.L.Bhat J.Materials letters 10(1990) 283 [15]. Jiyang Wang, Huaijin, minhua Jiang, Mariana,Victor maltsev, and Nikolay Leonyuk Crystal growth &Design. 2009, 9, 1190 [16]. K. W. Godfrey, P. A. Thomas. E. Watts Materials Science and Engineering, B9 (1991) 479 [17]. F.Joseph Kumar, S. Ganesa Moorthy, C. Subramanian, Bocelli, Materials Science and Engineering, B49 (1997) 31 F. |