Paper Menu >>
Journal Menu >>
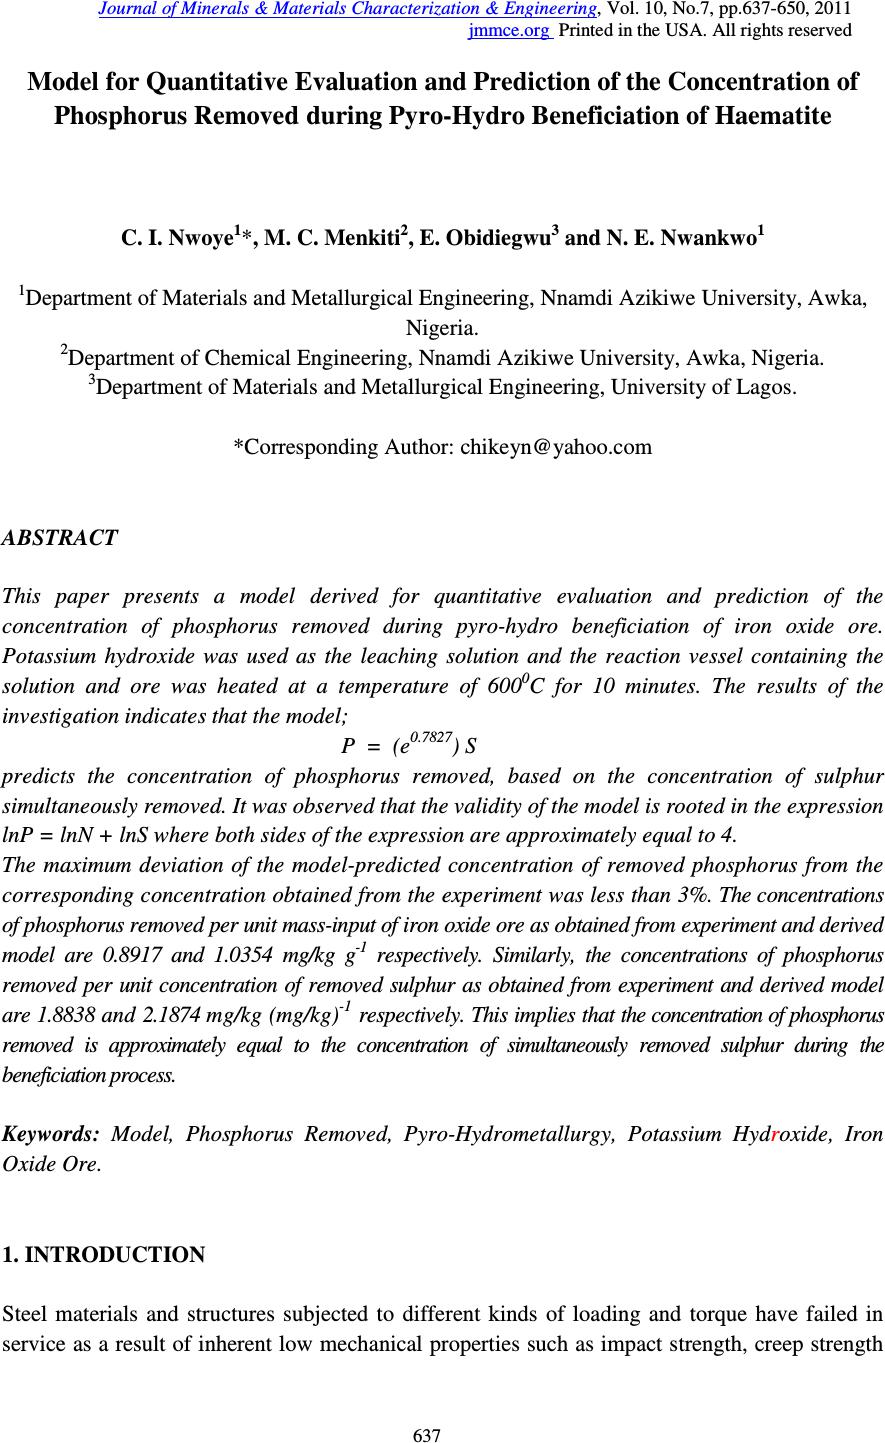 Journal of Minerals & Materials Characterization & Engineering, Vol. 10, No.7, pp.637-650, 2011 jmmce.org Printed in the USA. All rights reserved 637 Model for Quantitative Evaluation and Prediction of the Concentration of Phosphorus Removed during Pyro-Hydro Beneficiation of Haematite C. I. Nwoye 1 *, M. C. Menkiti 2 , E. Obidiegwu 3 and N. E. Nwankwo 1 1 Department of Materials and Metallurgical Engineering, Nnamdi Azikiwe University, Awka, Nigeria. 2 Department of Chemical Engineering, Nnamdi Azikiwe University, Awka, Nigeria. 3 Department of Materials and Metallurgical Engineering, University of Lagos. *Corresponding Author: chikeyn@yahoo.com ABSTRACT This paper presents a model derived for quantitative evaluation and prediction of the concentration of phosphorus removed during pyro-hydro beneficiation of iron oxide ore. Potassium hydroxide was used as the leaching solution and the reaction vessel containing the solution and ore was heated at a temperature of 600 0 C for 10 minutes. The results of the investigation indicates that the model; P = (e 0.7827 ) S predicts the concentration of phosphorus removed, based on the concentration of sulphur simultaneously removed. It was observed that the validity of the model is rooted in the expression lnP = lnN + lnS where both sides of the expression are approximately equal to 4. The maximum deviation of the model-predicted concentration of removed phosphorus from the corresponding concentration obtained from the experiment was less than 3%. The concentrations of phosphorus removed per unit mass-input of iron oxide ore as obtained from experiment and derived model are 0.8917 and 1.0354 mg/kg g -1 respectively. Similarly, the concentrations of phosphorus removed per unit concentration of removed sulphur as obtained from experiment and derived model are 1.8838 and 2.1874 mg/kg (mg/kg) -1 respectively. This implies that the concentration of phosphorus removed is approximately equal to the concentration of simultaneously removed sulphur during the beneficiation process. Keywords: Model, Phosphorus Removed, Pyro-Hydrometallurgy, Potassium Hydroxide, Iron Oxide Ore. 1. INTRODUCTION Steel materials and structures subjected to different kinds of loading and torque have failed in service as a result of inherent low mechanical properties such as impact strength, creep strength 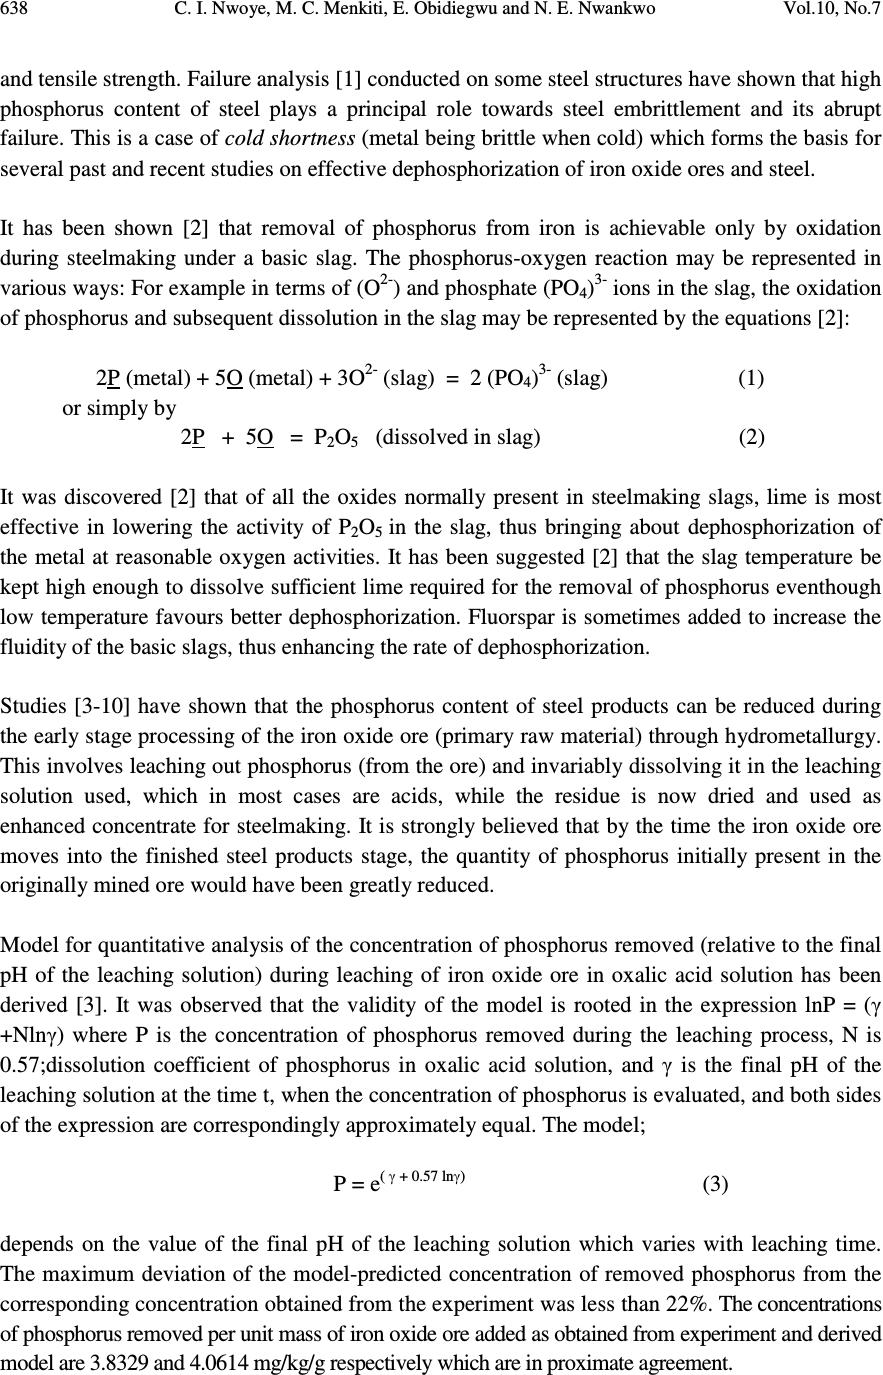 638 C. I. Nwoye, M. C. Menkiti, E. Obidiegwu and N. E. Nwankwo Vol.10, No.7 and tensile strength. Failure analysis [1] conducted on some steel structures have shown that high phosphorus content of steel plays a principal role towards steel embrittlement and its abrupt failure. This is a case of cold shortness (metal being brittle when cold) which forms the basis for several past and recent studies on effective dephosphorization of iron oxide ores and steel. It has been shown [2] that removal of phosphorus from iron is achievable only by oxidation during steelmaking under a basic slag. The phosphorus-oxygen reaction may be represented in various ways: For example in terms of (O 2- ) and phosphate (PO 4 ) 3- ions in the slag, the oxidation of phosphorus and subsequent dissolution in the slag may be represented by the equations [2]: 2P (metal) + 5O (metal) + 3O 2- (slag) = 2 (PO 4 ) 3- (slag) (1) or simply by 2P + 5O = P 2 O 5 (dissolved in slag) (2) It was discovered [2] that of all the oxides normally present in steelmaking slags, lime is most effective in lowering the activity of P 2 O 5 in the slag, thus bringing about dephosphorization of the metal at reasonable oxygen activities. It has been suggested [2] that the slag temperature be kept high enough to dissolve sufficient lime required for the removal of phosphorus eventhough low temperature favours better dephosphorization. Fluorspar is sometimes added to increase the fluidity of the basic slags, thus enhancing the rate of dephosphorization. Studies [3-10] have shown that the phosphorus content of steel products can be reduced during the early stage processing of the iron oxide ore (primary raw material) through hydrometallurgy. This involves leaching out phosphorus (from the ore) and invariably dissolving it in the leaching solution used, which in most cases are acids, while the residue is now dried and used as enhanced concentrate for steelmaking. It is strongly believed that by the time the iron oxide ore moves into the finished steel products stage, the quantity of phosphorus initially present in the originally mined ore would have been greatly reduced. Model for quantitative analysis of the concentration of phosphorus removed (relative to the final pH of the leaching solution) during leaching of iron oxide ore in oxalic acid solution has been derived [3]. It was observed that the validity of the model is rooted in the expression lnP = (γ +Nlnγ) where P is the concentration of phosphorus removed during the leaching process, N is 0.57;dissolution coefficient of phosphorus in oxalic acid solution, and γ is the final pH of the leaching solution at the time t, when the concentration of phosphorus is evaluated, and both sides of the expression are correspondingly approximately equal. The model; P = e ( γ + 0.57 lnγ) (3) depends on the value of the final pH of the leaching solution which varies with leaching time. The maximum deviation of the model-predicted concentration of removed phosphorus from the corresponding concentration obtained from the experiment was less than 22%. The concentrations of phosphorus removed per unit mass of iron oxide ore added as obtained from experiment and derived model are 3.8329 and 4.0614 mg/kg/g respectively which are in proximate agreement. 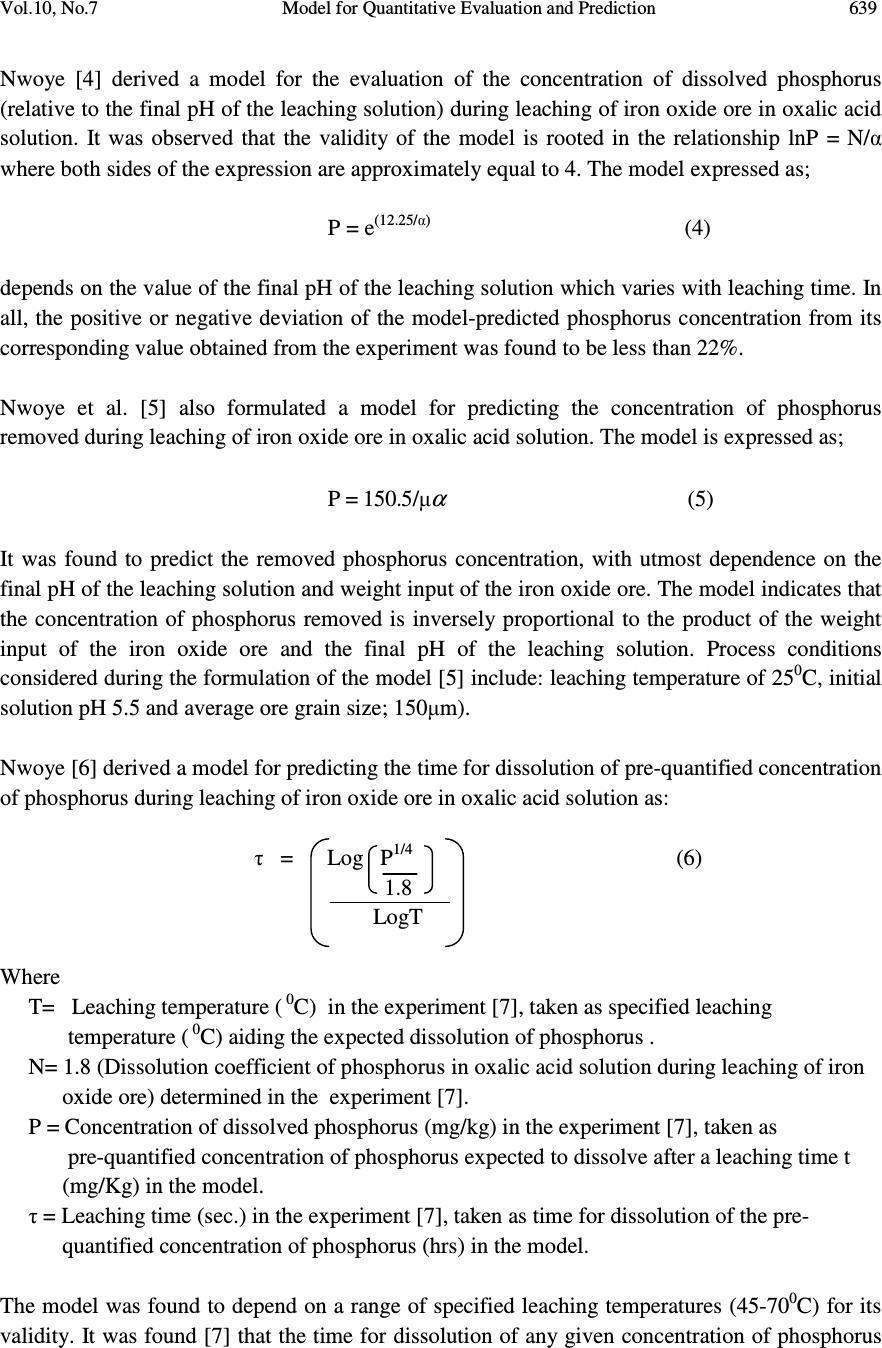 Vol.10, No.7 Model for Quantitative Evaluation and Prediction 639 Nwoye [4] derived a model for the evaluation of the concentration of dissolved phosphorus (relative to the final pH of the leaching solution) during leaching of iron oxide ore in oxalic acid solution. It was observed that the validity of the model is rooted in the relationship lnP = N/ α where both sides of the expression are approximately equal to 4. The model expressed as; P = e (12.25/α) (4) depends on the value of the final pH of the leaching solution which varies with leaching time. In all, the positive or negative deviation of the model-predicted phosphorus concentration from its corresponding value obtained from the experiment was found to be less than 22%. Nwoye et al. [5] also formulated a model for predicting the concentration of phosphorus removed during leaching of iron oxide ore in oxalic acid solution. The model is expressed as; P = 150.5/ µ α (5) It was found to predict the removed phosphorus concentration, with utmost dependence on the final pH of the leaching solution and weight input of the iron oxide ore. The model indicates that the concentration of phosphorus removed is inversely proportional to the product of the weight input of the iron oxide ore and the final pH of the leaching solution. Process conditions considered during the formulation of the model [5] include: leaching temperature of 25 0 C, initial solution pH 5.5 and average ore grain size; 150 µ m). Nwoye [6] derived a model for predicting the time for dissolution of pre-quantified concentration of phosphorus during leaching of iron oxide ore in oxalic acid solution as: τ = Log P 1/4 (6) 1.8 LogT Where T= Leaching temperature ( 0 C) in the experiment [7], taken as specified leaching temperature ( 0 C) aiding the expected dissolution of phosphorus . N= 1.8 (Dissolution coefficient of phosphorus in oxalic acid solution during leaching of iron oxide ore) determined in the experiment [7]. P = Concentration of dissolved phosphorus (mg/kg) in the experiment [7], taken as pre-quantified concentration of phosphorus expected to dissolve after a leaching time t (mg/Kg) in the model. τ = Leaching time (sec.) in the experiment [7], taken as time for dissolution of the pre- quantified concentration of phosphorus (hrs) in the model. The model was found to depend on a range of specified leaching temperatures (45-70 0 C) for its validity. It was found [7] that the time for dissolution of any given concentration of phosphorus 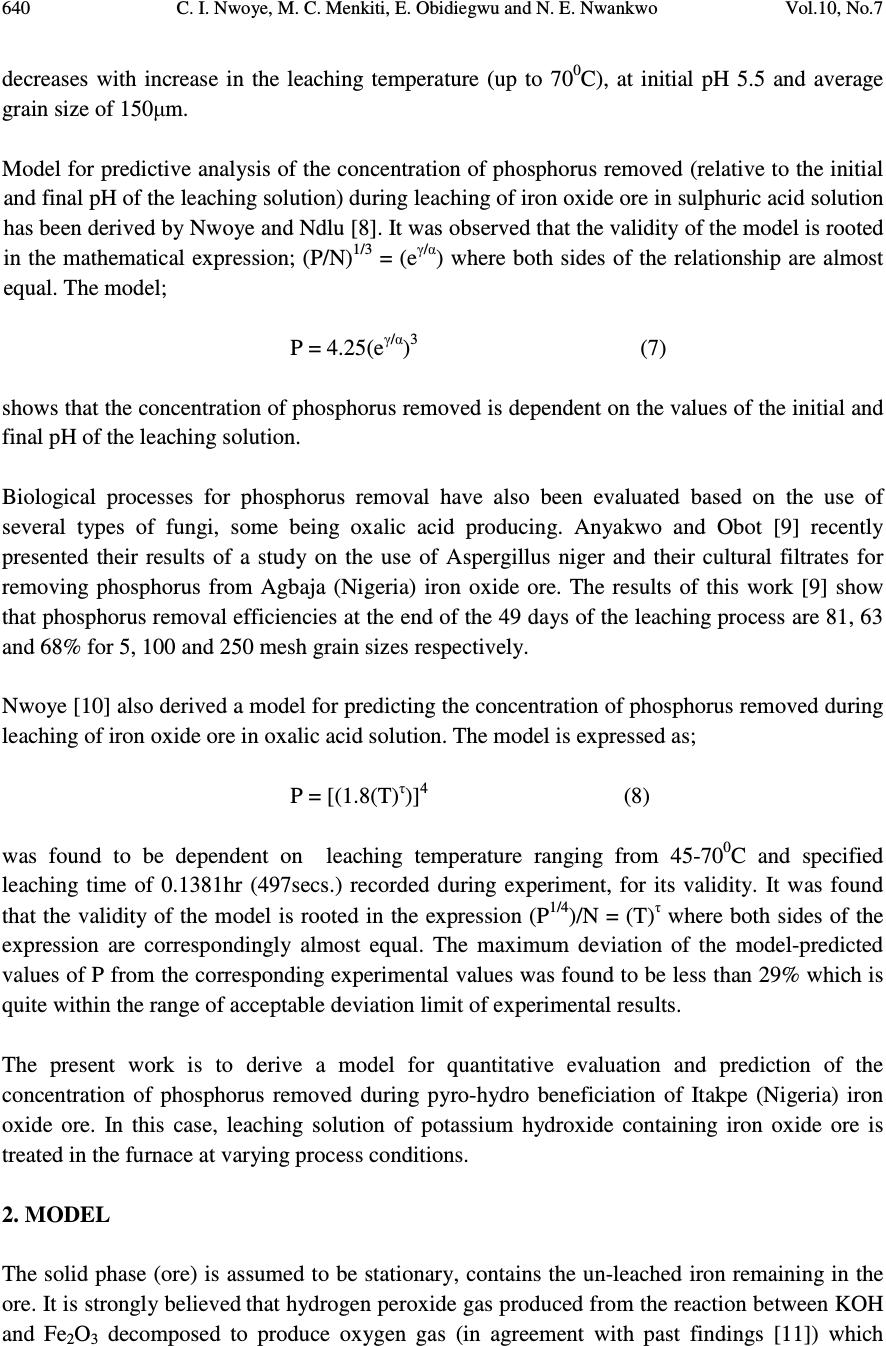 640 C. I. Nwoye, M. C. Menkiti, E. Obidiegwu and N. E. Nwankwo Vol.10, No.7 decreases with increase in the leaching temperature (up to 70 0 C), at initial pH 5.5 and average grain size of 150 µ m. Model for predictive analysis of the concentration of phosphorus removed (relative to the initial and final pH of the leaching solution) during leaching of iron oxide ore in sulphuric acid solution has been derived by Nwoye and Ndlu [8]. It was observed that the validity of the model is rooted in the mathematical expression; (P/N) 1/3 = (e γ/α ) where both sides of the relationship are almost equal. The model; P = 4.25(e γ/α ) 3 (7) shows that the concentration of phosphorus removed is dependent on the values of the initial and final pH of the leaching solution. Biological processes for phosphorus removal have also been evaluated based on the use of several types of fungi, some being oxalic acid producing. Anyakwo and Obot [9] recently presented their results of a study on the use of Aspergillus niger and their cultural filtrates for removing phosphorus from Agbaja (Nigeria) iron oxide ore. The results of this work [9] show that phosphorus removal efficiencies at the end of the 49 days of the leaching process are 81, 63 and 68% for 5, 100 and 250 mesh grain sizes respectively. Nwoye [10] also derived a model for predicting the concentration of phosphorus removed during leaching of iron oxide ore in oxalic acid solution. The model is expressed as; P = [(1.8(T) τ )] 4 (8) was found to be dependent on leaching temperature ranging from 45-70 0 C and specified leaching time of 0.1381hr (497secs.) recorded during experiment, for its validity. It was found that the validity of the model is rooted in the expression (P 1/4 )/N = (T) τ where both sides of the expression are correspondingly almost equal. The maximum deviation of the model-predicted values of P from the corresponding experimental values was found to be less than 29% which is quite within the range of acceptable deviation limit of experimental results. The present work is to derive a model for quantitative evaluation and prediction of the concentration of phosphorus removed during pyro-hydro beneficiation of Itakpe (Nigeria) iron oxide ore. In this case, leaching solution of potassium hydroxide containing iron oxide ore is treated in the furnace at varying process conditions. 2. MODEL The solid phase (ore) is assumed to be stationary, contains the un-leached iron remaining in the ore. It is strongly believed that hydrogen peroxide gas produced from the reaction between KOH and Fe 2 O 3 decomposed to produce oxygen gas (in agreement with past findings [11]) which 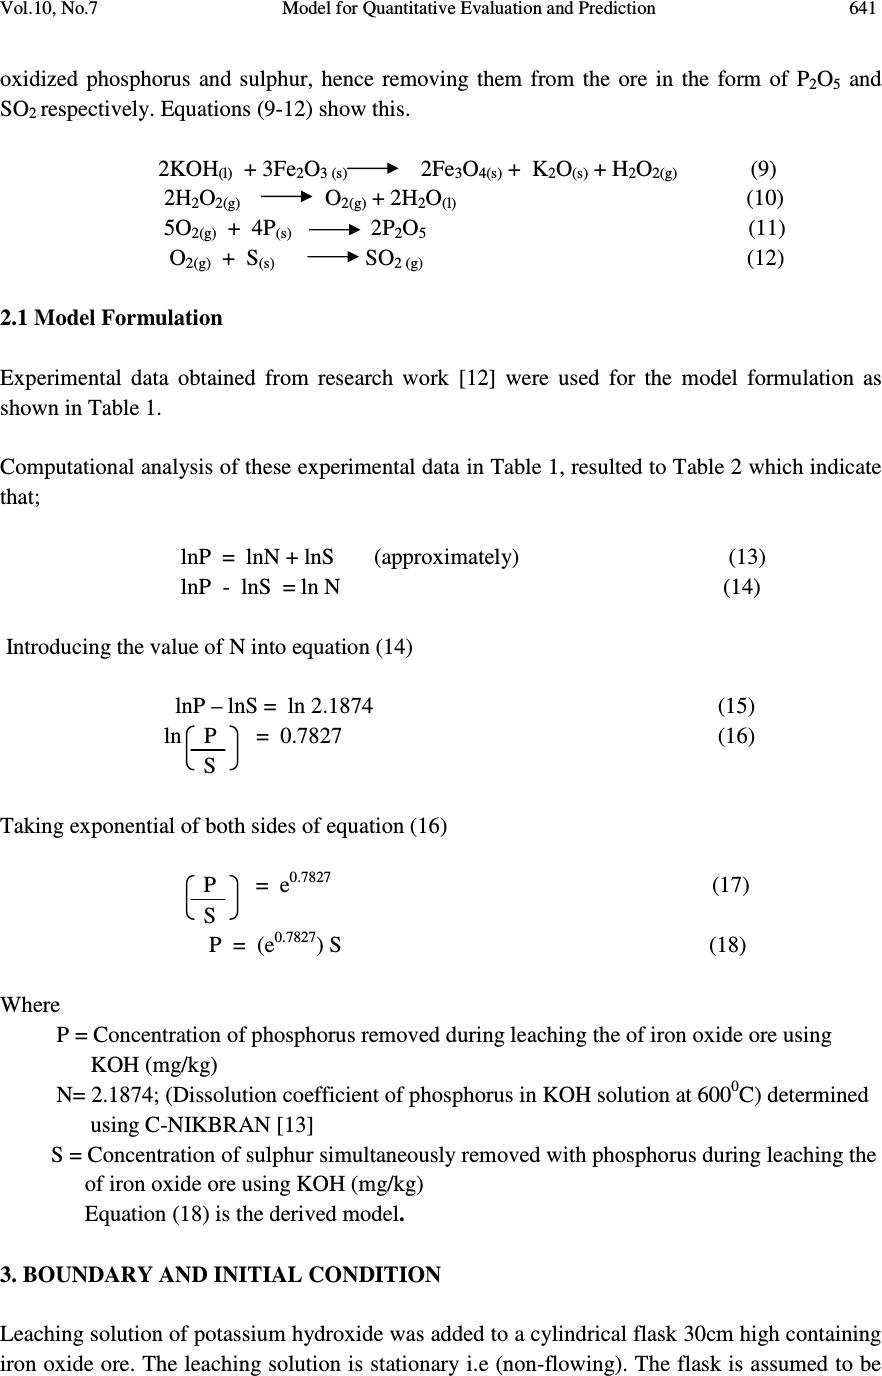 Vol.10, No.7 Model for Quantitative Evaluation and Prediction 641 oxidized phosphorus and sulphur, hence removing them from the ore in the form of P 2 O 5 and SO 2 respectively. Equations (9-12) show this. 2KOH (l) + 3Fe 2 O 3 (s) 2Fe 3 O 4(s) + K 2 O (s) + H 2 O 2(g) (9) 2H 2 O 2(g) O 2(g) + 2H 2 O (l) (10) 5O 2(g) + 4P (s) 2P 2 O 5 (11) O 2(g) + S (s) SO 2 (g) (12) 2.1 Model Formulation Experimental data obtained from research work [12] were used for the model formulation as shown in Table 1. Computational analysis of these experimental data in Table 1, resulted to Table 2 which indicate that; lnP = lnN + lnS (approximately) (13) lnP - lnS = ln N (14) Introducing the value of N into equation (14) lnP – lnS = ln 2.1874 (15) ln P = 0.7827 (16) S Taking exponential of both sides of equation (16) P = e 0.7827 (17) S P = (e 0.7827 ) S (18) Where P = Concentration of phosphorus removed during leaching the of iron oxide ore using KOH (mg/kg) N= 2.1874; (Dissolution coefficient of phosphorus in KOH solution at 600 0 C) determined using C-NIKBRAN [13] S = Concentration of sulphur simultaneously removed with phosphorus during leaching the of iron oxide ore using KOH (mg/kg) Equation (18) is the derived model . 3. BOUNDARY AND INITIAL CONDITION Leaching solution of potassium hydroxide was added to a cylindrical flask 30cm high containing iron oxide ore. The leaching solution is stationary i.e (non-flowing). The flask is assumed to be 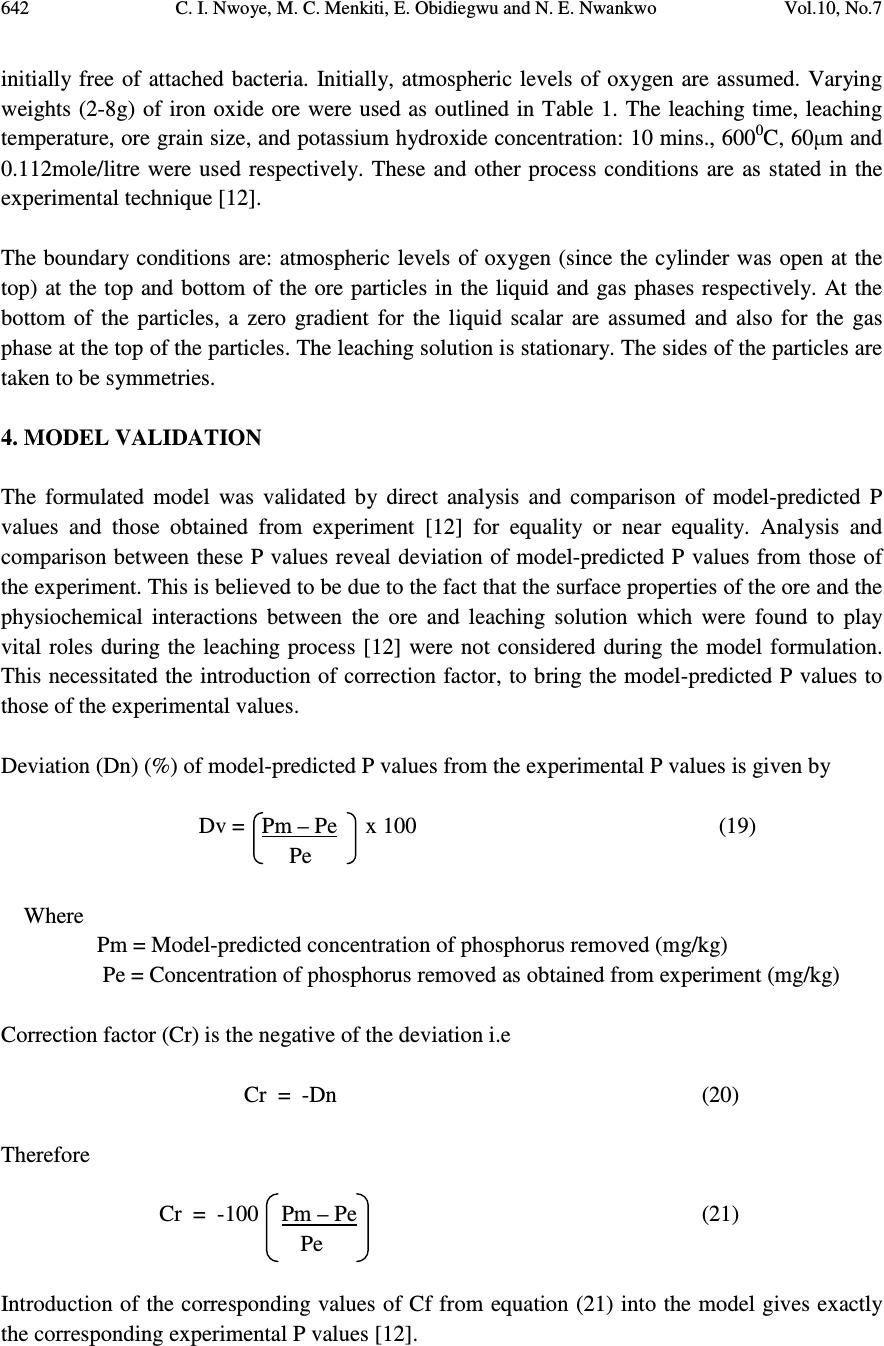 642 C. I. Nwoye, M. C. Menkiti, E. Obidiegwu and N. E. Nwankwo Vol.10, No.7 initially free of attached bacteria. Initially, atmospheric levels of oxygen are assumed. Varying weights (2-8g) of iron oxide ore were used as outlined in Table 1. The leaching time, leaching temperature, ore grain size, and potassium hydroxide concentration: 10 mins., 600 0 C, 60 µ m and 0.112mole/litre were used respectively. These and other process conditions are as stated in the experimental technique [12]. The boundary conditions are: atmospheric levels of oxygen (since the cylinder was open at the top) at the top and bottom of the ore particles in the liquid and gas phases respectively. At the bottom of the particles, a zero gradient for the liquid scalar are assumed and also for the gas phase at the top of the particles. The leaching solution is stationary. The sides of the particles are taken to be symmetries. 4. MODEL VALIDATION The formulated model was validated by direct analysis and comparison of model-predicted P values and those obtained from experiment [12] for equality or near equality. Analysis and comparison between these P values reveal deviation of model-predicted P values from those of the experiment. This is believed to be due to the fact that the surface properties of the ore and the physiochemical interactions between the ore and leaching solution which were found to play vital roles during the leaching process [12] were not considered during the model formulation. This necessitated the introduction of correction factor, to bring the model-predicted P values to those of the experimental values. Deviation (Dn) (%) of model-predicted P values from the experimental P values is given by Dv = Pm – Pe x 100 (19) Pe Where Pm = Model-predicted concentration of phosphorus removed (mg/kg) Pe = Concentration of phosphorus removed as obtained from experiment (mg/kg) Correction factor (Cr) is the negative of the deviation i.e Cr = -Dn (20) Therefore Cr = -100 Pm – Pe (21) Pe Introduction of the corresponding values of Cf from equation (21) into the model gives exactly the corresponding experimental P values [12]. 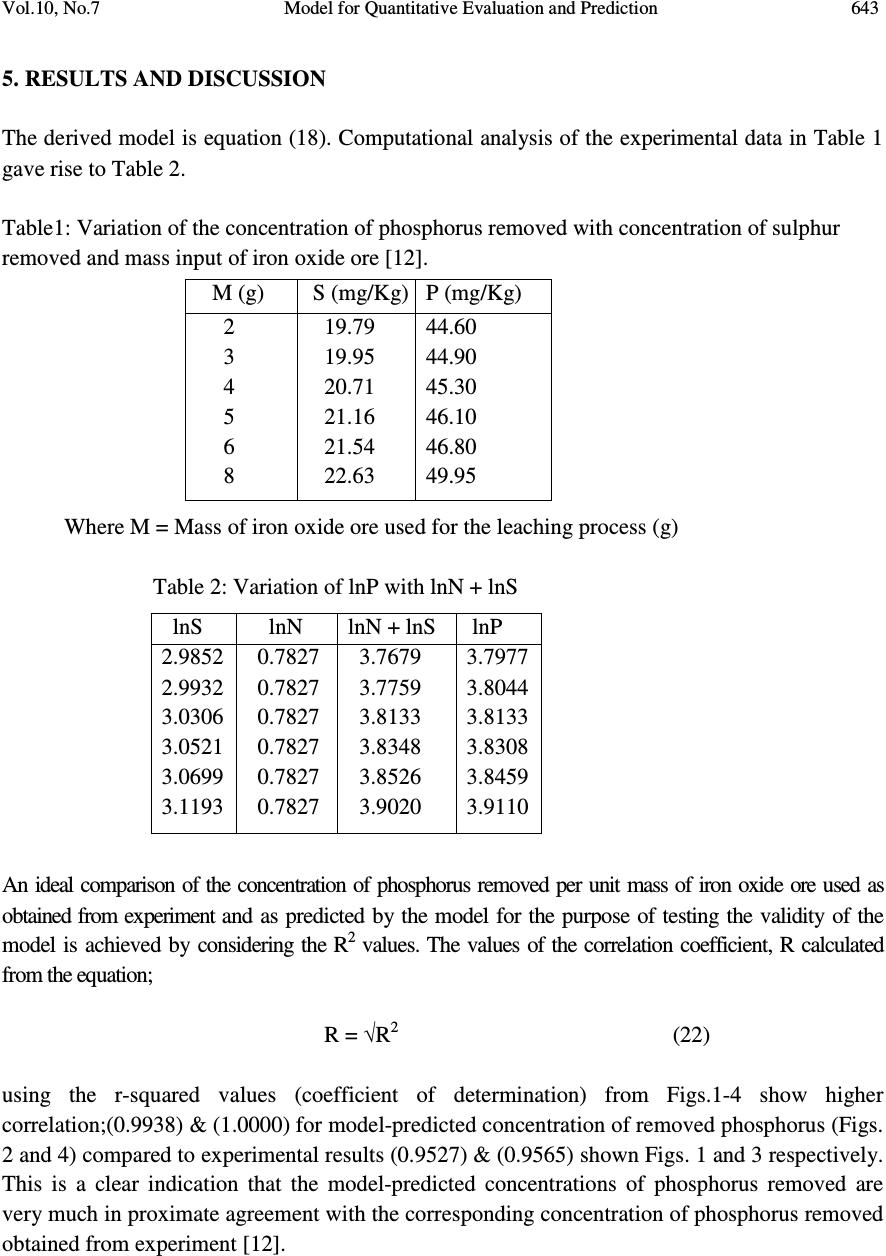 Vol.10, No.7 Model for Quantitative Evaluation and Prediction 643 5. RESULTS AND DISCUSSION The derived model is equation (18). Computational analysis of the experimental data in Table 1 gave rise to Table 2. Table1: Variation of the concentration of phosphorus removed with concentration of sulphur removed and mass input of iron oxide ore [12]. Where M = Mass of iron oxide ore used for the leaching process (g) Table 2: Variation of lnP with lnN + lnS An ideal comparison of the concentration of phosphorus removed per unit mass of iron oxide ore used as obtained from experiment and as predicted by the model for the purpose of testing the validity of the model is achieved by considering the R 2 values. The values of the correlation coefficient, R calculated from the equation; R = √ R 2 (22) using the r-squared values (coefficient of determination) from Figs.1-4 show higher correlation;(0.9938) & (1.0000) for model-predicted concentration of removed phosphorus (Figs. 2 and 4) compared to experimental results (0.9527) & (0.9565) shown Figs. 1 and 3 respectively. This is a clear indication that the model-predicted concentrations of phosphorus removed are very much in proximate agreement with the corresponding concentration of phosphorus removed obtained from experiment [12]. M (g) S (mg/Kg) P (mg/Kg) 2 3 4 5 6 8 19.79 19.95 20.71 21.16 21.54 22.63 44.60 44.90 45.30 46.10 46.80 49.95 lnS lnN lnN + lnS lnP 2.9852 2.9932 3.0306 3.0521 3.0699 3.1193 0.7827 0.7827 0.7827 0.7827 0.7827 0.7827 3.7679 3.7759 3.8133 3.8348 3.8526 3.9020 3.7977 3.8044 3.8133 3.8308 3.8459 3.9110 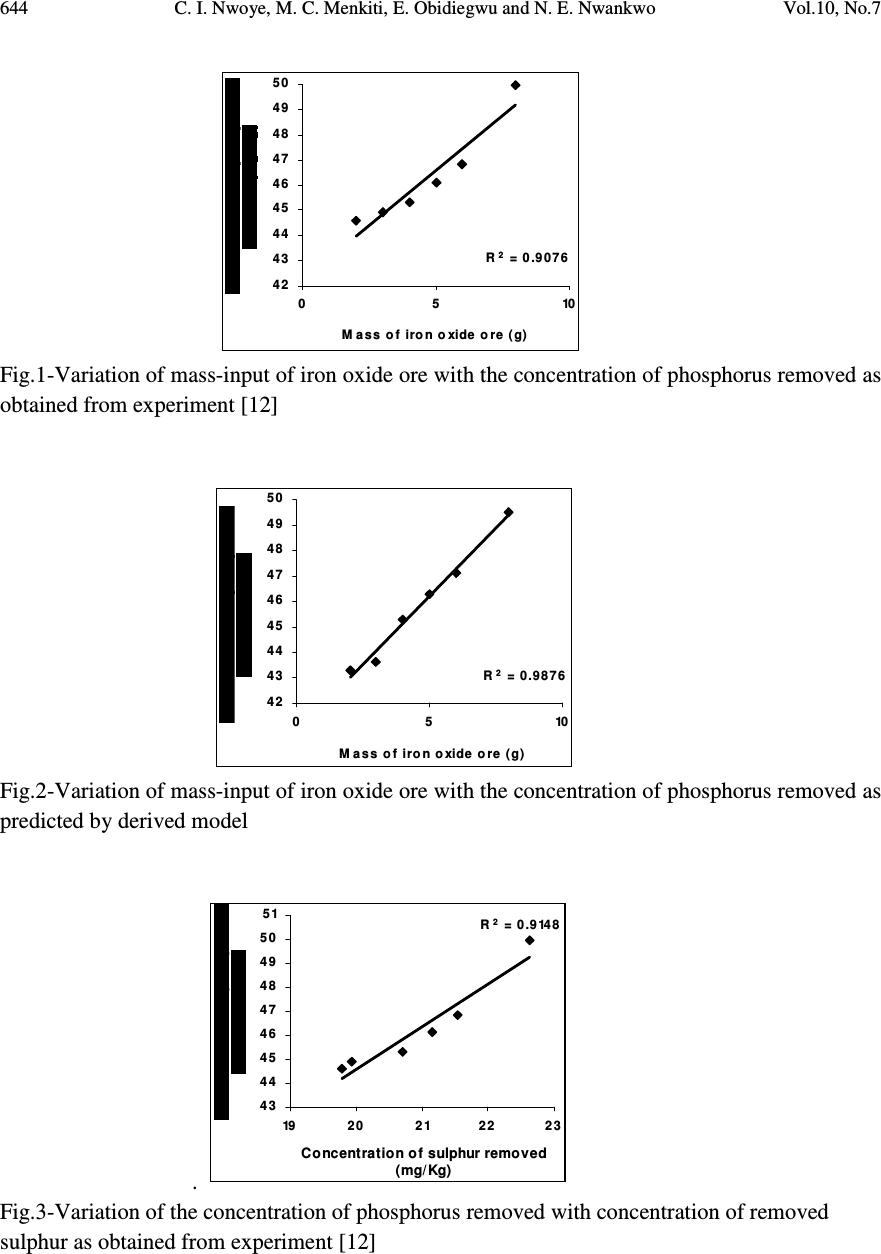 644 C. I. Nwoye, M. C. Menkiti, E. Obidiegwu and N. E. Nwankwo Vol.10, No.7 R 2 = 0.9076 4 2 4 3 4 4 4 5 4 6 4 7 4 8 4 9 5 0 05 10 M ass of iron oxide ore (g) Fig.1-Variation of mass-input of iron oxide ore with the concentration of phosphorus removed as obtained from experiment [12] R 2 = 0.9876 4 2 4 3 4 4 4 5 4 6 4 7 4 8 4 9 5 0 05 10 M ass of iron oxide ore (g) Fig.2-Variation of mass-input of iron oxide ore with the concentration of phosphorus removed as predicted by derived model . R 2 = 0.9148 4 3 4 4 4 5 4 6 4 7 4 8 4 9 5 0 51 192 0212 22 3 Concentration of sulphur removed (mg/Kg) Fig.3-Variation of the concentration of phosphorus removed with concentration of removed sulphur as obtained from experiment [12]  Vol.10, No.7 Model for Quantitative Evaluation and Prediction 645 R 2 = 1 42 43 44 45 46 47 48 49 50 192 0212 22 3 Concentration of sulphur removed ( m g/Kg ) Fig.4-Variation of the concentration of phosphorus removed with concentration of removed sulphur as predicted by derived model. Comparison of Figs. 5 and 6 show that both values of the concentration of phosphorus removed obtained from the experiment [12] (line ExD) and the derived model (line MoD) in relation to both the mass of iron oxide ore (added) and concentration of sulphur simultaneously removed are generally quite close hence depicting proximate agreement and validity of the model. 42 43 44 45 46 47 48 49 50 192 02 12 22 3 Concentration of sulphur removed ( m g/Kg ) ExD Mo D Fig.5-Comparison of the concentrations of phosphorus removed in relation to mass-input of iron oxide ore as obtained from experiment [12] and derived model 42 43 44 45 46 47 48 49 50 51 05 10 M ass of iron oxide ore (g) ExD Mo D Fig.6-Comparison of the concentrations of phosphorus removed in relation to the concentration of sulphur simultaneously removed as obtained from experiment [12] and derived model  646 C. I. Nwoye, M. C. Menkiti, E. Obidiegwu and N. E. Nwankwo Vol.10, No.7 5.1 Variation of Mass-Input of Iron Oxide Ore and Model-Predicted Concentration of Removed Phosphorus with the Associated Deviations It was found that the validity of the model is rooted in the expression lnP = lnN + lnS where both sides of the expression are correspondingly approximately equal to 4. Table 2 also agrees with equation (13) following the values of lnP and lnN + lnS evaluated from Table 1 as a result of the corresponding computational analysis. - 3 .5 - 3 - 2 .5 - 2 - 1.5 - 1 - 0 .5 0 0.5 1 42 44 46 48 50 Concentration of phosphorus removed (mg/Kg) Fig. 7: Variation of model-predicted concentration of phosphorus removed with its associated deviation from experimental values [12] The maximum deviation of the model-predicted concentration of phosphorus removed, from the corresponding experimental value is 2.94% which is quite within the acceptable deviation range of experimental results, hence depicting the usefulness of the model. Fig. 7 indicates that the highest and least deviations;-2.94% and 0% corresponds to the model-predicted concentrations of removed phosphorus: 43.2886 and 45.3011 mg/kg respectively. These values were found to correspond to the mass-input of iron oxide ore: 2 and 4g respectively as shown in Fig. 8. - 3 .5 - 3 - 2 .5 - 2 - 1.5 - 1 - 0 .5 0 0.5 1 05 10 M ass of iron oxide ore (g) Fig. 8: Effect of mass-input of iron oxide on the deviation of model-predicted concentration of phosphorus removed (from experimental values)  Vol.10, No.7 Model for Quantitative Evaluation and Prediction 647 5.2 Variation of the Correction Factor with the Model-Predicted Concentration of Phosphorus Removed Fig. 9 shows that the highest and least correction factors (+2.94% and 0%) which are same in magnitude also correspond to the model-predicted concentrations of removed phosphorus: 43.2886 and 45.3011 mg/kg and the mass-input of iron oxide ore: 2 and 4g respectively. -1 - 0 .5 0 0 .5 1 1.5 2 2 .5 3 3 .5 42 44 46 48 50 Concentration of phosphorus removed (mg/Kg) Fig. 9: Variation of model-predicted concentration of phosphorus removed with its associated correction factor Fig. 3 also shows that the values of the correction factor are opposite that of the deviation. This is attributed to the fact that correction factor is the negative of the deviation as shown in eqns. (20) and (21). It is believed that the correction factor takes care of the effects of the surface properties of the ore and the physiochemical interaction between the ore and the leaching solution which (affected experimental results) were not considered during the model formulation. Phosphorus removed per unit mass of iron oxide ore added during the pyro-hydro treatment process was determined following comparison of the concentration of phosphorus removed per unit mass-input of iron oxide ore obtained by calculations involving experimental results as well as derived model. 5.3 Determination of the Concentration of Phosphorus Removed per Unit Mass of Iron Oxide Ore Added Concentration of phosphorus removed (during the corporate treatment of the iron ore; leaching in potassium hydroxide solution and heating in the furnace) per unit mass of iron oxide ore P m (mg/kg/g) is calculated from the equation; P m = P/m (23) Therefore, a plot of concentration of phosphorus removed against mass of iron oxide ore added (as in Fig.1) gives a slope, S at points (49.95, 8) and (44.6, 2) following their substitution into the mathematical expression;  648 C. I. Nwoye, M. C. Menkiti, E. Obidiegwu and N. E. Nwankwo Vol.10, No.7 S = ∆P/∆m (24) Eqn. (24) is detailed as S = P 2 - P 1 / m 2 - m 1 (25) Where ∆P = Change in the concentrations of phosphorus removed P 2 , P 1 at mass values m 2 , m 1 . Considering the points (49.95, 8) and (44.6, 2) for (P 2 , m 2 ) and (P 1 , m 1 ) respectively, and substituting them into eqn. (25), gives the slope as 0.8917 mg/kg g -1 which is the concentration of phosphorus removed per unit mass of iron oxide ore added during the actual experimental pyro-hydro process. Also similar plot (as in Fig. 2) using model-predicted results gives a slope. Considering points (49.5009, 8) and (43.2886, 2) for (P 2 , m 2 ) and (P 1 , m 1 ) respectively and substituting them into eqn. (25) gives the value of slope, S as 1.0354 mg/kg g -1 . This is the model-predicted concentration of phosphorus removed per unit mass of iron oxide ore used for the beneficiated process. A comparison of these two values of removed phosphorus concentrations per unit mass-input of iron oxide ore shows proximate agreement. This indicates a very high degree of validity for the model. 5.4 Determination of the Concentration of Phosphorus Removed per Unit Concentration of Removed Sulphur Similarly, the concentration of phosphorus removed (during the corporate treatment of the iron ore; leaching in potassium hydroxide solution and heating in the furnace) per unit concentration of removed sulphur P s ; mg/kg (mg/kg) -1 is calculated from the equation; P s = P/S (26) A plot of concentration of phosphorus removed against concentration of removed sulphur (as in Fig.3) using experimental results gives a slope, S e = 1.8838mg/kg (mg/kg) -1 at points (49.95, 22.63) and (44.6, 19.79) for (P 2 , S 2 ) and (P 1 , S 1 ) respectively following their substitution into the mathematical expression; S e = ∆P/∆S (27) which is detailed as S e = P 2 - P 1 / S 2 - S 1 (28 ) Where ∆P = Change in the concentrations of phosphorus removed P 2 , P 1 at two concentration values of removed sulphur S 2 , S 1. This is the concentration of phosphorus removed per unit concentration of simultaneously removed sulphur during the actual experimental treatment of the iron oxide ore.  Vol.10, No.7 Model for Quantitative Evaluation and Prediction 649 A similar plot (as in Fig. 4) using model-predicted results gives a slope, S e = 2.1874 mg/kg (mg/kg) - 1 at points (49.5009, 22.63) and (43.2886, 19.79) for (P 2 , S 2 ) and (P 1 , S 1 ) respectively following their substitution into eqn. (28). This is the model-predicted concentration of phosphorus removed per unit concentration of removed sulphur. These two values of removed phosphorus concentrations per unit concentration of removed sulphur also indicate proximate agreement. However, the results of this evaluation show that the concentration of phosphorus removed is approximately equal to the concentration of the simultaneously removed sulphur during the beneficiation process. Introducing the value of N; 2.1874 into eqn. (13) and comparing it with the value of S e from model- predicted results (2.1874 mg/kg (mg/kg) -1 ) from Fig. 4 shows that the dissolution coefficient of phosphorus in KOH solution at 600 0 C (calculated using C-NIKBRAN [13] ) is equal to the slope of the plot of phosphorus removed against sulphur simultaneously removed. This implies that N = S e . 6. CONCLUSION Following derivation of a model for quantitative evaluation and prediction of the concentration of phosphorus removed during pyro-hydro beneficiation of iron oxide ore, it was observed that the validity of the model is rooted in the expression lnP = lnN + lnS where both sides of the expression are approximately equal to 4. The maximum deviation of the model-predicted concentration of removed phosphorus from the corresponding concentration obtained from the experiment was less than 3%. The concentrations of phosphorus removed per unit mass-input of iron oxide ore as obtained from experiment and derived model are 0.8917 and 1.0354 mg/kg g -1 respectively. Similarly, the concentrations of phosphorus removed per unit concentration of removed sulphur as obtained from experiment and derived model are 1.8838 and 2.1874mg/kg (mg/kg) -1 respectively. This implies that the concentration of phosphorus removed is approximately equal to the concentration of simultaneously removed sulphur during the beneficiation process. Further works should incorporate more process parameters into the model with the aim of reducing the deviations of the model- predicted P values from those of the experimental. REFERENCES [1] Chapman, W. A. P., (1972) Workshop Technology, part 1, 5 th edition, Edward Arnold, London, p31-51. [2] BOF Steel making-Theory. Iron and Steel Society, 2:145-147 [3] Nwoye, C. I., C. N. Mbah., C. C. Nwakwuo., and A. I. Ogbonna. (2010) Model for Quantitative Analysis of Phosphorus Removed during Leaching of Iron Oxide Ore in Oxalic Acid Solution. JMMCE, 9(4):331-341. [4] Nwoye, C. I. (2009) Model for Evaluation of the Concentration of Dissolved Phosphorus during Leaching of Iron Oxide Ore in Oxalic Acid Solution. JMMCE, 8(3):181-188. [5] Nwoye, C. I., Agu, P. C., Mark, U., Ikele, U. S., Mbuka, I. E., and Anyakwo, C. N. (2008) Model for Predicting Phosphorus Removal in Relation to Weight of Iron Oxide Ore and pH during Leaching with Oxalic Acid. Inter. J. Nat. Appl. Sc., 4(3): 292-298  650 C. I. Nwoye, M. C. Menkiti, E. Obidiegwu and N. E. Nwankwo Vol.10, No.7 [6] Nwoye, C. I. (2008) Model for predicting the Time of Dissolution of Pre-quantified Concentration of Phosphorus during Leaching of Iron Oxide Ore in Oxalic Acid. Inter. J. Nat. Appl. Sc., 4(3):168-174. [7] Nwoye, C. I. (2006) SynchroWell Research Work Report, DFM Unit, No 2561178, 66-83. [8] Nwoye, C. I. and Ndlu, S. (2009) Model for Predictive Analysis of the Concentration of Phosphorus Removed during Leaching of Iron Oxide Ore in Sulphuric Acid Solution JMMCE, 8(4):261-270. [9] Anyakwo, C. N., and Obot, O.W. (2008) Phosphorus Removal from Nigeria`s Agbaja Iron Ore by Aspergillus niger, IREJEST 5(1), 54-58 [10] Nwoye, C. I. (2009) Model for Predicting the Concentration of Phosphorus Removed during Leaching of Iron Oxide Ore in Oxalic Acid Solution. J. Eng. & Appl. Sc. (in press). [11] Odesina, I. A. (2003) Essential Chemistry, 1 st Edition, Lagos, pp 169-186. [12] Nwobodo, C. C. (2009) Leaching of Iron from Its Ore Using Potassium Hydroxide. B. Eng. Project. Federal University of Technology, Owerri. Nigeria. [13] Nwoye, C. I. (2008) C-NIKBRAN; Data Analytical Memory. |