Paper Menu >>
Journal Menu >>
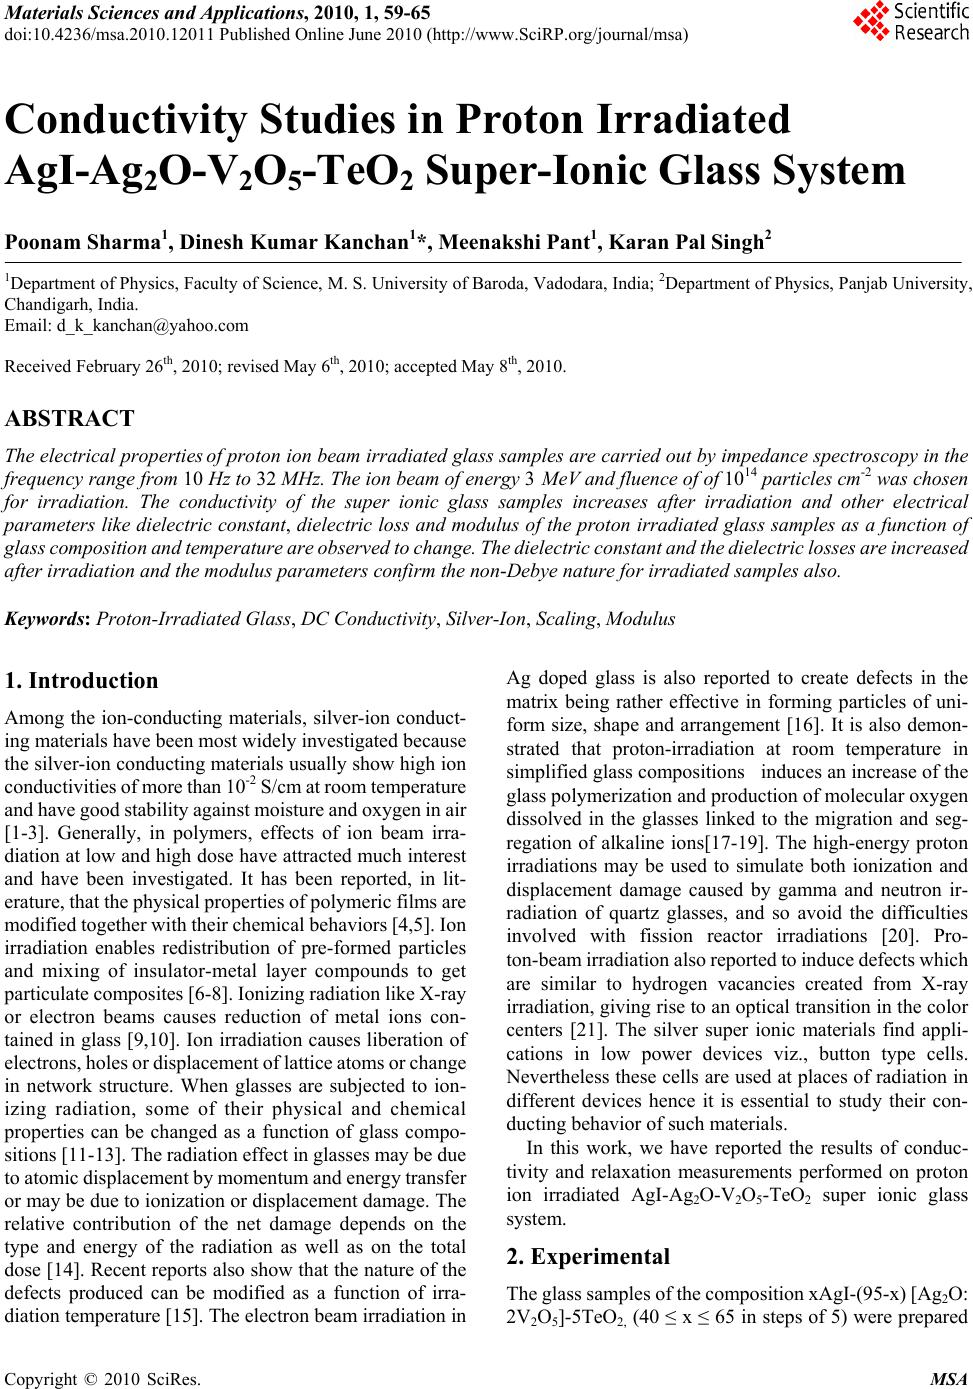 Materials Sciences and Applicatio ns, 2010, 1, 59-65 doi:10.4236/msa.2010.12011 Published Online June 2010 (http://www.SciRP.org/journal/msa) Copyright © 2010 SciRes. MSA Conductivity Studies in Proton Irradiated AgI-Ag2O-V2O5-TeO2 Super-Ionic Glass System Poonam Sharma1, Dinesh Kumar Kanchan1*, Meenakshi Pant1, Karan Pal Singh2 1Department of Physics, Faculty of Science, M. S. University of Baroda, Vadodara, India; 2Department of Physics, Panjab University, Chandigarh, India. Email: d_k_kanchan@yahoo.com Received February 26th, 2010; revised May 6th, 2010; accepted May 8th, 2010. ABSTRACT The electrical properties of proton ion beam irradiated glass samples are carried out by impedance spectroscopy in the frequency range from 10 Hz to 32 MHz. The ion beam of energy 3 MeV and fluence of of 1014 particles cm-2 was chosen for irradiation. The conductivity of the super ionic glass samples increases after irradiation and other electrical parameters like dielectric constant, dielectric loss and modulus of the proton irradiated glass samples as a function of glass composition and temperature are observed to change. The dielectric constant and the dielectric losses are increased after irradiation and the modulus parameters confirm the non-Debye nature for irradiated samples also. Keywords: Proton-Irradiated Glass, DC Conductivity, Silver-Ion, Scaling, Modulus 1. Introduction Among the ion-conducting materials, silver-ion conduct- ing materials have been most widely investigated because the silver-ion conducting materials usually show high ion conductivities of more than 10-2 S/cm at room temperature and have good stability against moisture and oxygen in air [1-3]. Generally, in polymers, effects of ion beam irra- diation at low and high dose have attracted much interest and have been investigated. It has been reported, in lit- erature, that the physical properties of polymeric films are modified together with their chemical behaviors [4,5]. Ion irradiation enables redistribution of pre-formed particles and mixing of insulator-metal layer compounds to get particulate composites [6-8]. Ionizing radiation like X-ray or electron beams causes reduction of metal ions con- tained in glass [9,10]. Ion irradiation causes liberation of electrons, holes or displacement of lattice atoms or change in network structure. When glasses are subjected to ion- izing radiation, some of their physical and chemical properties can be changed as a function of glass compo- sitions [11-13]. The radiation effect in glasses may be due to atomic displacement by momentum and energy transfer or may be due to ionization or displacement damage. The relative contribution of the net damage depends on the type and energy of the radiation as well as on the total dose [14]. Recent reports also show that the nature of the defects produced can be modified as a function of irra- diation temperature [15]. The electron beam irradiation in Ag doped glass is also reported to create defects in the matrix being rather effective in forming particles of uni- form size, shape and arrangement [16]. It is also demon- strated that proton-irradiation at room temperature in simplified glass compositions induces an increase of the glass polymerization and production of molecular oxygen dissolved in the glasses linked to the migration and seg- regation of alkaline ions[17-19]. The high-energy proton irradiations may be used to simulate both ionization and displacement damage caused by gamma and neutron ir- radiation of quartz glasses, and so avoid the difficulties involved with fission reactor irradiations [20]. Pro- ton-beam irradiation also reported to induce defects which are similar to hydrogen vacancies created from X-ray irradiation, giving rise to an optical transition in the color centers [21]. The silver super ionic materials find appli- cations in low power devices viz., button type cells. Nevertheless these cells are used at places of radiation in different devices hence it is essential to study their con- ducting behavior of such materials. In this work, we have reported the results of conduc- tivity and relaxation measurements performed on proton ion irradiated AgI-Ag2O-V2O5-TeO2 super ionic glass system. 2. Experimental The glass samples of the composition xAgI-(95-x) [Ag2O: 2V2O5]-5TeO2, (40 ≤ x ≤ 65 in steps of 5) were prepared 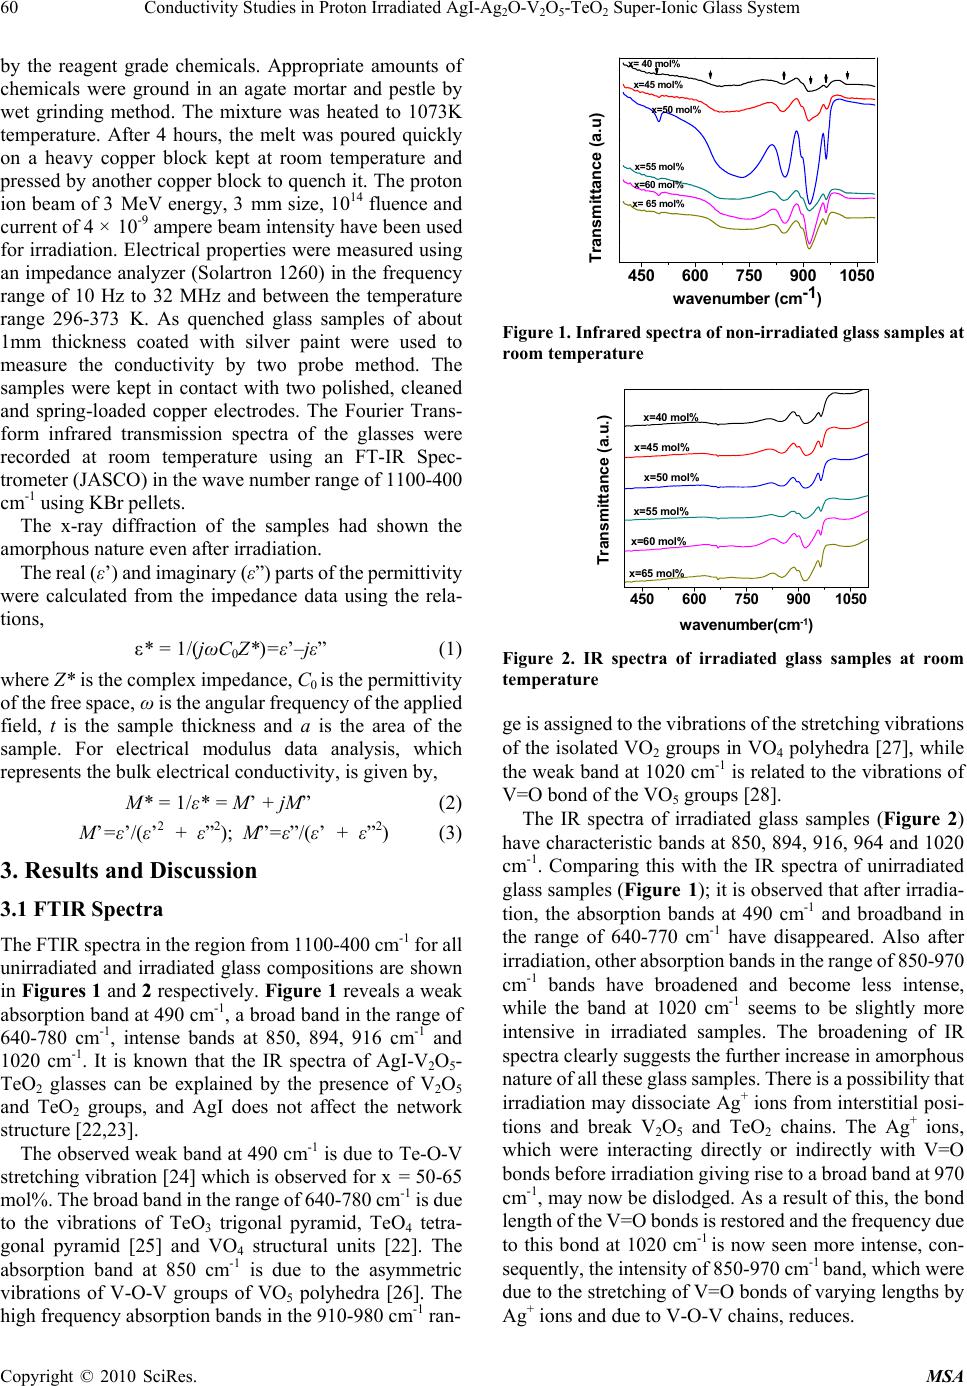 60 Conductivity Studies in Proton Irradiated AgI-AgO-V O-TeO Super-Ionic Glass System 22 52 by the reagent grade chemicals. Appropriate amounts of chemicals were ground in an agate mortar and pestle by wet grinding method. The mixture was heated to 1073K temperature. After 4 hours, the melt was poured quickly on a heavy copper block kept at room temperature and pressed by another copper block to quench it. The proton ion beam of 3 MeV energy, 3 mm size, 1014 fluence and current of 4 × 10⁻⁹ ampere beam intensity have been used for irradiation. Electrical properties were measured using an impedance analyzer (Solartron 1260) in the frequency range of 10 Hz to 32 MHz and between the temperature range 296-373 K. As quenched glass samples of about 1mm thickness coated with silver paint were used to measure the conductivity by two probe method. The samples were kept in contact with two polished, cleaned and spring-loaded copper electrodes. The Fourier Trans- form infrared transmission spectra of the glasses were recorded at room temperature using an FT-IR Spec- trometer (JASCO) in the wave number range of 1100-400 cm-1 using KBr pellets. The x-ray diffraction of the samples had shown the amorphous nature even after irradiation. The real (ε’) and imaginary (ε”) parts of the permittivity were calculated from the impedance data using the rela- tions, ε* = 1/(jωC0Z*)=ε’–jε” (1) where Z* is the complex impedance, C0 is the permittivity of the free space, ω is the angular frequency of the applied field, t is the sample thickness and a is the area of the sample. For electrical modulus data analysis, which represents the bulk electrical conductivity, is given by, M* = 1/ε* = M’ + jM” (2) M’=ε’/(ε’2 + ε”2); M”=ε”/(ε’ + ε”2) (3) 3. Results and Discussion 3.1 FTIR Spectra The FTIR spectra in the region from 1100-400 cm-1 for all unirradiated and irradiated glass compositions are shown in Figures 1 and 2 respectively. Figure 1 reveals a weak absorption band at 490 cm-1, a broad band in the range of 640-780 cm-1, intense bands at 850, 894, 916 cm-1 and 1020 cm-1. It is known that the IR spectra of AgI-V2O5- TeO2 glasses can be explained by the presence of V2O5 and TeO2 groups, and AgI does not affect the network structure [22,23]. The observed weak band at 490 cm-1 is due to Te-O-V stretching vibration [24] which is observed for x = 50-65 mol%. The broad band in the range of 640-780 cm-1 is due to the vibrations of TeO3 trigonal pyramid, TeO4 tetra- gonal pyramid [25] and VO4 structural units [22]. The absorption band at 850 cm-1 is due to the asymmetric vibrations of V-O-V groups of VO5 polyhedra [26]. The high frequency absorption bands in the 910-980 cm-1 ran- 450 600 750 9001050 wavenum ber (cm-1) x= 40 mol% x=45 mol% x=50 mol% x=55 mol% x=60 mol% x= 65 mol% Transmitta nce (a.u) Figure 1. Infrared spectra of non-irradiated glass samples at room temperature 450 600 750 9001050 x=65 mol% x=60 mol% x=55 mol% x=50 mol% x=45 mol% Transmittance (a.u.) wavenumber(cm-1) x=40 mol% Figure 2. IR spectra of irradiated glass samples at room temperature ge is assigned to the vibrations of the stretching vibrations of the isolated VO2 groups in VO4 polyhedra [27], while the weak band at 1020 cm-1 is related to the vibrations of V=O bond of the VO5 groups [28]. The IR spectra of irradiated glass samples (Figure 2) have characteristic bands at 850, 894, 916, 964 and 1020 cm-1. Comparing this with the IR spectra of unirradiated glass samples (Figure 1); it is observed that after irradia- tion, the absorption bands at 490 cm-1 and broadband in the range of 640-770 cm-1 have disappeared. Also after irradiation, other absorption bands in the range of 850-970 cm-1 bands have broadened and become less intense, while the band at 1020 cm-1 seems to be slightly more intensive in irradiated samples. The broadening of IR spectra clearly suggests the further increase in amorphous nature of all these glass samples. There is a possibility that irradiation may dissociate Ag+ ions from interstitial posi- tions and break V2O5 and TeO2 chains. The Ag+ ions, which were interacting directly or indirectly with V=O bonds before irradiation giving rise to a broad band at 970 cm-1, may now be dislodged. As a result of this, the bond length of the V=O bonds is restored and the frequency due to this bond at 1020 cm-1 is now seen more intense, con- sequently, the intensity of 850-970 cm-1 band, which were due to the stretching of V=O bonds of varying lengths by Ag+ ions and due to V-O-V chains, reduces. Copyright © 2010 SciRes. MSA 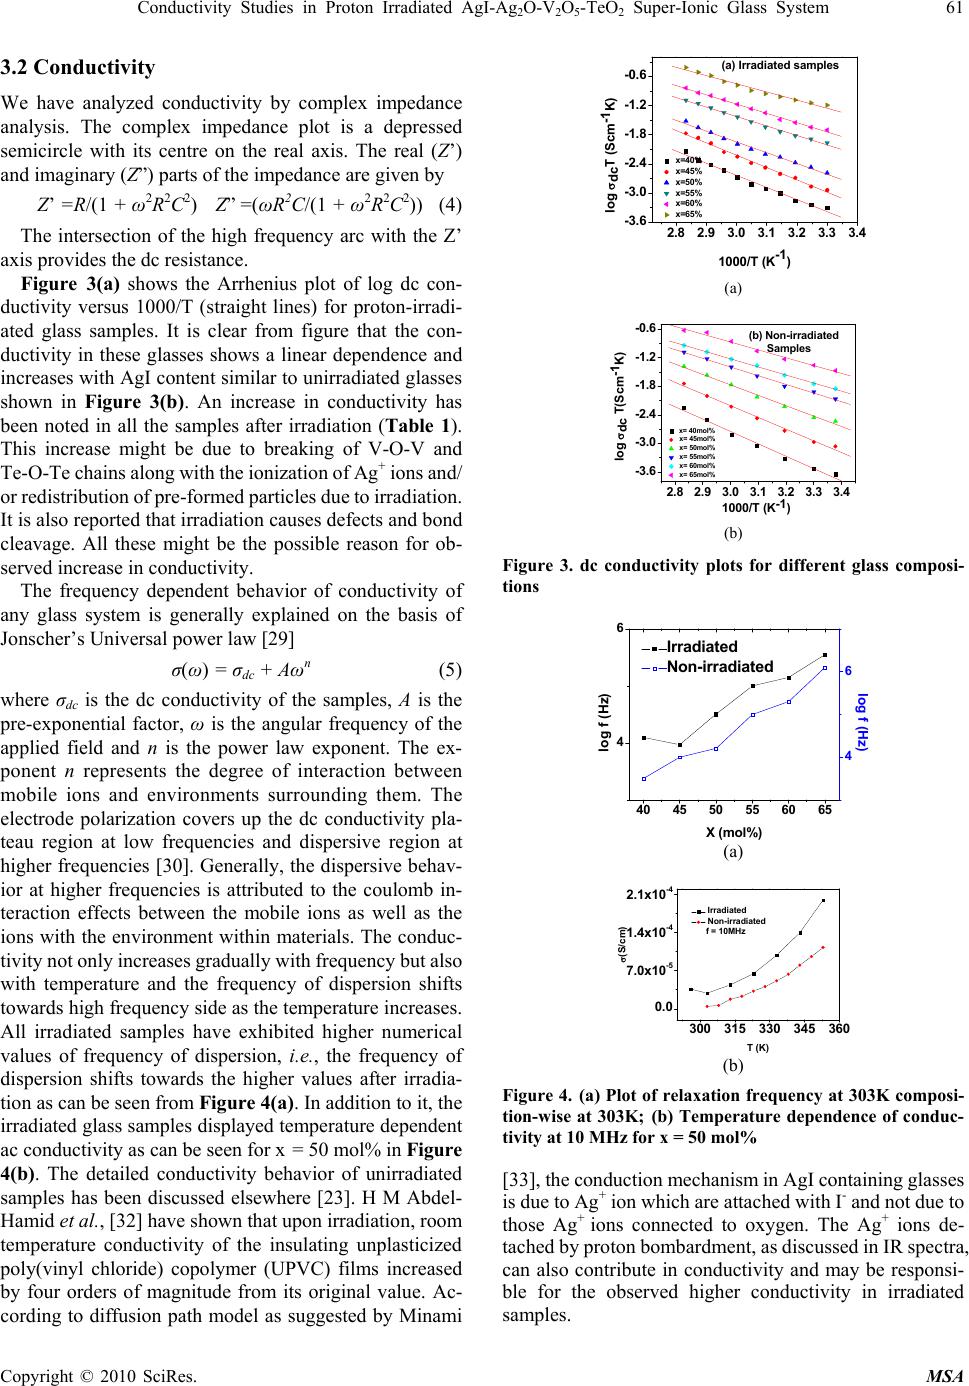 Conductivity Studies in Proton Irradiated AgI-AgO-V O-TeO Super-Ionic Glass System 61 22 52 3.2 Conductivity We have analyzed conductivity by complex impedance analysis. The complex impedance plot is a depressed semicircle with its centre on the real axis. The real (Z’) and imaginary (Z”) parts of the impedance are given by Z’ =R/(1 + ω2R2C2) Z” =(ωR2C/(1 + ω2R2C2)) (4) The intersection of the high frequency arc with the Z’ axis provides the dc resistance. Figure 3(a) shows the Arrhenius plot of log dc con- ductivity versus 1000/T (straight lines) for proton-irradi- ated glass samples. It is clear from figure that the con- ductivity in these glasses shows a linear dependence and increases with AgI content similar to unirradiated glasses shown in Figure 3(b). An increase in conductivity has been noted in all the samples after irradiation (Table 1). This increase might be due to breaking of V-O-V and Te-O-Te chains along with the ionization of Ag+ ions and/ or redistribution of pre-formed particles due to irradiation. It is also reported that irradiation causes defects and bond cleavage. All these might be the possible reason for ob- served increase in conductivity. The frequency dependent behavior of conductivity of any glass system is generally explained on the basis of Jonscher’s Universal power law [29] σ(ω) = σdc + Aωn (5) where σdc is the dc conductivity of the samples, A is the pre-exponential factor, ω is the angular frequency of the applied field and n is the power law exponent. The ex- ponent n represents the degree of interaction between mobile ions and environments surrounding them. The electrode polarization covers up the dc conductivity pla- teau region at low frequencies and dispersive region at higher frequencies [30]. Generally, the dispersive behav- ior at higher frequencies is attributed to the coulomb in- teraction effects between the mobile ions as well as the ions with the environment within materials. The conduc- tivity not only increases gradually with frequency but also with temperature and the frequency of dispersion shifts towards high frequency side as the temperature increases. All irradiated samples have exhibited higher numerical values of frequency of dispersion, i.e., the frequency of dispersion shifts towards the higher values after irradia- tion as can be seen from Figure 4(a). In addition to it, the irradiated glass samples displayed temperature dependent ac conductivity as can be seen for x = 50 mol% in Figure 4(b). The detailed conductivity behavior of unirradiated samples has been discussed elsewhere [23]. H M Abdel- Hamid et al., [32] have shown that upon irradiation, room temperature conductivity of the insulating unplasticized poly(vinyl chloride) copolymer (UPVC) films increased by four orders of magnitude from its original value. Ac- cording to diffusion path model as suggested by Minami 2.82.93.03.13.23.33.4 -3.6 -3.0 -2.4 -1.8 -1.2 -0.6 x=40% x=45% x=50% x=55% x=60% x=65% log dcT (Scm-1K) 1000/T (K-1) (a) Irradiated samples (a) 2.8 2.9 3.0 3.1 3.2 3.3 3.4 -3.6 -3.0 -2.4 -1.8 -1.2 -0.6 x= 40mol% x= 45mol% x= 50mol% x= 55mol% x= 60mol% x= 65mol% log dc T(Scm-1K) 1000/T (K-1) (b) Non-irradiated Samples (b) Figure 3. dc conductivity plots for different glass composi- tions 40 45 50 55 60 65 4 6Irradiated Non-i rr a di a t ed X (mol% ) log f (Hz) 4 6 log f (Hz) (a) 300 315 330 345 360 0.0 7.0x10⁻⁵ 1.4x10⁻⁴ 2.1x10⁻⁴ Irradiated Non-irradiated f = 10M Hz (S/cm) T (K) (b) Figure 4. (a) Plot of relaxation frequency at 303K composi- tion-wise at 303K; (b) Temperature dependence of conduc- tivity at 10 MHz for x = 50 mol% [33], the conduction mechanism in AgI containing glasses is due to Ag+ ion which are attached with I- and not due to those Ag+ ions connected to oxygen. The Ag+ ions de- tached by proton bombardment, as discussed in IR spectra, can also contribute in conductivity and may be responsi- ble for the observed higher conductivity in irradiated samples. Copyright © 2010 SciRes. MSA 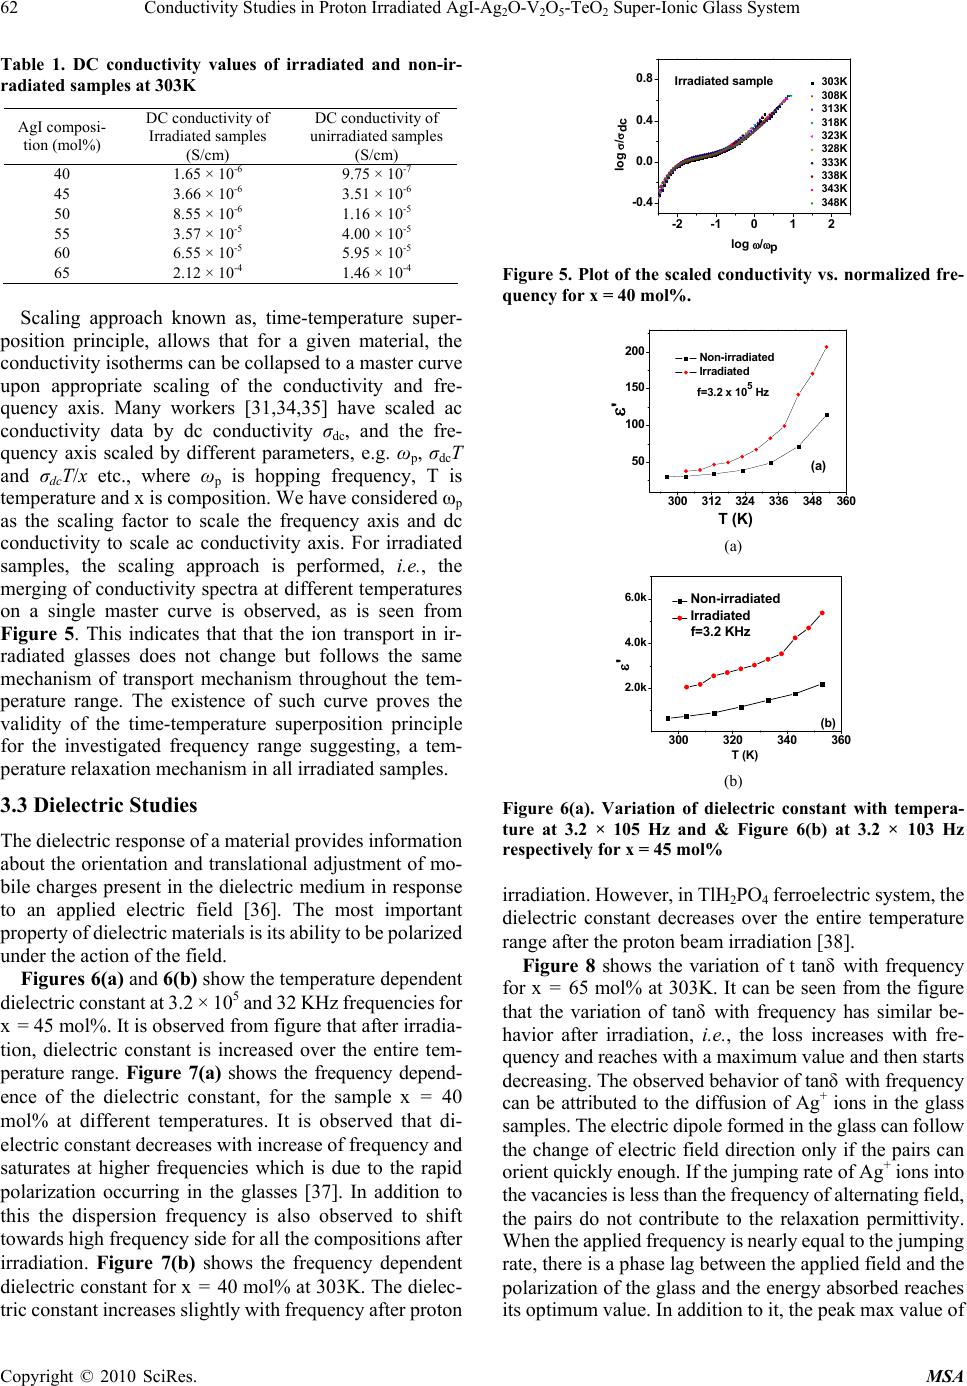 62 Conductivity Studies in Proton Irradiated AgI-AgO-V O-TeO Super-Ionic Glass System 22 52 Table 1. DC conductivity values of irradiated and non-ir- radiated samples at 303K AgI composi- tion (mol%) DC conductivity of Irradiated samples (S/cm) DC conductivity of unirradiated samples (S/cm) 40 1.65 × 10⁻⁶ 9.75 × 10⁻⁷ 45 3.66 × 10⁻⁶ 3.51 × 10⁻⁶ 50 8.55 × 10⁻⁶ 1.16 × 10⁻⁵ 55 3.57 × 10⁻⁵ 4.00 × 10⁻⁵ 60 6.55 × 10⁻⁵ 5.95 × 10⁻⁵ 65 2.12 × 10⁻⁴ 1.46 × 10⁻⁴ Scaling approach known as, time-temperature super- position principle, allows that for a given material, the conductivity isotherms can be collapsed to a master curve upon appropriate scaling of the conductivity and fre- quency axis. Many workers [31,34,35] have scaled ac conductivity data by dc conductivity σdc, and the fre- quency axis scaled by different parameters, e.g. ωp, σdcT and σdcT/x etc., where ωp is hopping frequency, T is temperature and x is composition. We have considered ωp as the scaling factor to scale the frequency axis and dc conductivity to scale ac conductivity axis. For irradiated samples, the scaling approach is performed, i.e., the merging of conductivity spectra at different temperatures on a single master curve is observed, as is seen from Figure 5. This indicates that that the ion transport in ir- radiated glasses does not change but follows the same mechanism of transport mechanism throughout the tem- perature range. The existence of such curve proves the validity of the time-temperature superposition principle for the investigated frequency range suggesting, a tem- perature relaxation mechanism in all irradiated samples. 3.3 Dielectric Studies The dielectric response of a material provides information about the orientation and translational adjustment of mo- bile charges present in the dielectric medium in response to an applied electric field [36]. The most important property of dielectric materials is its ability to be polarized under the action of the field. Figures 6(a) and 6(b) show the temperature dependent dielectric constant at 3.2 × 10⁵ and 32 KHz frequencies for x = 45 mol%. It is observed from figure that after irradia- tion, dielectric constant is increased over the entire tem- perature range. Figure 7(a) shows the frequency depend- ence of the dielectric constant, for the sample x = 40 mol% at different temperatures. It is observed that di- electric constant decreases with increase of frequency and saturates at higher frequencies which is due to the rapid polarization occurring in the glasses [37]. In addition to this the dispersion frequency is also observed to shift towards high frequency side for all the compositions after irradiation. Figure 7(b) shows the frequency dependent dielectric constant for x = 40 mol% at 303K. The dielec- tric constant increases slightly with frequency after proton -2 -1012 -0.4 0.0 0.4 0.8 303K 308K 313K 318K 323K 328K 333K 338K 343K 348K log /dc log /p Irradiated sample Figure 5. Plot of the scaled conductivity vs. normalized fre- quency for x = 40 mol%. 300 312 324 336 348 360 50 100 150 200 Non-irradiated Irradiated f=3.2 x 10⁵ Hz ' T (K) (a) (a) 300 320 340 360 2.0k 4.0k 6.0k Non-irradiated Irradiated f=3.2 KHz ' T (K) (b) (b) Figure 6(a). Variation of dielectric constant with tempera- ture at 3.2 × 10⁵ Hz and & Figure 6(b) at 3.2 × 10³ Hz respectively for x = 45 mol% irradiation. However, in TlH2PO4 ferroelectric system, the dielectric constant decreases over the entire temperature range after the proton beam irradiation [38]. Figure 8 shows the variation of t tanδ with frequency for x = 65 mol% at 303K. It can be seen from the figure that the variation of tanδ with frequency has similar be- havior after irradiation, i.e., the loss increases with fre- quency and reaches with a maximum value and then starts decreasing. The observed behavior of tanδ with frequency can be attributed to the diffusion of Ag+ ions in the glass samples. The electric dipole formed in the glass can follow the change of electric field direction only if the pairs can orient quickly enough. If the jumping rate of Ag+ ions into the vacancies is less than the frequency of alternating field, the pairs do not contribute to the relaxation permittivity. When the applied frequency is nearly equal to the jumping rate, there is a phase lag between the applied field and the polarization of the glass and the energy absorbed reaches its optimum value. In addition to it, the peak max value of Copyright © 2010 SciRes. MSA 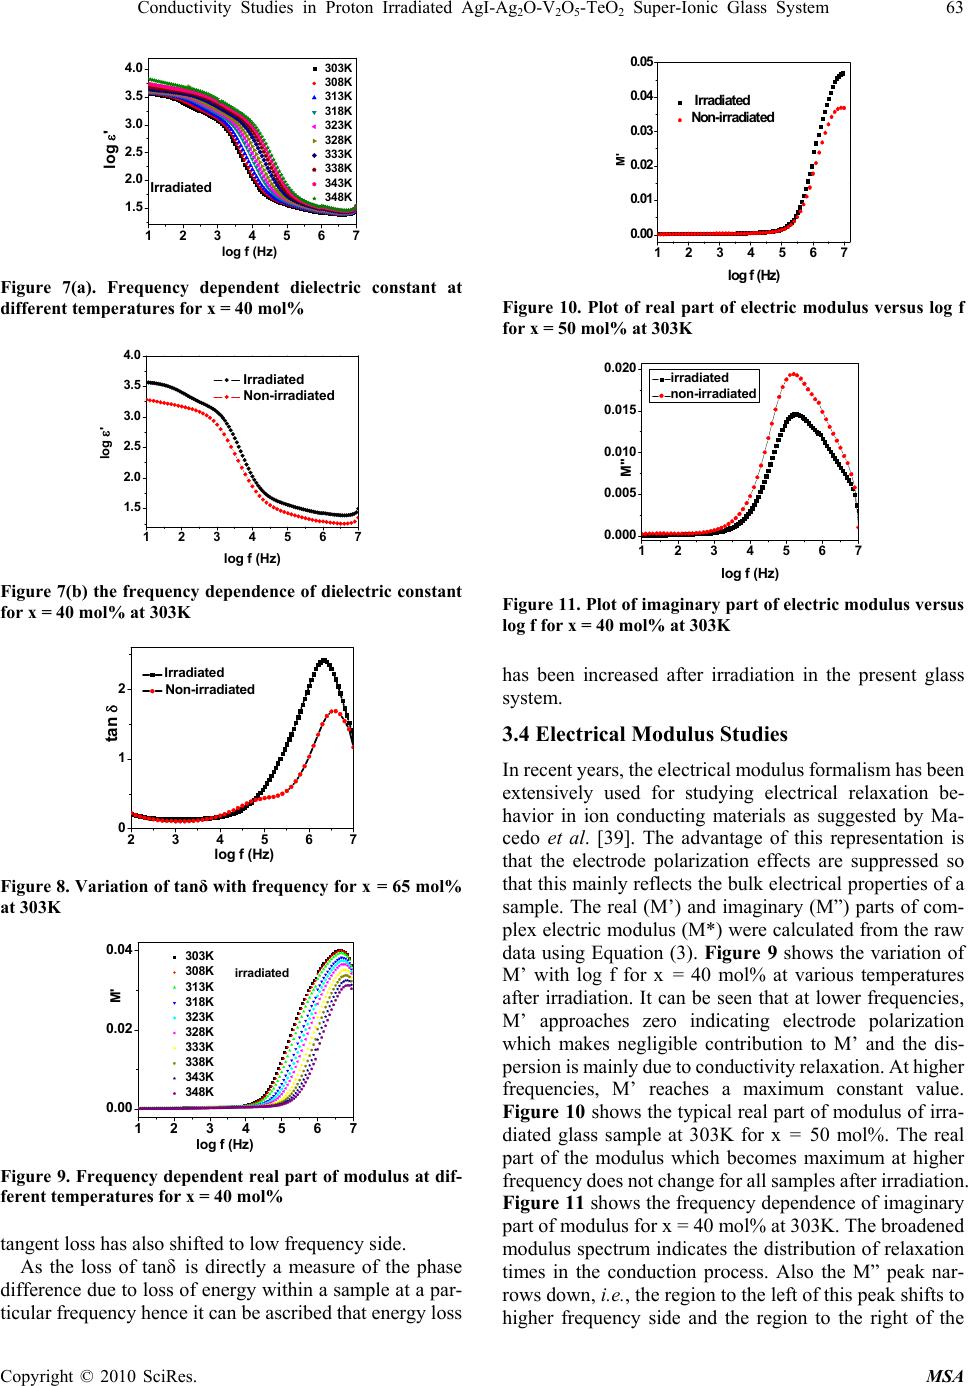 Conductivity Studies in Proton Irradiated AgI-AgO-V O-TeO Super-Ionic Glass System 63 22 52 1234567 1.5 2.0 2.5 3.0 3.5 4.0 303K 308K 313K 318K 323K 328K 333K 338K 343K 348K log ' log f (Hz) Irradiated Figure 7(a). Frequency dependent dielectric constant at different temperatures for x = 40 mol% 1234567 1.5 2.0 2.5 3.0 3.5 4.0 log ' log f (Hz) Irradiated Non-irradiated Figure 7(b) the frequency dependence of dielectric constant for x = 40 mol% at 303K 23456 0 1 2 7 tan log f (H z ) Irradiated Non-irradiated Figure 8. Variation of tanδ with frequency for x = 65 mol% at 303K 1234567 0.00 0.02 0.04 303K 308K 313K 318K 323K 328K 333K 338K 343K 348K M' log f (Hz) irradiated Figure 9. Frequency dependent real part of modulus at dif- ferent temperatures for x = 40 mol% tangent loss has also shifted to low frequency side. As the loss of tanδ is directly a measure of the phase difference due to loss of energy within a sample at a par- ticular frequency hence it can be ascribed that energy loss 1234567 0. 00 0. 01 0. 02 0. 03 0. 04 0. 0 5 Irradiated Non-irradiated M' lo g f (H z) Figure 10. Plot of real part of electric modulus versus log f for x = 50 mol% at 303K 1234567 0.000 0.005 0.010 0.015 0.020 irradiated non-irradiated M" log f (H z) Figure 11. Plot of imaginary part of electric modulus versus log f for x = 40 mol% at 303K has been increased after irradiation in the present glass system. 3.4 Electrical Modulus Studies In recent years, the electrical modulus formalism has been extensively used for studying electrical relaxation be- havior in ion conducting materials as suggested by Ma- cedo et al. [39]. The advantage of this representation is that the electrode polarization effects are suppressed so that this mainly reflects the bulk electrical properties of a sample. The real (M’) and imaginary (M”) parts of com- plex electric modulus (M*) were calculated from the raw data using Equation (3). Figure 9 shows the variation of M’ with log f for x = 40 mol% at various temperatures after irradiation. It can be seen that at lower frequencies, M’ approaches zero indicating electrode polarization which makes negligible contribution to M’ and the dis- persion is mainly due to conductivity relaxation. At higher frequencies, M’ reaches a maximum constant value. Figure 10 shows the typical real part of modulus of irra- diated glass sample at 303K for x = 50 mol%. The real part of the modulus which becomes maximum at higher frequency does not change for all samples after irradiation. Figure 11 shows the frequency dependence of imaginary part of modulus for x = 40 mol% at 303K. The broadened modulus spectrum indicates the distribution of relaxation times in the conduction process. Also the M” peak nar- rows down, i.e., the region to the left of this peak shifts to higher frequency side and the region to the right of the Copyright © 2010 SciRes. MSA 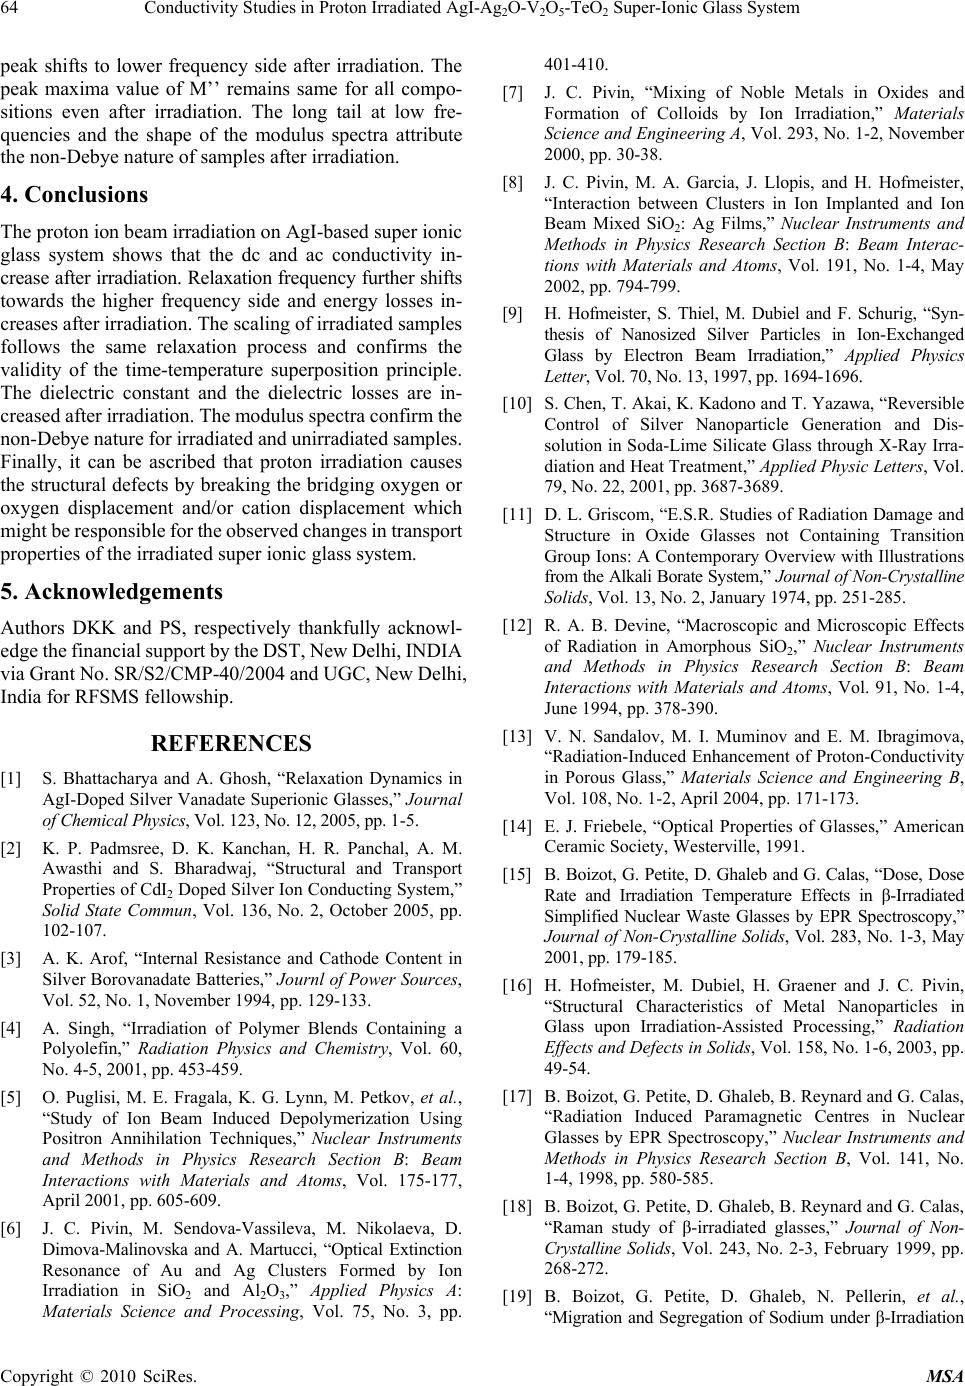 64 Conductivity Studies in Proton Irradiated AgI-AgO-V O-TeO Super-Ionic Glass System 22 52 peak shifts to lower frequency side after irradiation. The peak maxima value of M’’ remains same for all compo- sitions even after irradiation. The long tail at low fre- quencies and the shape of the modulus spectra attribute the non-Debye nature of samples after irradiation. 4. Conclusions The proton ion beam irradiation on AgI-based super ionic glass system shows that the dc and ac conductivity in- crease after irradiation. Relaxation frequency further shifts towards the higher frequency side and energy losses in- creases after irradiation. The scaling of irradiated samples follows the same relaxation process and confirms the validity of the time-temperature superposition principle. The dielectric constant and the dielectric losses are in- creased after irradiation. The modulus spectra confirm the non-Debye nature for irradiated and unirradiated samples. Finally, it can be ascribed that proton irradiation causes the structural defects by breaking the bridging oxygen or oxygen displacement and/or cation displacement which might be responsible for the observed changes in transport properties of the irradiated super ionic glass system. 5. Acknowledgements Authors DKK and PS, respectively thankfully acknowl- edge the financial support by the DST, New Delhi, INDIA via Grant No. SR/S2/CMP-40/2004 and UGC, New Delhi, India for RFSMS fellowship. REFERENCES [1] S. Bhattacharya and A. Ghosh, “Relaxation Dynamics in AgI-Doped Silver Vanadate Superionic Glasses,” Journal of Chemical Physics, Vol. 123, No. 12, 2005, pp. 1-5. [2] K. P. Padmsree, D. K. Kanchan, H. R. Panchal, A. M. Awasthi and S. Bharadwaj, “Structural and Transport Properties of CdI2 Doped Silver Ion Conducting System,” Solid State Commun, Vol. 136, No. 2, October 2005, pp. 102-107. [3] A. K. Arof, “Internal Resistance and Cathode Content in Silver Borovanadate Batteries,” Journl of Power Sources, Vol. 52, No. 1, November 1994, pp. 129-133. [4] A. Singh, “Irradiation of Polymer Blends Containing a Polyolefin,” Radiation Physics and Chemistry, Vol. 60, No. 4-5, 2001, pp. 453-459. [5] O. Puglisi, M. E. Fragala, K. G. Lynn, M. Petkov, et al., “Study of Ion Beam Induced Depolymerization Using Positron Annihilation Techniques,” Nuclear Instruments and Methods in Physics Research Section B: Beam Interactions with Materials and Atoms, Vol. 175-177, April 2001, pp. 605-609. [6] J. C. Pivin, M. Sendova-Vassileva, M. Nikolaeva, D. Dimova-Malinovska and A. Martucci, “Optical Extinction Resonance of Au and Ag Clusters Formed by Ion Irradiation in SiO2 and Al2O3,” Applied Physics A: Materials Science and Processing, Vol. 75, No. 3, pp. 401-410. [7] J. C. Pivin, “Mixing of Noble Metals in Oxides and Formation of Colloids by Ion Irradiation,” Materials Science and Engineering A, Vol. 293, No. 1-2, November 2000, pp. 30-38. [8] J. C. Pivin, M. A. Garcia, J. Llopis, and H. Hofmeister, “Interaction between Clusters in Ion Implanted and Ion Beam Mixed SiO2: Ag Films,” Nuclear Instruments and Methods in Physics Research Section B: Beam Interac- tions with Materials and Atoms, Vol. 191, No. 1-4, May 2002, pp. 794-799. [9] H. Hofmeister, S. Thiel, M. Dubiel and F. Schurig, “Syn- thesis of Nanosized Silver Particles in Ion-Exchanged Glass by Electron Beam Irradiation,” Applied Physics Letter, Vol. 70, No. 13, 1997, pp. 1694-1696. [10] S. Chen, T. Akai, K. Kadono and T. Yazawa, “Reversible Control of Silver Nanoparticle Generation and Dis- solution in Soda-Lime Silicate Glass through X-Ray Irra- diation and Heat Treatment,” Applied Physic Letters, Vol. 79, No. 22, 2001, pp. 3687-3689. [11] D. L. Griscom, “E.S.R. Studies of Radiation Damage and Structure in Oxide Glasses not Containing Transition Group Ions: A Contemporary Overview with Illustrations from the Alkali Borate System,” Journal of Non-Crystalline Solids, Vol. 13, No. 2, January 1974, pp. 251-285. [12] R. A. B. Devine, “Macroscopic and Microscopic Effects of Radiation in Amorphous SiO2,” Nuclear Instruments and Methods in Physics Research Section B: Beam Interactions with Materials and Atoms, Vol. 91, No. 1-4, June 1994, pp. 378-390. [13] V. N. Sandalov, M. I. Muminov and E. M. Ibragimova, “Radiation-Induced Enhancement of Proton-Conductivity in Porous Glass,” Materials Science and Engineering B, Vol. 108, No. 1-2, April 2004, pp. 171-173. [14] E. J. Friebele, “Optical Properties of Glasses,” American Ceramic Society, Westerville, 1991. [15] B. Boizot, G. Petite, D. Ghaleb and G. Calas, “Dose, Dose Rate and Irradiation Temperature Effects in β-Irradiated Simplified Nuclear Waste Glasses by EPR Spectroscopy,” Journal of Non-Crystalline Solids, Vol. 283, No. 1-3, May 2001, pp. 179-185. [16] H. Hofmeister, M. Dubiel, H. Graener and J. C. Pivin, “Structural Characteristics of Metal Nanoparticles in Glass upon Irradiation-Assisted Processing,” Radiation Effects and Defects in Solids, Vol. 158, No. 1-6, 2003, pp. 49-54. [17] B. Boizot, G. Petite, D. Ghaleb, B. Reynard and G. Calas, “Radiation Induced Paramagnetic Centres in Nuclear Glasses by EPR Spectroscopy,” Nuclear Instruments and Methods in Physics Research Section B, Vol. 141, No. 1-4, 1998, pp. 580-585. [18] B. Boizot, G. Petite, D. Ghaleb, B. Reynard and G. Calas, “Raman study of β-irradiated glasses,” Journal of Non- Crystalline Solids, Vol. 243, No. 2-3, February 1999, pp. 268-272. [19] B. Boizot, G. Petite, D. Ghaleb, N. Pellerin, et al., “Migration and Segregation of Sodium under β-Irradiation Copyright © 2010 SciRes. MSA 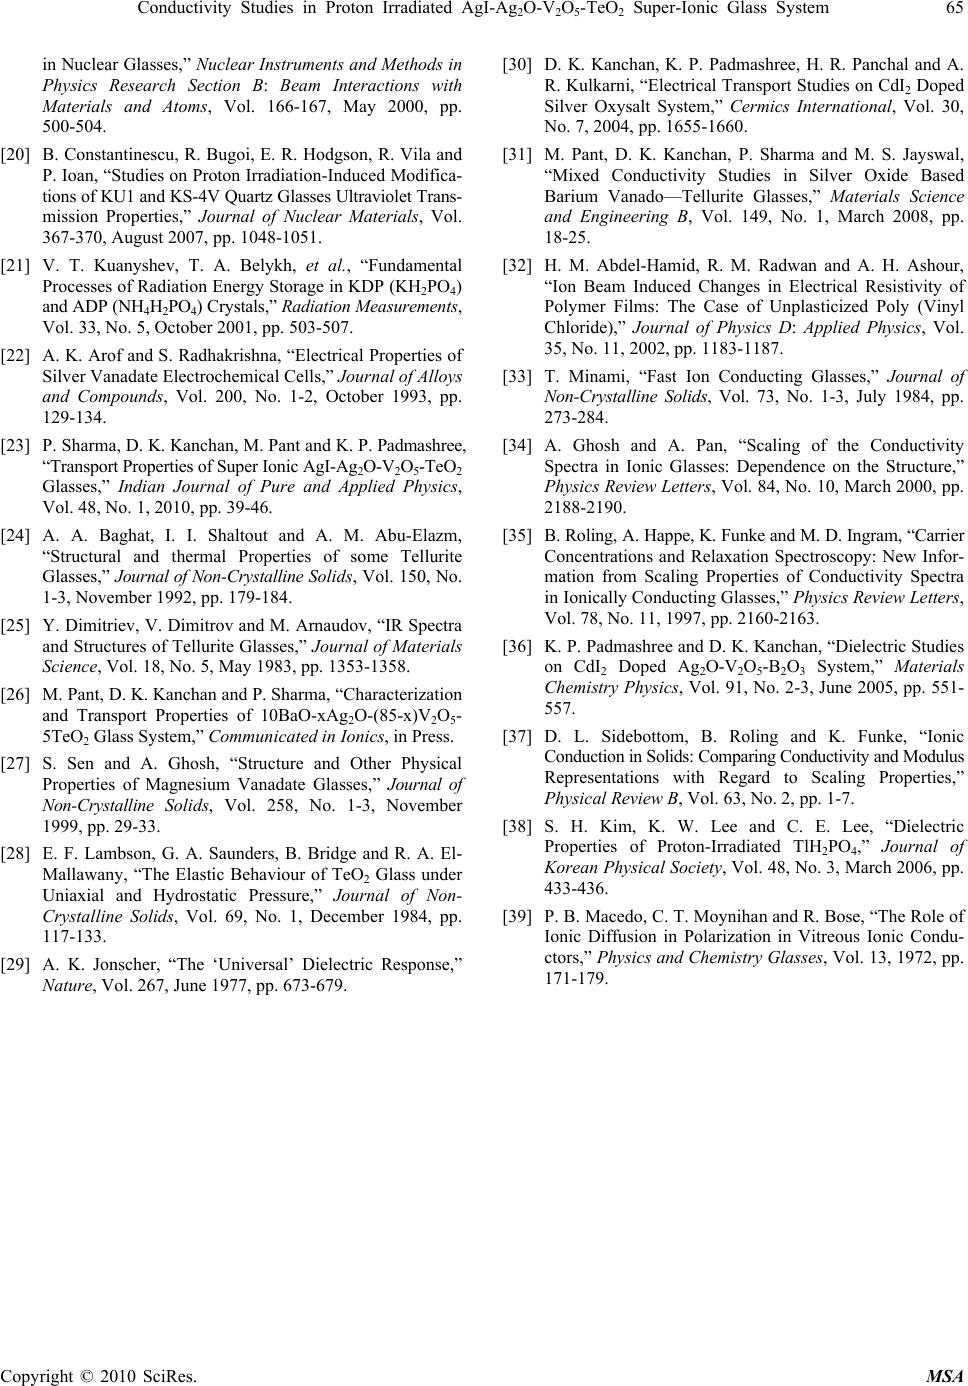 Conductivity Studies in Proton Irradiated AgI-Ag2O-V2O5-TeO2 Super-Ionic Glass System 65 Copyright © 2010 SciRes. MSA in Nuclear Glasses,” Nuclear Instruments and Methods in Physics Research Section B: Beam Interactions with Materials and Atoms, Vol. 166-167, May 2000, pp. 500-504. [20] B. Constantinescu, R. Bugoi, E. R. Hodgson, R. Vila and P. Ioan, “Studies on Proton Irradiation-Induced Modifica- tions of KU1 and KS-4V Quartz Glasses Ultraviolet Trans- mission Properties,” Journal of Nuclear Materials, Vol. 367-370, August 2007, pp. 1048-1051. [21] V. T. Kuanyshev, T. A. Belykh, et al., “Fundamental Processes of Radiation Energy Storage in KDP (KH2PO4) and ADP (NH4H2PO4) Crystals,” Radiation Measurements, Vol. 33, No. 5, October 2001, pp. 503-507. [22] A. K. Arof and S. Radhakrishna, “Electrical Properties of Silver Vanadate Electrochemical Cells,” Journal of Alloys and Compounds, Vol. 200, No. 1-2, October 1993, pp. 129-134. [23] P. Sharma, D. K. Kanchan, M. Pant and K. P. Padmashree, “Transport Properties of Super Ionic AgI-Ag2O-V2O5-TeO2 Glasses,” Indian Journal of Pure and Applied Physics, Vol. 48, No. 1, 2010, pp. 39-46. [24] A. A. Baghat, I. I. Shaltout and A. M. Abu-Elazm, “Structural and thermal Properties of some Tellurite Glasses,” Journal of Non-Crystalline Solids, Vol. 150, No. 1-3, November 1992, pp. 179-184. [25] Y. Dimitriev, V. Dimitrov and M. Arnaudov, “IR Spectra and Structures of Tellurite Glasses,” Journal of Materials Science, Vol. 18, No. 5, May 1983, pp. 1353-1358. [26] M. Pant, D. K. Kanchan and P. Sharma, “Characterization and Transport Properties of 10BaO-xAg2O-(85-x)V2O5- 5TeO2 Glass System,” Communicated in Ionics, in Press. [27] S. Sen and A. Ghosh, “Structure and Other Physical Properties of Magnesium Vanadate Glasses,” Journal of Non-Crystalline Solids, Vol. 258, No. 1-3, November 1999, pp. 29-33. [28] E. F. Lambson, G. A. Saunders, B. Bridge and R. A. El- Mallawany, “The Elastic Behaviour of TeO2 Glass under Uniaxial and Hydrostatic Pressure,” Journal of Non- Crystalline Solids, Vol. 69, No. 1, December 1984, pp. 117-133. [29] A. K. Jonscher, “The ‘Universal’ Dielectric Response,” Nature, Vol. 267, June 1977, pp. 673-679. [30] D. K. Kanchan, K. P. Padmashree, H. R. Panchal and A. R. Kulkarni, “Electrical Transport Studies on CdI2 Doped Silver Oxysalt System,” Cermics International, Vol. 30, No. 7, 2004, pp. 1655-1660. [31] M. Pant, D. K. Kanchan, P. Sharma and M. S. Jayswal, “Mixed Conductivity Studies in Silver Oxide Based Barium Vanado—Tellurite Glasses,” Materials Science and Engineering B, Vol. 149, No. 1, March 2008, pp. 18-25. [32] H. M. Abdel-Hamid, R. M. Radwan and A. H. Ashour, “Ion Beam Induced Changes in Electrical Resistivity of Polymer Films: The Case of Unplasticized Poly (Vinyl Chloride),” Journal of Physics D: Applied Physics, Vol. 35, No. 11, 2002, pp. 1183-1187. [33] T. Minami, “Fast Ion Conducting Glasses,” Journal of Non-Crystalline Solids, Vol. 73, No. 1-3, July 1984, pp. 273-284. [34] A. Ghosh and A. Pan, “Scaling of the Conductivity Spectra in Ionic Glasses: Dependence on the Structure,” Physics Review Letters, Vol. 84, No. 10, March 2000, pp. 2188-2190. [35] B. Roling, A. Happe, K. Funke and M. D. Ingram, “Carrier Concentrations and Relaxation Spectroscopy: New Infor- mation from Scaling Properties of Conductivity Spectra in Ionically Conducting Glasses,” Physics Review Letters, Vol. 78, No. 11, 1997, pp. 2160-2163. [36] K. P. Padmashree and D. K. Kanchan, “Dielectric Studies on CdI2 Doped Ag2O-V2O5-B2O3 System,” Materials Chemistry Physics, Vol. 91, No. 2-3, June 2005, pp. 551- 557. [37] D. L. Sidebottom, B. Roling and K. Funke, “Ionic Conduction in Solids: Comparing Conductivity and Modulus Representations with Regard to Scaling Properties,” Physical Review B, Vol. 63, No. 2, pp. 1-7. [38] S. H. Kim, K. W. Lee and C. E. Lee, “Dielectric Properties of Proton-Irradiated TlH2PO4,” Journal of Korean Physical Society, Vol. 48, No. 3, March 2006, pp. 433-436. [39] P. B. Macedo, C. T. Moynihan and R. Bose, “The Role of Ionic Diffusion in Polarization in Vitreous Ionic Condu- ctors,” Physics and Chemistry Glasses, Vol. 13, 1972, pp. 171-179. |