Paper Menu >>
Journal Menu >>
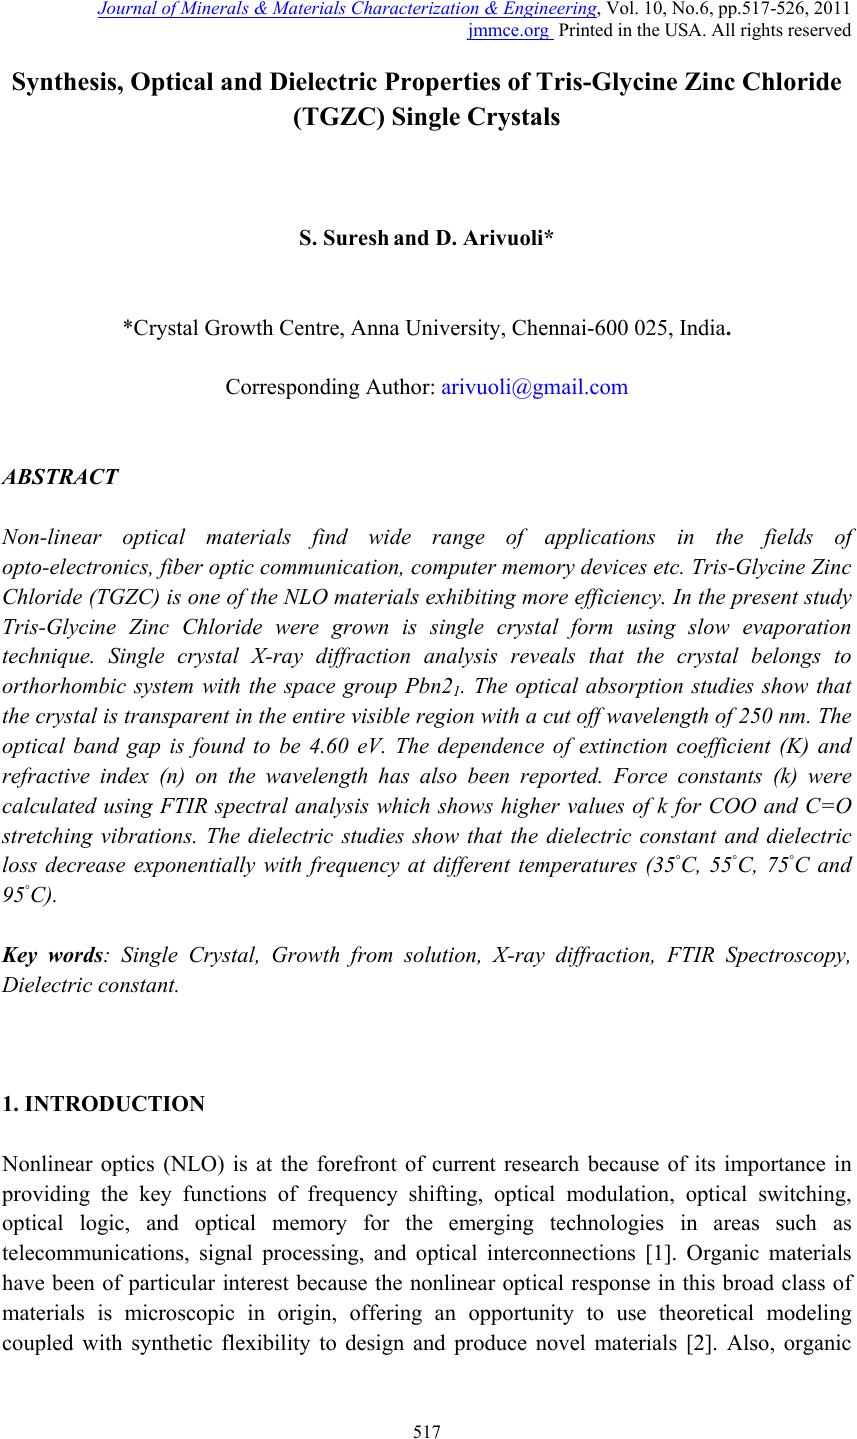 Journal of Minerals & Materials Characterization & Engineering, Vol. 10, No.6, pp.517-526, 2011 jmmce.org Printed in the USA. All rights reserved 517 Synthesis, Optical and Dielectric Properties of Tris-Glycine Zinc Chloride (TGZC) Single Crystals S. Suresh and D. Arivuoli* *Crystal Growth Centre, Anna University, Chennai-600 025, India. Corresponding Author: arivuoli@gmail.com ABSTRACT Non-linear optical materials find wide range of applications in the fields of opto-electronics, fiber optic communication, computer memory devices etc. Tris-Glycine Zinc Chloride (TGZC) is one of the NLO materials exhibiting more efficiency. In the present study Tris-Glycine Zinc Chloride were grown is single crystal form using slow evaporation technique. Single crystal X-ray diffraction analysis reveals that the crystal belongs to orthorhombic system with the space group Pbn21. The optical absorption studies show that the crystal is transparent in the entire visible region with a cut off wavelength of 250 nm. The optical band gap is found to be 4.60 eV. The dependence of extinction coefficient (K) and refractive index (n) on the wavelength has also been reported. Force constants (k) were calculated using FTIR spectral analysis which shows higher values of k for COO and C=O stretching vibrations. The dielectric studies show that the dielectric constant and dielectric loss decrease exponentially with frequency at different temperatures (35◦C, 55◦C, 75◦C and 95◦C). Key words: Single Crystal, Growth from solution, X-ray diffraction, FTIR Spectroscopy, Dielectric constant. 1. INTRODUCTION Nonlinear optics (NLO) is at the forefront of current research because of its importance in providing the key functions of frequency shifting, optical modulation, optical switching, optical logic, and optical memory for the emerging technologies in areas such as telecommunications, signal processing, and optical interconnections [1]. Organic materials have been of particular interest because the nonlinear optical response in this broad class of materials is microscopic in origin, offering an opportunity to use theoretical modeling coupled with synthetic flexibility to design and produce novel materials [2]. Also, organic 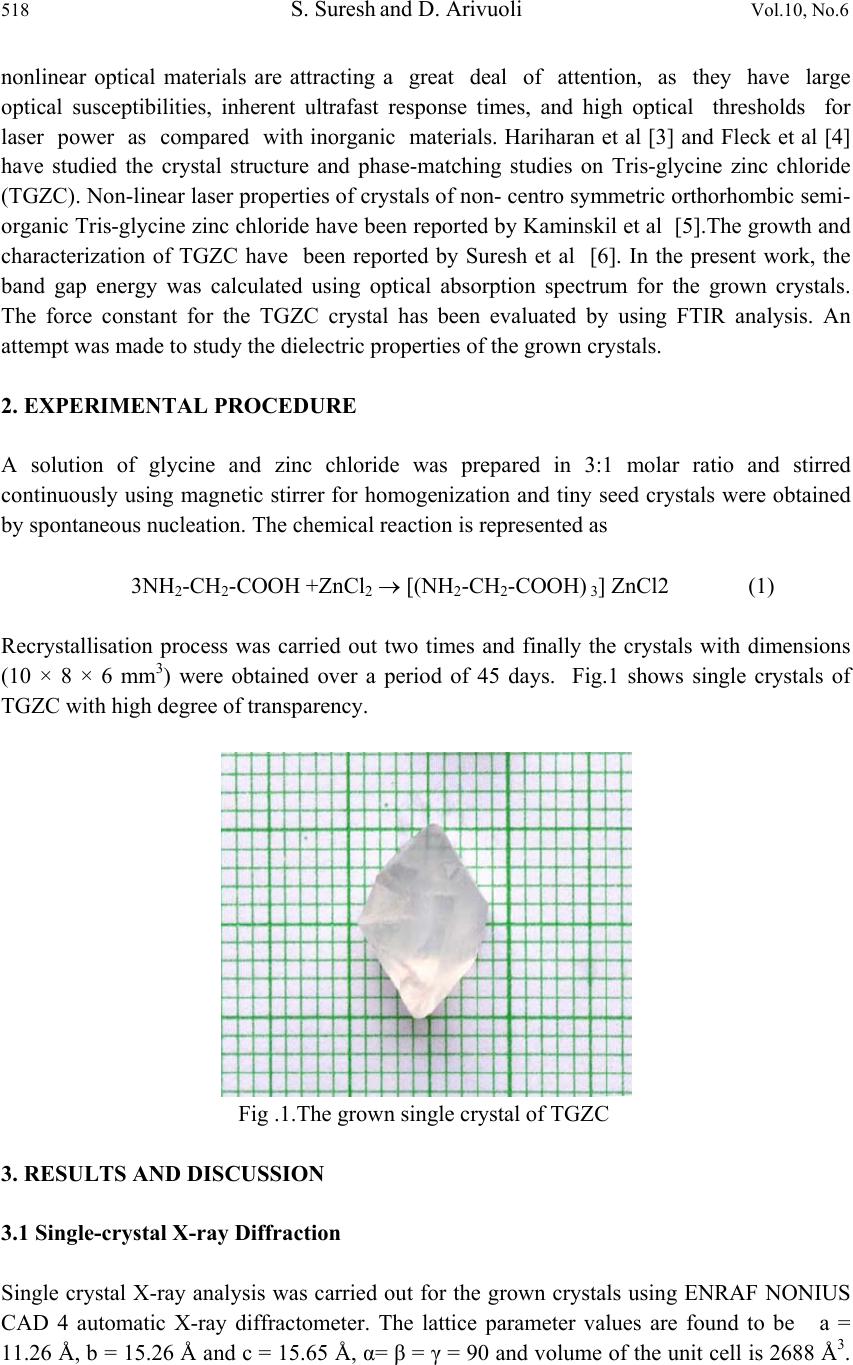 518 S. Suresh and D. Arivuoli Vol.10, No.6 nonlinear optical materials are attracting a great deal of attention, as they have large optical susceptibilities, inherent ultrafast response times, and high optical thresholds for laser power as compared with inorganic materials. Hariharan et al [3] and Fleck et al [4] have studied the crystal structure and phase-matching studies on Tris-glycine zinc chloride (TGZC). Non-linear laser properties of crystals of non- centro symmetric orthorhombic semi- organic Tris-glycine zinc chloride have been reported by Kaminskil et al [5].The growth and characterization of TGZC have been reported by Suresh et al [6]. In the present work, the band gap energy was calculated using optical absorption spectrum for the grown crystals. The force constant for the TGZC crystal has been evaluated by using FTIR analysis. An attempt was made to study the dielectric properties of the grown crystals. 2. EXPERIMENTAL PROCEDURE A solution of glycine and zinc chloride was prepared in 3:1 molar ratio and stirred continuously using magnetic stirrer for homogenization and tiny seed crystals were obtained by spontaneous nucleation. The chemical reaction is represented as 3NH2-CH2-COOH +ZnCl2 [(NH2-CH2-COOH) 3] ZnCl2 (1) Recrystallisation process was carried out two times and finally the crystals with dimensions (10 × 8 × 6 mm3) were obtained over a period of 45 days. Fig.1 shows single crystals of TGZC with high degree of transparency. Fig .1.The grown single crystal of TGZC 3. RESULTS AND DISCUSSION 3.1 Single-crystal X-ray Diffraction Single crystal X-ray analysis was carried out for the grown crystals using ENRAF NONIUS CAD 4 automatic X-ray diffractometer. The lattice parameter values are found to be a = 11.26 Å, b = 15.26 Å and c = 15.65 Å, α= β = γ = 90 and volume of the unit cell is 2688 Å3. 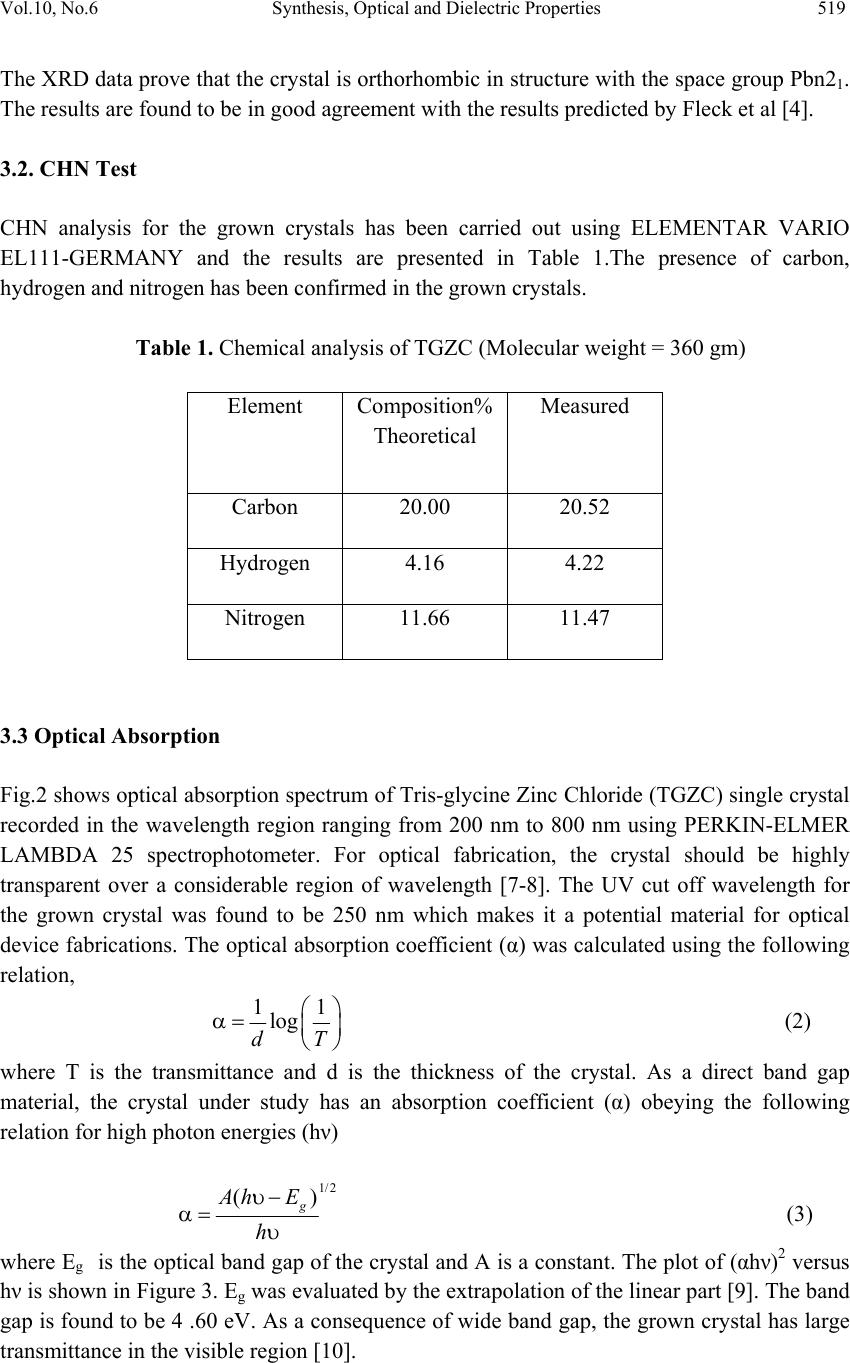 Vol.10, No.6 Synthesis, Optical and Dielectric Properties 519 The XRD data prove that the crystal is orthorhombic in structure with the space group Pbn21. The results are found to be in good agreement with the results predicted by Fleck et al [4]. 3.2. CHN Test CHN analysis for the grown crystals has been carried out using ELEMENTAR VARIO EL111-GERMANY and the results are presented in Table 1.The presence of carbon, hydrogen and nitrogen has been confirmed in the grown crystals. Table 1. Chemical analysis of TGZC (Molecular weight = 360 gm) 3.3 Optical Absorption Fig.2 shows optical absorption spectrum of Tris-glycine Zinc Chloride (TGZC) single crystal recorded in the wavelength region ranging from 200 nm to 800 nm using PERKIN-ELMER LAMBDA 25 spectrophotometer. For optical fabrication, the crystal should be highly transparent over a considerable region of wavelength [7-8]. The UV cut off wavelength for the grown crystal was found to be 250 nm which makes it a potential material for optical device fabrications. The optical absorption coefficient (α) was calculated using the following relation, 11 log dT (2) where T is the transmittance and d is the thickness of the crystal. As a direct band gap material, the crystal under study has an absorption coefficient (α) obeying the following relation for high photon energies (hν) 1/2 () g Ah E h (3) where Eg is the optical band gap of the crystal and A is a constant. The plot of (αhν)2 versus hν is shown in Figure 3. Eg was evaluated by the extrapolation of the linear part [9]. The band gap is found to be 4 .60 eV. As a consequence of wide band gap, the grown crystal has large transmittance in the visible region [10]. Element Composition% Theoretical Measured Carbon 20.00 20.52 Hydrogen 4.16 4.22 Nitrogen 11.66 11.47 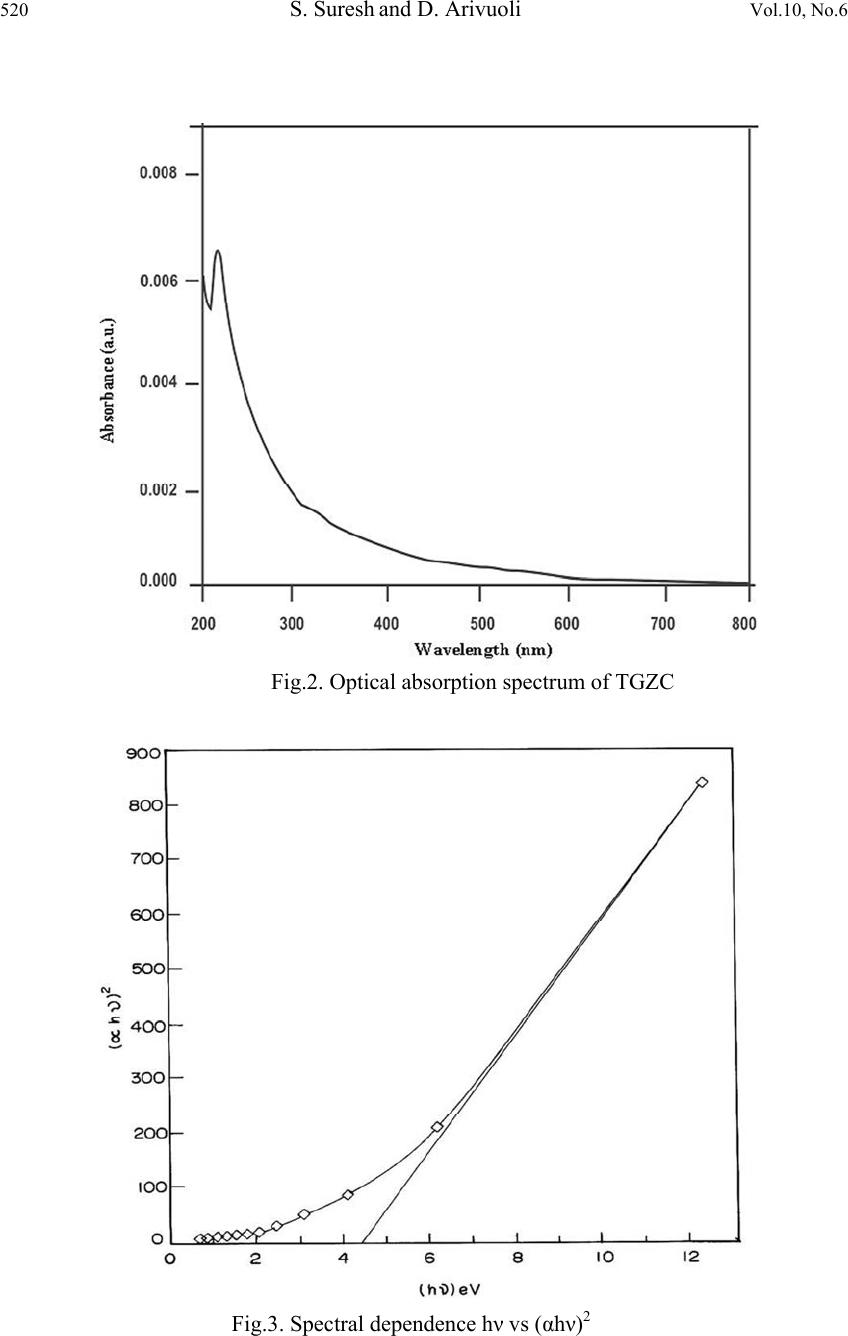 520 S. Suresh and D. Arivuoli Vol.10, No.6 Fig.2. Optical absorption spectrum of TGZC Fig.3. Spectral dependence hν vs (αhν)2  Vol.10, No.6 Synthesis, Optical and Dielectric Properties 521 3.4 Optical Constants The optical constants (n, K) were determined from the transmission (T) and reflection (R) spectrum. The transmittance of the crystal [11] is 2 2 (1) exp() 1Rexp(2) R t Tt (4) where t is the thickness and α is related to extinction coefficient K by 4 K (5) The Reflectance (R) is the written in terms of refractive index (n) [12] as 2 2 1 1 n R n (6) It can also be written in terms of absorption coefficient as 11 exp(exp() 1 exp() tt Rt (7) From the above equation, the refractive index n can be derived as 2 (1)3 103 2( 1) RRR nR (8) Figure 4 shows the plot of extinction coefficient (K) as a function of wavelength. From the graph, it is clear that extinction coefficient (K) value increases with increase in the photon energy. The dependence of refractive index (n) on the wavelength is shown in Figure 5 and it is seen that the refractive index decreases as the photon energy decreases. Thus, the extinction coefficient (K) and refractive index (n) depend on the photon energy. It is understood that the higher value of photon energy will enhance the optical efficiency of the material. Hence, by tailoring the photon energy, one can achieve the desired material for optical device fabrication.  522 S. Suresh and D. Arivuoli Vol.10, No.6 Fig.4. Wavelength vs extinction coefficient (K) Fig.5. Wavelength vs Refractive index (n)  Vol.10, No.6 Synthesis, Optical and Dielectric Properties 523 3.5 FTIR Spectrum The FTIR spectral analysis for the grown crystal has been recorded in the range 400-4000 cm-¹ using KBr pellet technique and the resultant spectrum is shown in Fig.6. The carbonyl stretching C=O is found to be near 1083 cm-1.A peak at 2694 cm-1 corresponds to NH2 deformation. The C-N stretching and the O-H stretching bands are found to be near 1125 and 3186 cm-1 respectively. A peak at 2694 cm-1 corresponds to CH2 stretching. The band at 1580 cm-1 indicates the presence of symmetric stretching of carboxylate (COO-) ion. The force constant (k) calculations were made for the vibration frequencies of NH2 deformation, COO- stretching, CH2 stretching, O-H stretching, C-N stretching, C=O stretching, by using the formula, 222 4e Ck (9) where ωe2 is the fundamental vibrational frequency, μ is the reduced mass ba ba MM MM Fig.6. FTIR spectrum of TGZC crystal The force constants for different vibrations are presented in Table 2. It is seen that the values are higher for C=O stretching and COO groups. The objective of this investigation is to find out the stretching, deformation and interaction force constants corresponding to each substituent and its position in the molecule. The value of force constant k was found to be 1282 N/m and 1083 N/m for COO stretching and C=O stretching respectively. The set of force constants reported here predicts the observed frequencies for COO stretching and C=O stretching.  524 S. Suresh and D. Arivuoli Vol.10, No.6 Table 2 Force Constant (k) for different vibrations of TGZC single crystal Frequency (cm-1) Vibration assignment Force Constant(k) N/m 1610 NH2 deformation 269 1580 COO stretching 1282 2694 CH2 stretching 737 3186 O-H stretching 566 1125 C-N stretching 481 1638 C=O stretching 1083 3.6 Dielectric Property The dielectric studies were carried out using silver coated samples placed between the two copper electrodes which form a parallel plate capacitor. The capacitance of the sample was noted for the applied frequency that varies from 50 Hz to 5 MHz at different temperatures (35◦C, 55◦C, 75◦C and 95◦C). Fig.7 shows the plot of dielectric constant (εr) versus applied frequency for different temperatures. The applied frequency is represented by logarithmic values in the plot. The dielectric constant decreases with the applied frequency and it is also observed that εr increases with increasing temperature. The very high value of εr at low frequencies may be due to the presence of all the four polarizations namely: space charge, orientation, electronic and ionic polarization and its low value at higher frequencies may be due to the loss of significance of these polarizations gradually. The high value of dielectric constant at lower frequencies may be attributed to space charge and ionic polarizations. The low value of dielectric loss at high frequencies suggests that the sample possesses enhanced optical quality with lesser defects and this parameter is of vital importance for NLO applications [13].Fig. 8 represents the dielectric loss versus frequency at different temperatures. It is observed that the dielectric loss decreases with increase of frequency.  Vol.10, No.6 Synthesis, Optical and Dielectric Properties 525 Fig.7. Frequency vs dielectric constant Fig.8. Frequency vs dielectric loss 4. CONCLUSION Single crystals of Tris-glycine Zinc Chloride (TGZC) were grown from aqueous solution by slow evaporation technique under room temperature. The grown crystals were characterized by single crystal XRD and it is confirmed that the crystal belongs to the orthorhombic system  526 S. Suresh and D. Arivuoli Vol.10, No.6 with space group Pbn21. The band gap for the grown crystal is found to be 4.60 eV. The optical investigations show a high value of both extinction coefficient (K) and refractive index (n) indicating high transparency of the crystal which confirms its suitability for optical switch device fabrication. The functional groups and the force constant (k) values were predicted by using FTIR analysis. Dielectric measurements were carried to analyse the dielectric constant and dielectric loss at different frequencies and temperatures. REFERENCES [1] P.N.Prasad, D.J.Williams, Introduction to Nonlinear Optical Effects in Organic Molecules and Polymers, Wiley, New York, 1991. [2] D.S.Chemla, J.Zyss, Eds. Nonlinear Optical Properties of Organic Molecules and Crystals; Academic Press, NewYork, 1987. [3] S. Hariharan, S. Rajan, R. Srinivasan and S. Natrajan Z. Kristallographie 217, 188 (1989) [4] M. Fleck, P. Becker, L. Bayarjargal, R. Ochrombel, and L. Bohaty, Cryst. Res. Technol. 43(2008) [5] A.A. Kaminskil, L. Bohaty, P. Becker, H.J. Eichler, H. Rhee, and J. Hanuza, Laser Phys. Lett.6. 12, 872-885 (2009) [6] S. Suresh and R. Vasanthakumari, RASAYAN J.Chem.2, 441-448 (2009) [7] V. Krishnakumar and R. Nagalakshmi, Spectrochim. Acta A 61, 499 (2005) [8] V. Krishnakumar and R. John Xavier, Spectrochim. Acta A 60, 709 (2005) [9] A.K.Chawla, D.Kaur, and R.Chandra, Opt.Mater.10.1016/j.optmat.02, 20, (2006) [10] D. D. O Eya, A. J. Ekpunobi, and C. E. Okeke, Acad. Open Internet J. 17 (2006) [11] R. E. Denton, R. D. Campbell, and S. G. Tomlin, J. Phys. D 5, 852 (1972) [12] A. Ashour, N. El-Kadry, and S. A. Mahmoud, Thin Solid Films 269, 117 (1995) [13] C. Balarew and R. Duhlew, J. Solid State Chem. 55, 1 (1984) |