Paper Menu >>
Journal Menu >>
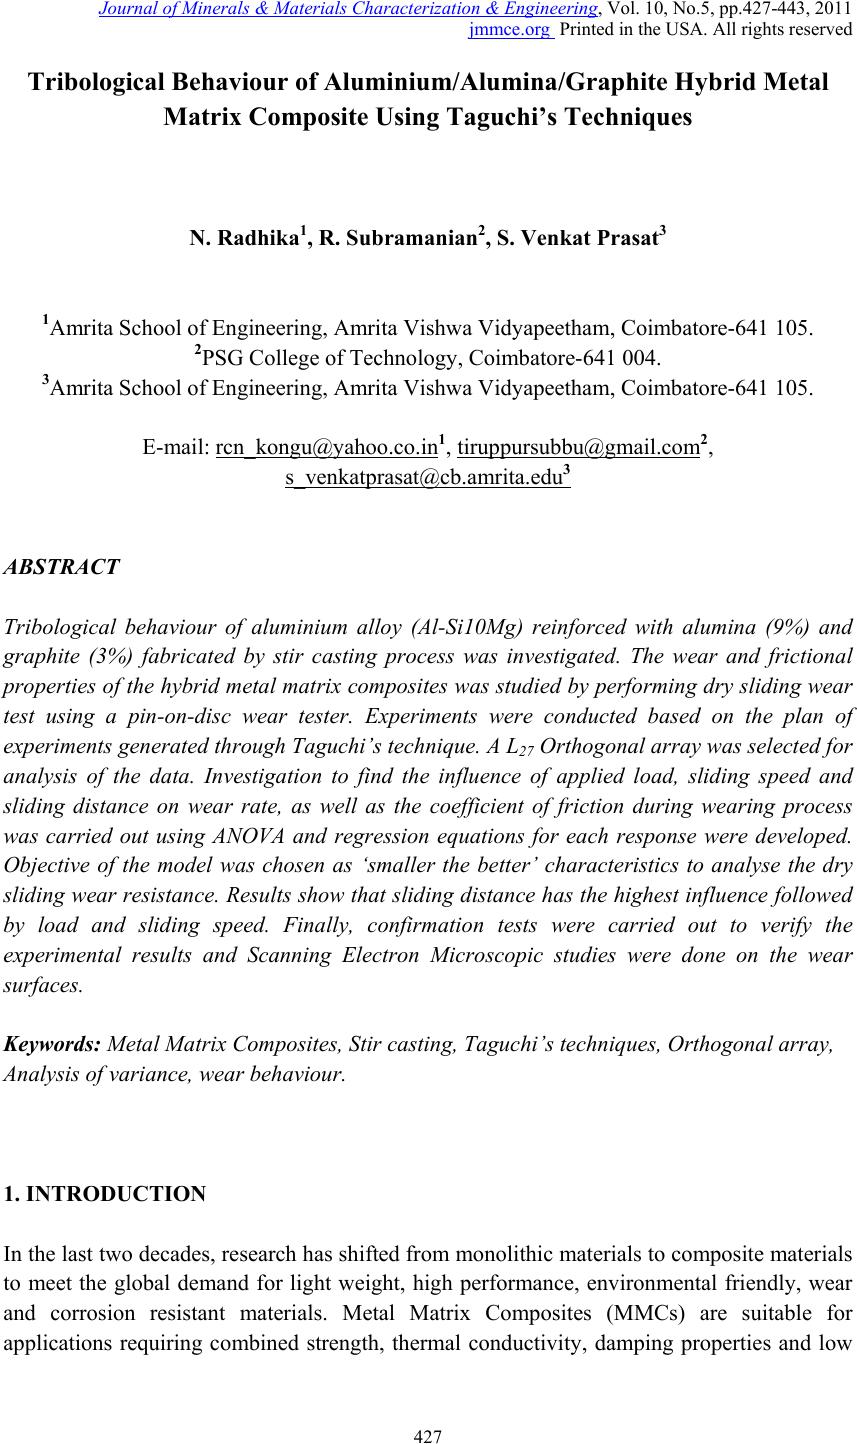 Journal of Minerals & Materials Characterization & Engineering, Vol. 10, No.5, pp.427-443, 2011 jmmce.org Printed in the USA. All rights reserved 427 Tribological Behaviour of Aluminium/Alumina/Graphite Hybrid Metal Matrix Composite Using Taguchi’s Techniques N. Radhika1, R. Subramanian2, S. Venkat Prasat3 1Amrita School of Engineering, Amrita Vishwa Vidyapeetham, Coimbatore-641 105. 2PSG College of Technology, Coimbatore-641 004. 3Amrita School of Engineering, Amrita Vishwa Vidyapeetham, Coimbatore-641 105. E-mail: rcn_kongu@yahoo.co.in1, tiruppursubbu@gmail.com2, s_venkatprasat@cb.amrita.edu3 ABSTRACT Tribological behaviour of aluminium alloy (Al-Si10Mg) reinforced with alumina (9%) and graphite (3%) fabricated by stir casting process was investigated. The wear and frictional properties of the hybrid metal matr ix composites was studied by performin g dry sliding wear test using a pin-on-disc wear tester. Experiments were conducted based on the plan of experiments generated through Taguchi’s technique. A L27 Orthogonal array was selected for analysis of the data. Investigation to find the influence of applied load, sliding speed and sliding distance on wear rate, as well as the coefficient of friction during wearing process was carried out using ANOVA and regression equations for each response were developed. Objective of the model was chosen as ‘smaller the better’ characteristics to analyse the dry sliding wear resistance. Results show that sliding distance has the highest influence followed by load and sliding speed. Finally, confirmation tests were carried out to verify the experimental results and Scanning Electron Microscopic studies were done on the wear surfaces. Keywords: Metal Matrix Composites, Stir casting, Taguchi’s techniques, Orthogonal array, Analysis of variance, wear behaviour. 1. INTRODUCTION In the last two decades, research has shifted from monolithic materials to composite materials to meet the global demand for light weight, high performance, environmental friendly, wear and corrosion resistant materials. Metal Matrix Composites (MMCs) are suitable for applications requiring combined strength, thermal conductivity, damping properties and low  428 N. Radhika, R. Subramanian, S. Venkat Prasat Vol.10, No.5 coefficient of thermal expansion with lower density. These properties of MMCs enhance their usage in automotive and tribological applications [1-3]. In the field of automobile, MMCs are used for pistons, brake drum and cylinder block because of better corrosion resistance and wear resistance [4, 5]. Fabrication of MMCs has several challenges like porosity formation, poor wettability and improper distribution of reinforcement. Achieving uniform distribution of reinforcement is the foremost important work. A new technique of fabricating cast Aluminium matrix composite has been proposed to improve the wettability between alloy and reinforcement [6]. In this, all the materials are placed in graphite crucible and heated in an inert atmosphere until the matrix alloy is melted and followed by two step stirring action to obtain uniform distribution of reinforcement. The fabrication techniques of MMCs play a major role in the improvement of mechanical and tribological properties. The performance characteristics of Al alloy reinforced with 5% volume fraction of SiC fabricated through stir casting and powder metallurgy have been analysed [7] and found that the stir casting specimen have higher strength compared to powder metallurgy specimen. The size and type of reinforcement also has a significant role in determining the mechanical and tribological properties of the composites. The effect of type of reinforcements such as SiC whisker, alumina fiber and SiC particle fabricated by Powder Metallurgy on the properties of MMCs has been investigated [8]. It was found that there existed a strong dependence on the kind of reinforcement and its volume fraction. The results revealed that particulate reinforcement is most beneficial for improving the wear resistance of MMCs. Aluminium based silicon carbide particulate metal matrix composites fabricated using two step mixing method of stir casting technique by varying the volume fraction of SiC (5%, 10%, 15%, 20%, 25% and 30%) showed an increasing trend in hardness and impact strength values with increase in volume fraction of SiC [9]. The tribological properties are considered to be one of the major factors controlling the performance. The tribological properties of aluminium matrix composites reinforced with short steel fibers prepared by vortex method have been investigated [10]. In this case, the wear rate and coefficient of friction was determined using pin-on-disc type apparatus by varying the applied load from 10-40 N with a constant sliding velocity of 1.8m/s and a sliding distance of 2000m. The study reports that the volumetric wear increased with increasing applied load and the transition from mild wear to severe wear depends on the strength of the pin material adjacent to the contact surface. A Numerical analysis of pin on disc tests on Al–Li/SiC composites at different loads and temperature has been reported [11] .A finite element model was developed to simulate the wear result. The sliding distance of the pin is discretized in several steps according to the input velocity and was observed that temperature effect on the wear rate is more critical and the role of the reinforcement particles in the matrix increases the transition temperature from the mild to the severe wear regimes. There is a growing interest worldwide in manufacturing hybrid metal matrix composites [HMMCs] which possesses combined properties of its reinforcements and exhibit improved physical, mechanical and tribological properties [12,13]. Aluminium matrix composites  Vol.10, No.5 Tribological Behaviour of Aluminium/Alumina/Graphite 429 reinforced with flyash and silicon carbide was developed using conventional foundry techniques. The reinforcements were varied by 5%, 10%, and 15% by weight. The hybrid composite was tested for fluidity, hardness, density, mechanical properties, impact strength, dry sliding wear, slurry erosive wear and corrosion. The results show an increasing trend in all the properties with increase in flyash and SiC content, except density which decreased with increase in reinforcements [14]. The tribological properties of HMMCs are also increased by increasing reinforcements at all applied conditions [15]. Application of Design of Experiments (DOE) concepts like Taguchi, factorial and surface response has gained importance since these were helpful in providing information on influence of various parameters in hierarchical rank order. The combined effects of these parameters can be analysed and correlation terms can also be found out using these techniques. The tribological behaviour of Al2219 reinforced with SiC and graphite particles have been studied [16]. Influence of parameters like normal load, sliding speed, sliding distance and weight percentage of reinforcements on dry sliding wear was analyzed by employing an orthogonal array and Analysis of Variance (ANOVA) technique. The results showed that graphite particles are effective agents in increasing dry sliding wear resistance of Al/SiC composite. Much research work has been devoted to develop metal matrix composites and to investigate their mechanical and tribological properties. Based on the literature review, an attempt is made to study the influence of wear parameters such as applied load, sliding speed, and sliding distance on the dry sliding wear behaviour of the Al/Alumina/graphite hybrid metal matrix composites using Taguchi design of experiment. Combined effect of the above mentioned parameters were also investigated by including their interactions using ANOVA technique. 2. DESIGN OF EXPERIMENTS (DOE) Design of Experiment is one of the important and powerful statistical techniques to study the effect of multiple variables simultaneously [17] and involves a series of steps which must follow a certain sequence for the experiment to yield an improved understanding of process performance. All designed experiments require a certain number of combinations of factors and levels be tested in order to observe the results of those test conditions. Taguchi approach relies on the assignment of factors in specific orthogonal arrays to determine those test combinations. The DOE process is made up of three main phases: the planning phase, the conducting phase, and the analysis phase. A major step in the DOE process is the determination of the combination of factors and levels which will provide the desired information. Analysis of the experimental results uses a signal to noise ratio to aid in the determination of the best process designs. This technique has been successfully used by researchers in the study of dry sliding wear behaviour of composites [18]. These methods focus on improving the design of manufacturing processes. In the present work, a plan order for performing the experiments was generated by Taguchi method using orthogonal arrays and analysis of parameters was done using ANOVA technique. This method yields the rank of various  430 N. Radhika, R. Subramanian, S. Venkat Prasat Vol.10, No.5 parameters with the level of significance of influence of a factor or the interaction of factors on a particular output response. 3. MATERIAL SELECTION In the present investigation, Al-Si10Mg alloy was chosen as the base matrix since its properties can be tailored through heat treatment process. The first reinforcement was graphite, average size of 50 to 70 microns, and there are sufficient literatures [19, 20] elucidating the improvement in wear properties through the addition of graphite. However there is also a decline in mechanical properties due to inclusion of graphite above 1% [21]. To compensate the reduction in mechanical properties, a second reinforcement of alumina, size 15-20 microns, in particulate form was chosen. Alumina being hard and brittle in nature gets accommodated in soft ductile aluminium base matrix, enhancing the overall stiffness and strength of the HMMC. The chemical composition of matrix alloy is given in Table 1. Table 1 Chemical composition of the matrix alloy Chemical Composition Cu Mg Si Fe Mn Ni Zn Pb Sn Ti Al % 0.1 max 0.2- 0.6 10.0- 13.0 0.6 max 0.3- 0.7 0.1 max 0.1 max 0.1 max 0.05 max 0.2 max Balance 3.1 Composite Preparation In order to achieve high level of mechanical properties in the composite, a good interfacial bonding (wetting) between the dispersed phase and the liquid matrix has to be obtained. Liquid metallurgy route is one such simplest and cost effective method to fabricate metal matrix composites which has been adopted by many researchers [22, 23]. This method is most economical to fabricate composites with discontinuous fibers and particulates and was used in this work to obtain the as cast specimens. Care was taken to maintain an optimum casting parameters of stirring speed (350 rpm), stirring time (3 min) and pouring temperature (700°C). The reinforcements were preheated prior to their addition in the aluminium alloy melt. Degassing agent (hexacholro ethane) was used to reduce gas porosities. 1.5 wt% Magnesium was added to the molten metal to facilitate the dispersion of particles into the alloy during melting and also to improve the wettability between molten metal and reinforcements. The molten metal was then poured into a permanent cast iron mould of diameter 14mm and length 100mm. The die was released after 2 minutes and the cast specimens were taken out. 3.2. Wear Behaviour A pin on disc test apparatus was performed to determine the sliding wear characteristics of the composite. Specimens of size 10 mm diameter and 30 mm length were cut from the cast  Vol.10, No.5 Tribological Behaviour of Aluminium/Alumina/Graphite 431 samples, machined and then polished. The contact surface of the cast sample (pin) has to be flat and will be in contact with the rotating disk. During the test, the pin is held pressed against a rotating EN32 steel disc (hardness of 65HRC) by applying load that acts as counterweight and balances the pin. The track diameter was varied for each batch of experiments in the range of 70 mm to 110 mm and the parameters such as the load, sliding speed and sliding distance were varied in the range given in Table 2. A LVDT (load cell) on the lever arm helps determine the wear at any point of time by monitoring the movement of the arm. Once the surface in contact wears out, the load pushes the arm to remain in contact with the disc. This movement of the arm generates a signal which is used to determine the maximum wear and the coefficient of friction is monitored continuously as wear occurs. Weight loss of each specimen was obtained by weighing the specimen before and after the experiment by a single pan electronic weighing machine with an accuracy of 0.0001g after thorough cleaning with acetone solution. Table 2 Process parameters and levels Level Load ,L (N) Sliding speed, S (m/s) Sliding distance,D(m) 1 20 1.5 700 2 30 2.5 1400 3 40 3.5 2100 4. PLAN OF EXPERIMENTS Dry sliding wear test was performed with three parameters: applied load, sliding speed, and sliding distance and varying them for three levels. According to the rule that degree of freedom for an orthogonal array should be greater than or equal to sum of those wear parameters, a L27 Orthogonal array which has 27 rows and 13 columns was selected as shown in Table 3. The selection of Orthogonal array depends on three items in order of priority, viz., the number of factors and their interactions, number of levels for the factors and the desired experimental resolution or cost limitations. A total of 27 experiments were performed based on the run order generated by the Taguchi model. The response for the model is wear rate and coefficient of friction. In Orthogonal array, first column is assigned to applied load, second column is assigned to Sliding speed and fifth column is assigned to sliding distance and the remaining columns are assigned to their interactions. The objective of model is to minimize wear rate and coefficient of friction. The responses were tabulated and results were subjected to Analysis of Variance (ANOVA). The Signal to Noise (S/N) ratio, which condenses the multiple data points within a trial, depends on the type of characteristic being evaluated. The S/N ratio characteristics can be divided into three categories, viz. ‘nominal is the best’, ‘larger the better’ and ‘smaller the better ‘characteristics. In this study, ‘smaller the better’ characteristics was chosen to analyse the dry sliding wear resistance. The S/N ratio for wear rate and coefficient of friction using ‘smaller the better’ characteristic given by Taguchi, is as follows:  432 N. Radhika, R. Subramanian, S. Venkat Prasat Vol.10, No.5 S/N = -10 log (y12+ y22+..... yn2) where y1, y2...yn are the response of friction and sliding wear and n is the number of observations. The response table for signal to noise ratios show the average of selected characteristics for each level of the factor. This table includes the ranks based on the delta statistics, which compares the relative value of the effects. S/N ratio is a response which consolidates repetitions and the effect of noise levels into one data point. Analysis of variance of the S/N ratio is performed to identify the statistically significant parameters. Table 3 Orthogonal array L27 (313) of Taguchi L27(313)test 1 2 3 4 5 6 7 891011 12 13 1 1 1 1 1 1 1 1 111 1 1 1 2 1 1 1 1 2 2 2 222 2 2 2 3 1 1 1 1 3 3 3 333 3 3 3 4 1 2 2 2 1 1 1 222 3 3 3 5 1 2 2 2 2 2 2 333 1 1 1 6 1 2 2 2 3 3 3 111 2 2 2 7 1 3 3 3 1 1 1 333 2 2 2 8 1 3 3 3 2 2 2 111 3 3 3 9 1 3 3 3 3 3 3 222 1 1 1 10 2 1 2 3 1 2 3 123 1 2 3 11 2 1 2 3 2 3 1 231 2 3 1 12 2 1 2 3 3 1 2 312 3 1 2 13 2 2 3 1 1 2 3 231 3 1 2 14 2 2 3 1 2 3 1 312 1 2 3 15 2 2 3 1 3 1 2 123 2 3 1 16 2 3 1 2 1 2 3 312 2 3 1 17 2 3 1 2 2 3 1 123 3 1 2 18 2 3 1 2 3 1 2 231 1 2 3 19 3 1 3 2 1 3 2 132 1 3 2 20 3 1 3 2 2 1 3 213 2 1 3 21 3 1 3 2 3 2 1 321 3 2 1 22 3 2 1 3 1 3 2 213 3 2 1 23 3 2 1 3 2 1 3 321 1 3 2 24 3 2 1 3 3 2 1 132 2 1 3 25 3 3 2 1 1 3 2 321 2 1 3 26 3 3 2 1 2 1 3 132 3 2 1 27 3 3 2 1 3 2 1 213 1 3 2  Vol.10, No.5 Tribological Behaviour of Aluminium/Alumina/Graphite 433 5. RESULTS AND DISCUSSIONS The aim of the experimental plan is to find the important factors and combination of factors influencing the wear process to achieve the minimum wear rate and coefficient of friction. The experiments were developed based on an orthogonal array, with the aim of relating the influence of sliding speed, applied load and sliding distance. These design parameters are distinct and intrinsic feature of the process that influence and determine the composite performance. Taguchi recommends analysing the S/N ratio using conceptual approach that involves graphing the effects and visually identifying the significant factors. 5.1 Results of Statistical Analysis of Experiments The results for various combinations of parameters were obtained by conducting the experiment as per the Orthogonal array. The measured results were analysed using the commercial software MINITAB 14 specifically used for design of experiment applications. Table 4 shows the experimental results average of two repetitions for wear rate and coefficient of friction. To measure the quality characteristics, the experimental values are transformed into signal to noise ratio. The influence of control parameters such as load, sliding speed, and sliding distance on wear rate and coefficient of friction has been analysed using signal to noise response table. The ranking of process parameters using signal to noise ratios obtained for different parameter levels for wear rate and coefficient of friction are given in Table 5 and Table 6 respectively. The control factors are statistically significant in the signal to noise ratio and it could be observed that the sliding distance is a dominant parameter on the wear rate and coefficient of friction followed by applied load and sliding speed. Figure (1-4) shows the influence of process parameters on wear rate and coefficient of friction graphically. The analysis of these experimental results using S/N gives the optimum conditions resulting in minimum wear rate and coefficient of friction. The optimum condition for wear rate and coefficient of friction as shown in Figure 2 and 4 are L1, S3 and R3.Thus, the optimal setting of control factors for better wear resistance of hybrid metal matrix composite were arrived at. 5.2 Analysis of Variance Results for Wear Test The experimental results were analysed with Analysis of Variance (ANOVA) which is used to investigate the influence of the considered wear parameters namely, applied load, sliding speed, and sliding distance that significantly affect the performance measures. By performing analysis of variance, it can be decided which independent factor dominates over the other and the percentage contribution of that particular independent variable. Table 7 and 8 show the ANOVA results for wear rate and coefficient of friction for three factors varied at three levels and interactions of those factors. This analysis is carried out for a significance level of α=0.05, i.e. for a confidence level of 95%. Sources with a P-value less than 0.05 were 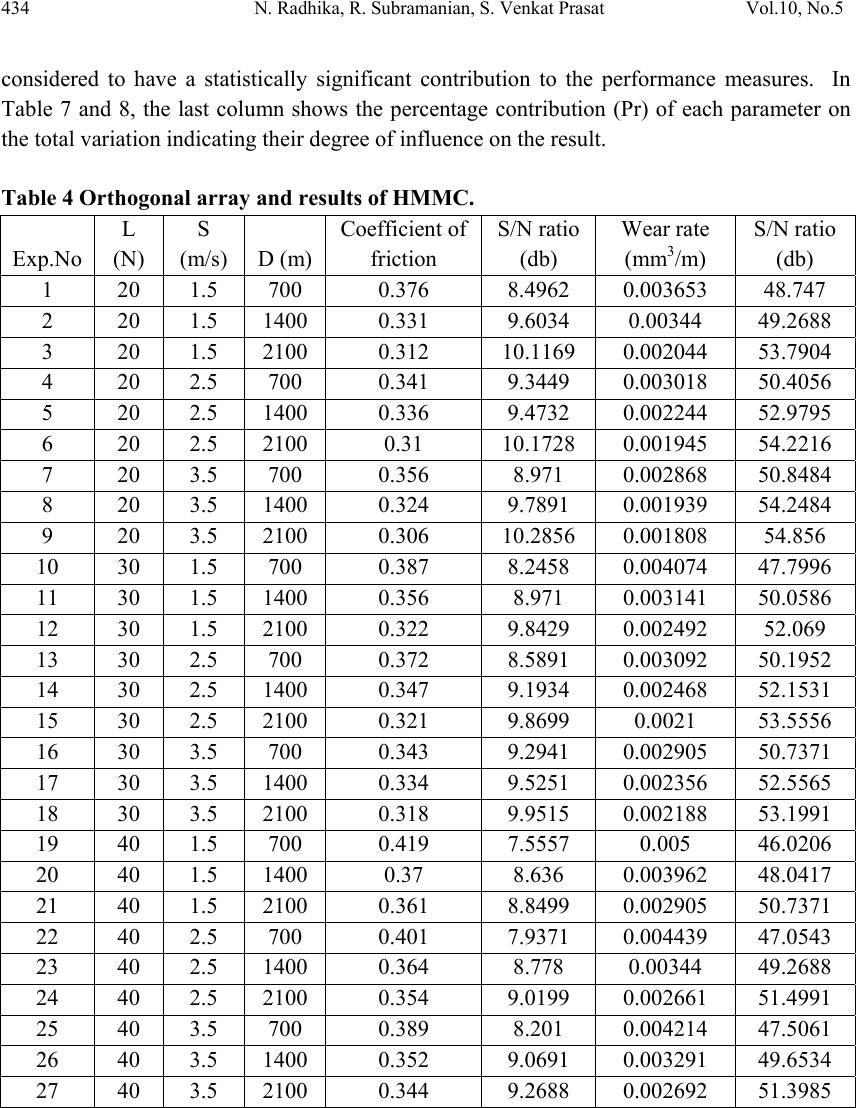 434 N. Radhika, R. Subramanian, S. Venkat Prasat Vol.10, No.5 considered to have a statistically significant contribution to the performance measures. In Table 7 and 8, the last column shows the percentage contribution (Pr) of each parameter on the total variation indicating their degree of influence on the result. Table 4 Orthogonal array and results of HMMC. Exp.No L (N) S (m/s) D (m) Coefficient of friction S/N ratio (db) Wear rate (mm3/m) S/N ratio (db) 1 20 1.5 700 0.376 8.4962 0.003653 48.747 2 20 1.5 1400 0.331 9.6034 0.00344 49.2688 3 20 1.5 2100 0.312 10.1169 0.002044 53.7904 4 20 2.5 700 0.341 9.3449 0.003018 50.4056 5 20 2.5 1400 0.336 9.4732 0.002244 52.9795 6 20 2.5 2100 0.31 10.1728 0.001945 54.2216 7 20 3.5 700 0.356 8.971 0.002868 50.8484 8 20 3.5 1400 0.324 9.7891 0.001939 54.2484 9 20 3.5 2100 0.306 10.2856 0.001808 54.856 10 30 1.5 700 0.387 8.2458 0.004074 47.7996 11 30 1.5 1400 0.356 8.971 0.003141 50.0586 12 30 1.5 2100 0.322 9.8429 0.002492 52.069 13 30 2.5 700 0.372 8.5891 0.003092 50.1952 14 30 2.5 1400 0.347 9.1934 0.002468 52.1531 15 30 2.5 2100 0.321 9.8699 0.0021 53.5556 16 30 3.5 700 0.343 9.2941 0.002905 50.7371 17 30 3.5 1400 0.334 9.5251 0.002356 52.5565 18 30 3.5 2100 0.318 9.9515 0.002188 53.1991 19 40 1.5 700 0.419 7.5557 0.005 46.0206 20 40 1.5 1400 0.37 8.636 0.003962 48.0417 21 40 1.5 2100 0.361 8.8499 0.002905 50.7371 22 40 2.5 700 0.401 7.9371 0.004439 47.0543 23 40 2.5 1400 0.364 8.778 0.00344 49.2688 24 40 2.5 2100 0.354 9.0199 0.002661 51.4991 25 40 3.5 700 0.389 8.201 0.004214 47.5061 26 40 3.5 1400 0.352 9.0691 0.003291 49.6534 27 40 3.5 2100 0.344 9.2688 0.002692 51.3985 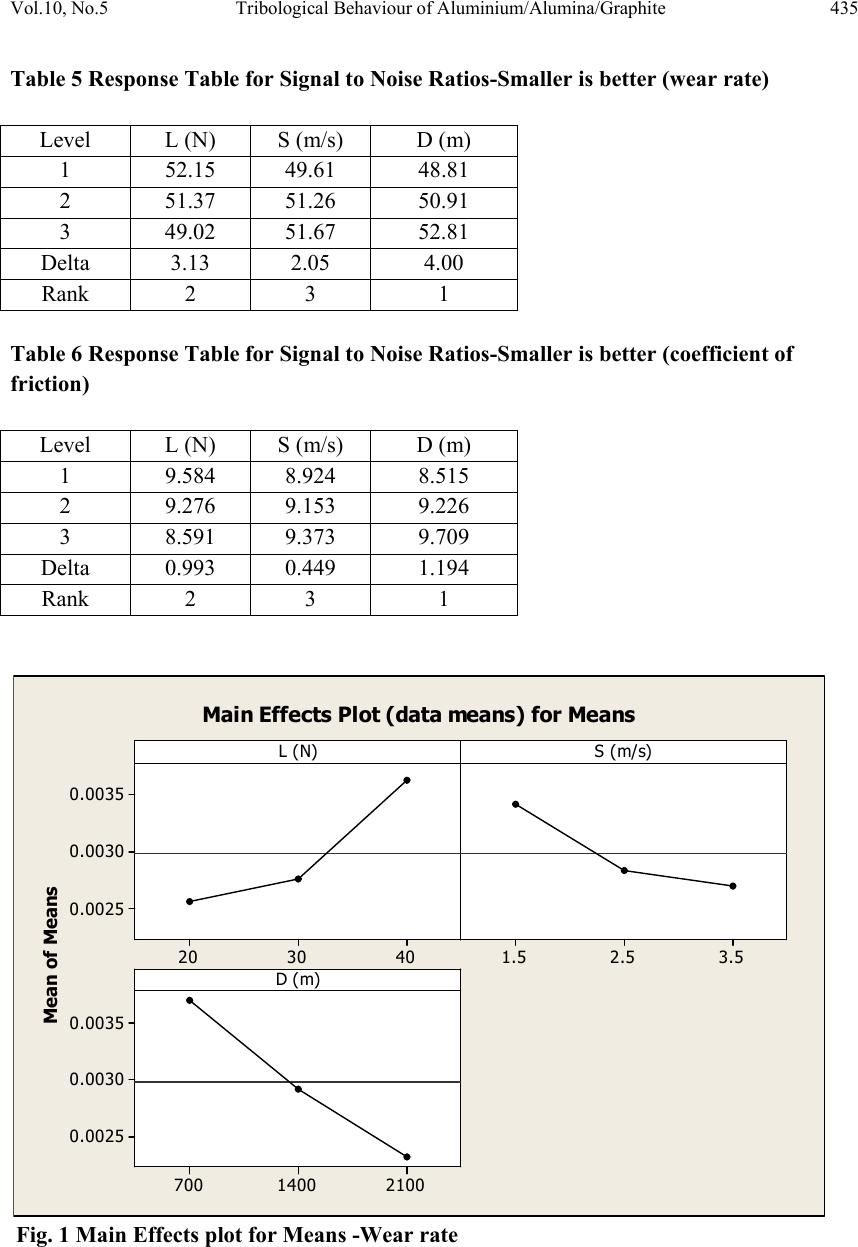 Vol.10, No.5 Tribological Behaviour of Aluminium/Alumina/Graphite 435 Table 5 Response Table for Signal to Noise Ratios-Smaller is better (wear rate) Level L (N) S (m/s) D (m) 1 52.15 49.61 48.81 2 51.37 51.26 50.91 3 49.02 51.67 52.81 Delta 3.13 2.05 4.00 Rank 2 3 1 Table 6 Response Table for Signal to Noise Ratios-Smaller is better (coefficient of friction) Level L (N) S (m/s) D (m) 1 9.584 8.924 8.515 2 9.276 9.153 9.226 3 8.591 9.373 9.709 Delta 0.993 0.449 1.194 Rank 2 3 1 Fig. 1 Main Effects plot for Means -Wear rate Mean of Means 403020 0.0035 0.0030 0.0025 3.52.51.5 21001400700 0.0035 0.0030 0.0025 L ( N)S (m/s) D ( m ) M ain Effects Plot (da ta mean s) for Means 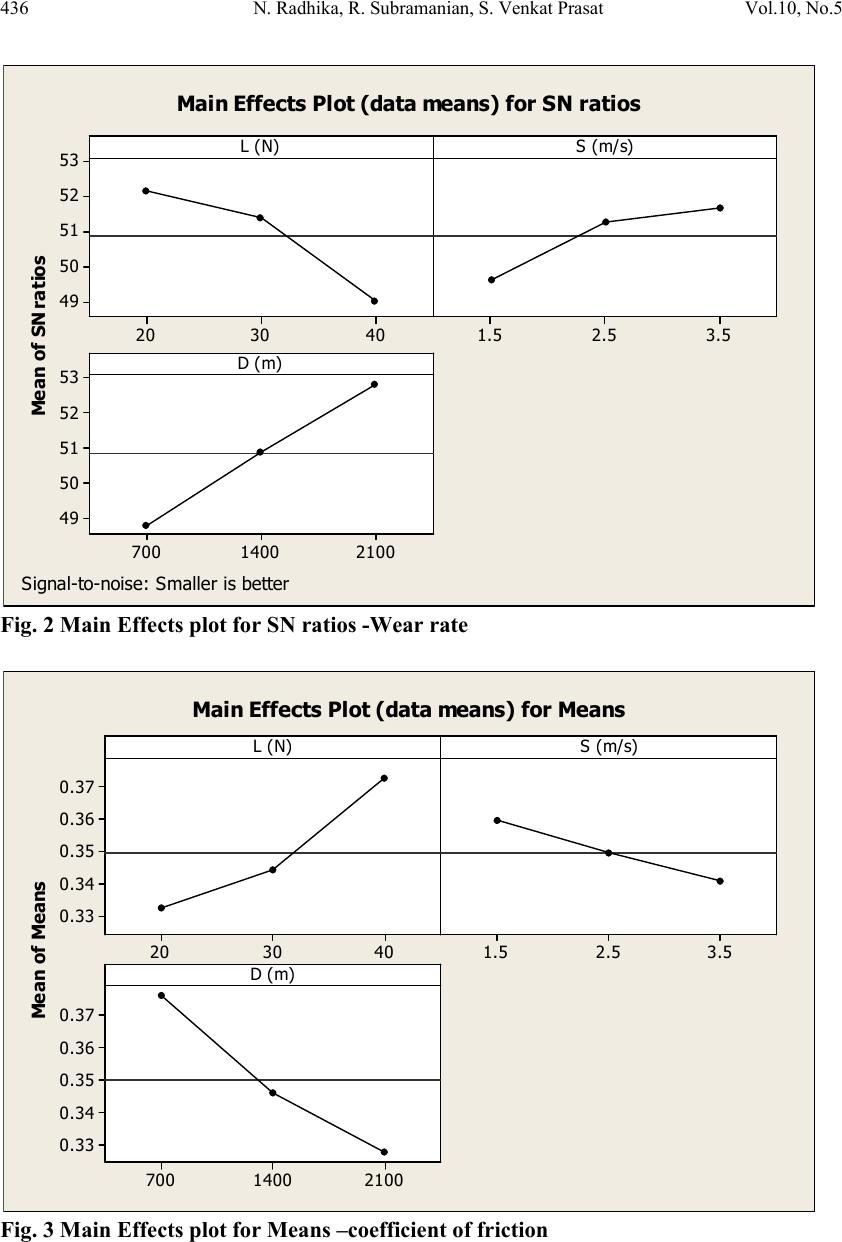 436 N. Radhika, R. Subramanian, S. Venkat Prasat Vol.10, No.5 Fig. 2 Main Effects plot for SN ratios -Wear rate Fig. 3 Main Effects plot for Means –coefficient of friction Mea n of SN ratios 403020 53 52 51 50 49 3.52.51.5 21001400700 53 52 51 50 49 L ( N)S (m/s) D ( m ) M ain E ffects Plot (d ata mean s) for SN ratios Signal-to-no ise: Smaller is better Mean of Means 403020 0.37 0.36 0.35 0.34 0.33 3.52.51.5 21001400700 0.37 0.36 0.35 0.34 0.33 L ( N)S (m/s) D ( m) M ain Effects Plot (da ta mean s) for Means 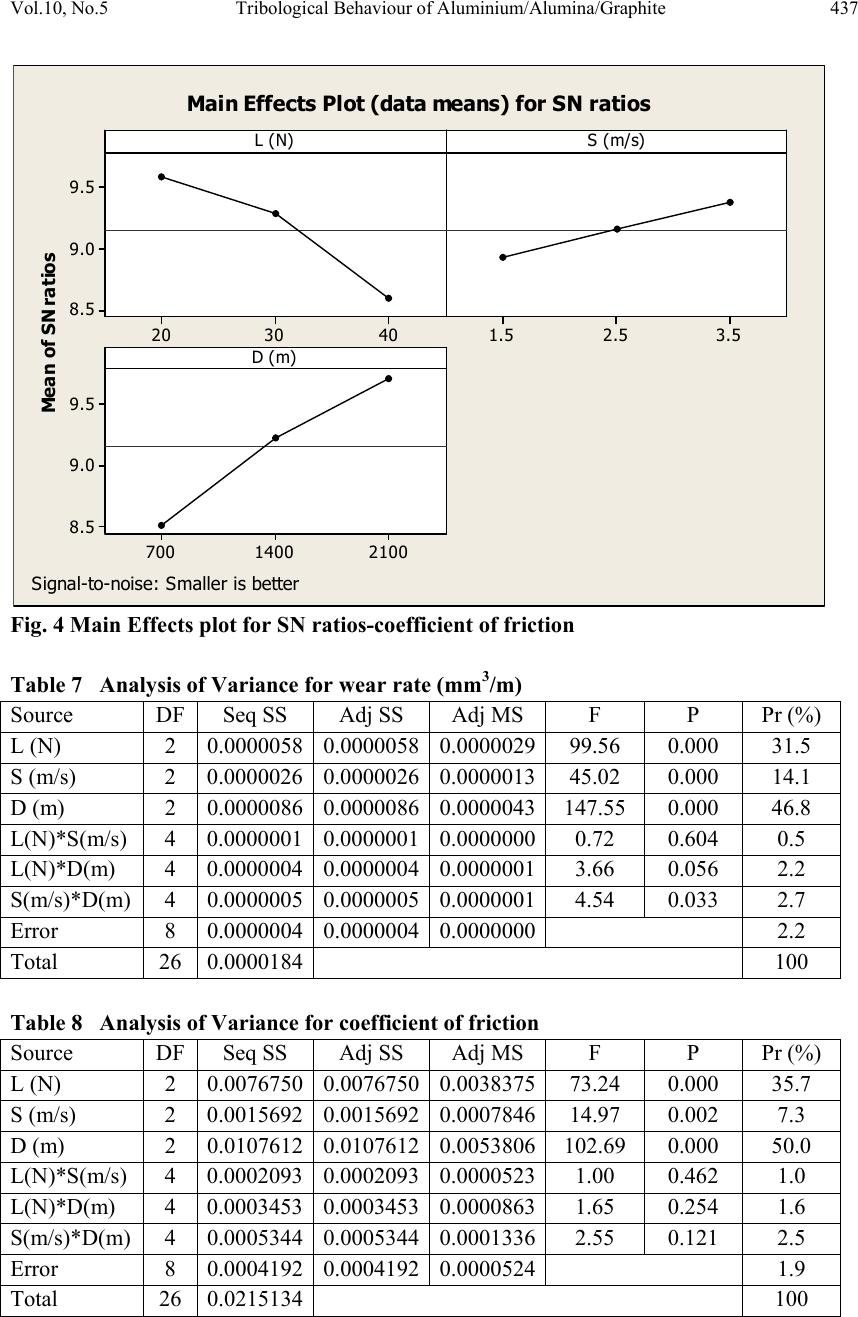 Vol.10, No.5 Tribological Behaviour of Aluminium/Alumina/Graphite 437 Fig. 4 Main Effects plot for SN ratios-coefficient of friction Table 7 Analysis of Variance for wear rate (mm3/m) Source DF Seq SS Adj SS Adj MS F P Pr (%) L (N) 2 0.0000058 0.0000058 0.0000029 99.56 0.000 31.5 S (m/s) 2 0.0000026 0.0000026 0.0000013 45.02 0.000 14.1 D (m) 2 0.0000086 0.0000086 0.0000043 147.55 0.000 46.8 L(N)*S(m/s) 4 0.0000001 0.0000001 0.0000000 0.72 0.604 0.5 L(N)*D(m) 4 0.0000004 0.0000004 0.0000001 3.66 0.056 2.2 S(m/s)*D(m) 4 0.0000005 0.0000005 0.0000001 4.54 0.033 2.7 Error 8 0.0000004 0.0000004 0.0000000 2.2 Total 26 0.0000184 100 Table 8 Analysis of Variance for coefficient of friction Source DF Seq SS Adj SS Adj MS F P Pr (%) L (N) 2 0.0076750 0.0076750 0.0038375 73.24 0.000 35.7 S (m/s) 2 0.0015692 0.0015692 0.0007846 14.97 0.002 7.3 D (m) 2 0.0107612 0.0107612 0.0053806 102.69 0.000 50.0 L(N)*S(m/s) 4 0.0002093 0.0002093 0.0000523 1.00 0.462 1.0 L(N)*D(m) 4 0.0003453 0.0003453 0.0000863 1.65 0.254 1.6 S(m/s)*D(m) 4 0.0005344 0.0005344 0.0001336 2.55 0.121 2.5 Error 8 0.0004192 0.0004192 0.0000524 1.9 Total 26 0.0215134 100 Mea n of SN ratios 403020 9.5 9.0 8.5 3.52.51.5 21001400700 9.5 9.0 8.5 L ( N)S (m/s) D ( m ) M ain E ffects Plot (d ata mean s) for SN ratios Signal-to-no ise: Smaller is better 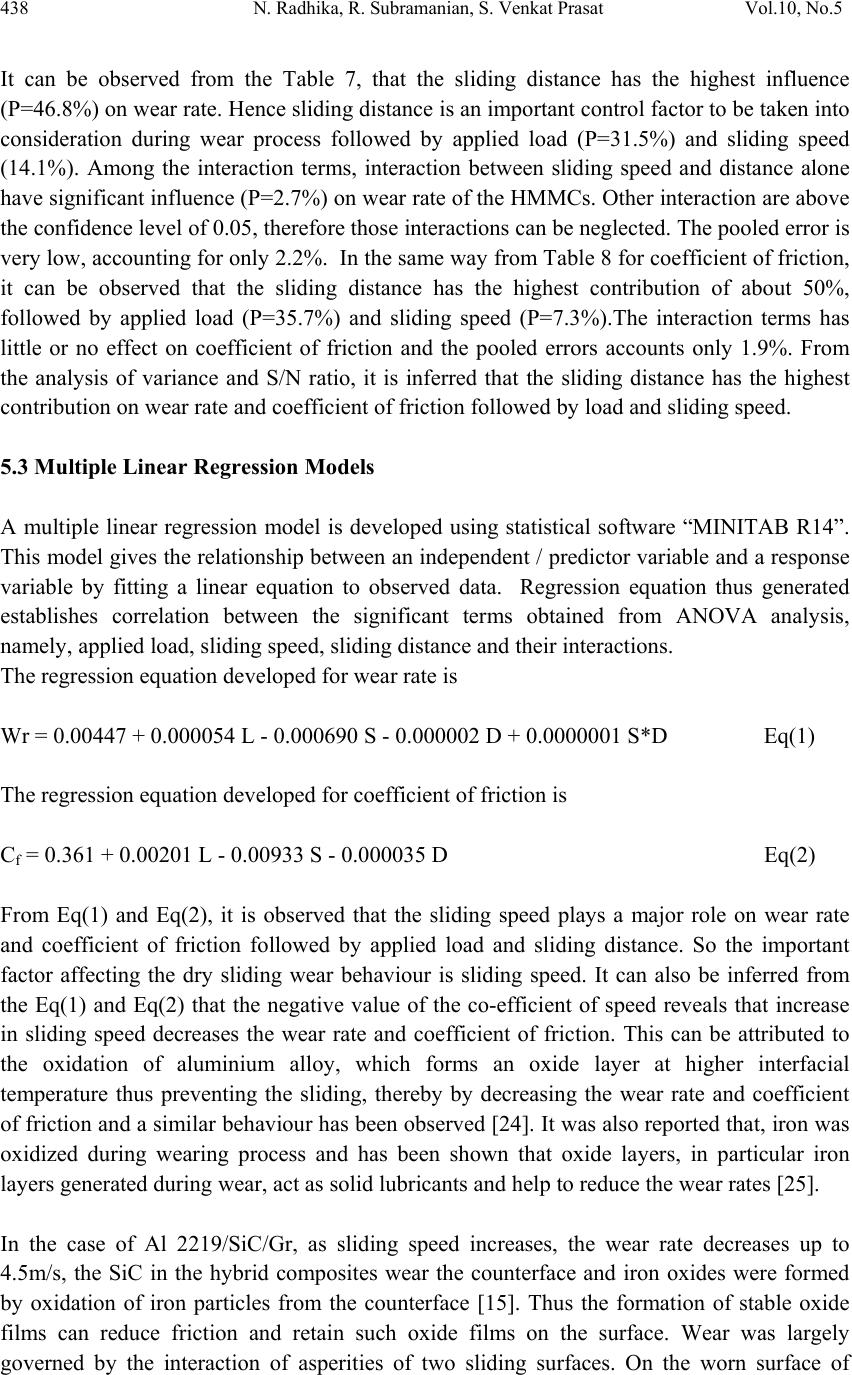 438 N. Radhika, R. Subramanian, S. Venkat Prasat Vol.10, No.5 It can be observed from the Table 7, that the sliding distance has the highest influence (P=46.8%) on wear rate. Hence sliding distance is an important control factor to be taken into consideration during wear process followed by applied load (P=31.5%) and sliding speed (14.1%). Among the interaction terms, interaction between sliding speed and distance alone have significant influence (P=2.7%) on wear rate of the HMMCs. Other interaction are above the confidence level of 0.05, therefore those interactions can be neglected. The pooled error is very low, accounting for only 2.2%. In the same way from Table 8 for coefficient of friction, it can be observed that the sliding distance has the highest contribution of about 50%, followed by applied load (P=35.7%) and sliding speed (P=7.3%).The interaction terms has little or no effect on coefficient of friction and the pooled errors accounts only 1.9%. From the analysis of variance and S/N ratio, it is inferred that the sliding distance has the highest contribution on wear rate and coefficient of friction followed by load and sliding speed. 5.3 Multiple Linear Regression Models A multiple linear regression model is developed using statistical software “MINITAB R14”. This model gives the relationship between an independent / predictor variable and a response variable by fitting a linear equation to observed data. Regression equation thus generated establishes correlation between the significant terms obtained from ANOVA analysis, namely, applied load, sliding speed, sliding distance and their interactions. The regression equation developed for wear rate is Wr = 0.00447 + 0.000054 L - 0.000690 S - 0.000002 D + 0.0000001 S*D Eq(1) The regression equation developed for coefficient of friction is Cf = 0.361 + 0.00201 L - 0.00933 S - 0.000035 D Eq(2) From Eq(1) and Eq(2), it is observed that the sliding speed plays a major role on wear rate and coefficient of friction followed by applied load and sliding distance. So the important factor affecting the dry sliding wear behaviour is sliding speed. It can also be inferred from the Eq(1) and Eq(2) that the negative value of the co-efficient of speed reveals that increase in sliding speed decreases the wear rate and coefficient of friction. This can be attributed to the oxidation of aluminium alloy, which forms an oxide layer at higher interfacial temperature thus preventing the sliding, thereby by decreasing the wear rate and coefficient of friction and a similar behaviour has been observed [24]. It was also reported that, iron was oxidized during wearing process and has been shown that oxide layers, in particular iron layers generated during wear, act as solid lubricants and help to reduce the wear rates [25]. In the case of Al 2219/SiC/Gr, as sliding speed increases, the wear rate decreases up to 4.5m/s, the SiC in the hybrid composites wear the counterface and iron oxides were formed by oxidation of iron particles from the counterface [15]. Thus the formation of stable oxide films can reduce friction and retain such oxide films on the surface. Wear was largely governed by the interaction of asperities of two sliding surfaces. On the worn surface of  Vol.10, No.5 Tribological Behaviour of Aluminium/Alumina/Graphite 439 MMCs a mechanically mixed layer (MML) was present and this layer exhibited a hardness approximately six times that of the bulk composite. So the formation of work hardened layer between the pin surface and steel disc also reduces the wear rate as sliding speed increases [26] and also stated that the presence of MML layer controlled the wear rate and the wear debris indicates the presence of a substantial level of iron, transferred from the disc material. Thus it can be concluded that the wear rate was found to increase with an increase in wear load and decrease with an increase in wear speed [2]. To understand the wear mechanism of composites, the worn surfaces were examined by Scanning Electron Microscopy. During sliding,the entire surface of the pin has contact with the surface of the steel disc and machine marks can also be observed.Fig 5-7 shows the micrographs of the worn surface of composites at an applied load of 40N, sliding distance of 2100m for sliding speed of 1.5m/s, 2.5m/s and 3.5m/s respectively. Grooves were mainly formed by the reinforcing particles. As the sliding speed increases, the number of grooves also increases and the reinforcements are projecting out from the pin surface due to ploughing action between counterface and pin and formation of wear debris was also observed. Fig 5. Load=40N, Distance=2100m, S=1.5m/s Fig 6. Load=40N, Distance=2100m, S=2.5m/s Fig 7. Load=40N, Distance=2100m, S=3.5m/s  440 N. Radhika, R. Subramanian, S. Venkat Prasat Vol.10, No.5 The effect of applied load is directly proportional to wear rate, i.e., as applied load increases, wear rate also increases. The positive coefficient of load indicates that dry sliding wear rate of the composite increases by increasing load. This is because, the temperature at the interface between the disc and the pin increases with increase in the applied load and the same has been observed in A356 Al composites [27]. Abrasive wear is possible at low loads, where the reinforcing hard alumina particles remain intact without fracture during wear and thus act as load bearing elements. Thus at low loads, the abrasion wear mechanism becomes dominant and as the load increases, the induced stresses exceed the fracture strength of the particles causing their fracture. Thus material transfer from pin onto the disc can also occur due to the rubbing action of the fractured alumina particles against steel disc and the removal of material from the surface of the pin increases with increase in load. These results in an increase in wear rate and coefficient of friction and the matrix result in deterioration of the wear resistance of the composite [28, 29]. The negative value of distance is indicative that increase in sliding distance decreases the wear rate as well as coefficient of friction and this can be attributed to the presence of hard alumina particle which provides abrasion resistance, resulting in enhanced dry sliding wear performance. The addition of graphite as a reinforcement in the aluminium composites improves the friction and wear behaviour due to its self lubrication property [30]. This graphite smears on the sliding pin surface and forms a layer which reduces wear. The regression coefficient of the model for wear rate and co-efficient of friction is 0.9. The interaction between the variables has less effect on wear rate. 6. CONFIRMATION EXPERIMENT A confirmation experiment is the final step in the Design process. A dry sliding wear test was conducted using a specific combination of the parameters and levels to validate the statistical analysis. The key task is the determination of the preferred combination of the levels of the factors indicated to be significant by the analytical methods and also to validate the conclusions drawn during the analysis phase. Table 9 shows the values used for conducting the dry sliding wear test and Table 10 shows the results of confirmation test and comparison was made between the experimental values and the computed values developed from the regression model. The experimental value of wear rate is found to be varying from wear rate calculated in regression equation by error percentage between 6.09% to 14.1%, while for coefficient of friction it is between 3.88% to 8.28%. Thus, the calculated wear rate and co-efficient of friction from the regression equation and experimental values are nearly same with least error.  Vol.10, No.5 Tribological Behaviour of Aluminium/Alumina/Graphite 441 Table 9 Confirmation experiment for wear rate and coefficient of friction Exp.No Load ,L (N) Sliding speed,S (m/s)Sliding distance,D (m) 1 22 1.8 800 2 28 2.3 1300 3 38 2.7 1800 Table 10 Result of confirmation experiment and their comparison with regression model Exp.No Exp wear rate (mm3/m) Reg model equ(1),wear rate( mm3/m) % errorExp co- efficient of friction Reg model equ(2),coefficient of friction % error 1 0.003241 0.00296 8.67 0.346 0.360 3.88 2 0.00223 0.002094 6.09 0.321 0.350 8.28 3 0.001801 0.001545 14.1 0.333 0.349 4.58 7. CONCLUSIONS Following are the conclusions drawn from the study on dry sliding wear test using Taguchi’s technique. Sliding distance (46.8%) has the highest influence on wear rate followed by applied load (31.5%) and sliding speed (14.1%) and for coefficient of friction, the contribution of sliding distance is 50%, applied load is 35.7% and sliding speed is 7.3%. Incorporation of graphite as primary reinforcement increases the wear resistance of composites by forming a protective layer between pin and counter face and the inclusion of alumina as a secondary reinforcement also has a significant effect on the wear behaviour. Regression equation generated for the present model was used to predict the wear rate and coefficient of friction of HMMC for intermediate conditions with reasonable accuracy. Confirmation experiment was carried out and made a comparison between experimental values and computed values showing an error associated with dry sliding wear of composites varying from 3.88% to 14.1%. Thus, Design of experiments by Taguchi method was successfully used to predict the tribological behaviour of composites. REFERENCES [1] Sharma, S.C., Girish, B.M., Kamath, R. and Satish, B.M.,1999, “Fractography, fluidity, and tensile properties of aluminum/hematite particulate composites”, Journal of Materials Engineering and Performance, Vol.8, No. 3, pp.309-314.  442 N. Radhika, R. Subramanian, S. Venkat Prasat Vol.10, No.5 [2] Seah, K.H.W., Sharma, S.C., Rao, P.R and B. M. Girish, B.M, 1995, “Mechanical properties of as-cast and heat-treated ZA-27/silicon carbide particulate composites”, J.Materials and Design,Vol.16, Issue 5, pp.277-281. [3] Shanta Sastry, Krishna, M. and Jayagopal Uchil, 2001, “A study on damping behaviour of aluminite particulate reinforced ZA-27 alloy metal matrix composites”, J. of Alloys and Compounds, Vol.314, Issue1-2, pp.268-274. [4] Natarajan, N., Vijayarangan, S., Rajendran, I., 2007, “ Fabrication,testing and thermal analysis of metal matrix composite brake drum”, Internal journal of Vehicle Design, Vol.44, No-3-4, pp.339-359. [5] Prasad. S.V., Asthana, R., 2004, “Aluminium-metal matrix composites for automotive applications: tribological considerations”, Tribology, vol.17, No.3, pp.445-453. [6] Jasmi Hashim, 2001, “The production of cast Metal matrix composite by a modified stir casting method”, Journal Technology, 35 (A), pp.9-20. [7] Jayaseelan, V., Kalaichelvan, K., Kannan, M., Vijay Ananth, S., 2010, “Extrusion characterizes of Al/Sic by different manufacturing process”, Internal journal of Applied engineering research,Vol.1, No.2, pp.194-199. [8] T. Miyajima and Y. Iwai, Effects of reinforcements on sliding wear behaviour of aluminium matrix composites, Wear, 255(1-6), 2003, p 606-616. [9] Manoj Singla, D. Deepak Dwivedi, Lakhvir Singh, Vikas Chawla, 2009, “Development of Aluminium Based Silicon Carbide Particulate Metal Matrix Composite”, Journal of Minerals & Materials Characterization & Engineering, Vol. 8, No.6, pp 455-467. [10] Mandal.D., Dutta.B.K, Panigrahi.S.C, 2004, “Wear and friction behaviour of stir cast aluminium-base short steel fiber reinforced composites”, Wear, Vol.257, Issue 7-8, pp.654-664. [11] Gonzalez, C., Martin, A., Llorca, J., Garrido, M.A., Gomez, M.T., Rico, A., Rodriguez, J, 2005, “Numerical analysis of pin on disc tests on Al-Li/SiC composites”, J. Wear, vol.259, pp.609-612. [12] Song, J.I. and Han, K.S, 1997, “Effect of volume fraction of carbon fibers on wear behaviour of Al/Al2O3/C hybrid metal matrix composites”, composite structures, Vol.39, Issues 3-4, pp.309-318. [13] Dolata Grosz. A., Wieczorek, J, 2007, “Tribological properties of hybrid composites containing two carbide phases”, Archives of Materials Science and Engineering, Vol.28, Issue.3, pp.149-155. [14] Mahendra, K.V., Radhakrishna, K, 2010, “Characterization of Stir Cast Al—Cu—(fly ash + SiC) Hybrid Metal Matrix Composites”, Journal of Composite Materials, vol. 44 Issue No. 8, pp. 989-1005. [15] Basavarajappa, S. Chandra Mohan, G. Mukund, K. Ashwin, M and Prabu, M, 2006, “Dry sliding wear behaviour of Al 2219/SiC/Gr hybrid metal matrix composites”.J.Materials Engineering and performance, Vol.15, Issue.6, pp.668-674. [16] Basavarajappa, S., G. Chandramohan, 2005, “Wear Studies on Metal Matrix Composites: a Taguchi Approach”, J. Mater. Sci. Technol., Vol.21, No.6, pp. 845- 850.  Vol.10, No.5 Tribological Behaviour of Aluminium/Alumina/Graphite 443 [17] Taguchi.G and Konishi, S., 1987, “Taguchi methods, orthogonal arrays and linear graphs, tools for quality engineering”, Dearborn, MI: American supplier Institute, pp. 35-38. [18] Chauhan, S.R., Anoop Kumar, Singh. I., Prashant Kumar, 2010, “Effect of fly ash content on friction and dry sliding wear behaviour of glass fiber reinforced polymer composites-A Taguchi approach”, Journal of Minerals and Materials Characterization and engineering”, Vol.9, No.4, pp.365-387. [19] Rohatgi, P. K. Ray, S. Liu, Y. 1992, “Tribological properties of metal matrix-graphite particle composites”, International Materials Reviews, Volume 37, 1992, pp. 129-152. [20] Mares, M., 2001, “Some issues on tailoring possibilities for mechanical properties of particulate reinforced metal matrix composites”, Journal of Optoelectronics and Advanced Materials, vol.3, No.1, pp.119-124. [21] Adel Mohammed Hassan and Mohammed T. Hayajneh, 2002, “The effect of the increase in Graphitic volumetric percentage on the strength and hardness of Al-4 weight percentage Mg-graphite composites”, J. materials Engineering and performance, Vol.11, pp. 250-255. [22] Chaudhury, S.K., Singh, A.K, Sivaramakrishnan, C.S.S., Panigrahi, S.C., 2004, “Preparation and thermo mechanical properties of stir cast Al–2Mg–11TiO2 (rutile) composite”, Bull. Mater. Sci., Vol. 27, No. 6, pp. 517–521. [23] Balasivanandha Prabu, S., Karunamoorthy, L., Kathiresan, S and Mohan, B., 2006, “Influence of stirring speed and stirring time on distribution of particles in cast metal matrix composite”, Journal of Materials Processing Technology, Vol.171, Issue 2, pp.268-273. [24] Amro M.Al-Qutub, Ibrahim M.Allam and M.A.Abdul Samad, 2008, “Wear and friction of Al-Al203 composites at various sliding speeds”, J. material science, 43, pp 5797- 5803. [25] Alphas, A.T and Zhang, J., 1992, “Effect of SiC particulate reinforcement on the dry sliding wear of aluminium-silicon alloys (A356)”, wear, Vol.155, pp.83-104. [26] Deuis, R.L, Subramanian and Yellup (1997), “Dry sliding wear of aluminium composites-a review”, J. Composite Science and Technology, Vol.57, pp.415-435. [27] Sudarshan and Surappa, M.K. (2008), “Dry sliding wear of fly ash particle reinforced A356 Al composites”, Wear, Vol.265, pp.349-360. [28] Sahin, Y., 2003, “Wear behaviour of aluminium alloy and its composites reinforced by SiC particles using statistical analysis”, J. Material Design, V0l.24, pp.95-103. [29] Banerji, A., Prasad, S.Y., Surappa, M.K., and Rohatgi, P.K., 1982, “Abrasive wears of cast aluminium alloy-zircon particle composites”, wear, 82, pp. 141-151. [30] Mahmoud, T.S, 2008, “Tribological behaviour of A390/Grp metal–matrix composites fabricated using a combination of rheocasting and squeeze casting techniques”, Journal of Mechanical Engineering Science, 222(2), pp. 257-265. |