Paper Menu >>
Journal Menu >>
 Journal of Minerals & Materials Characterization & Engineering, Vol. 10, No.4, pp.351-356, 2011 jmmce.org Printed in the USA. All rights reserved 351 Growth and Characterization of Gamma Glycine Single Crystal s Grown from Alpha Glycine in the Presence of Sodium Acetate T. Baraniraja, P. Philominathanb,* aDepartment of Physics, Roever College of Engineering & Technology, Perambalur-621 212, India bDepartment of Physics, A.V.V.M Sri Pushpam College (Autonomous), Poondi, Thanjavur- 613 503, India *Corresponding Author: philominathan@gmail.com ABSTRACT A nonlinear optical crystal of gamma glycine was grown by slow evaporation solution growth technique using deionized water and sodium acetate. The functional groups and vibrational frequencies were identified using FTIR spectral analysis. The cell parameters were determined from single crystal X-ray diffraction analysis. Thermogravimetric analysis (TGA) and differential thermal analysis (DTA) were used to study its thermal properties. The optical transmittance window and lower cutoff wavelength have been identified by UV-absorption spectrum analysis. Second harmonic generation (SHG) efficiency measurement was carried out by powder Kurtz method. Keywords: Nonlinear optical crystal; solution growth technique; characterization technique; second harmonic generation 1. INTRODUCTION Recent research is focused on the search for suitable materials displaying excellent second order nonlinear optical (SONLO) properties for potential application in optoelectronics, telecommunication and optical storage device [1]. Amino acids are interesting materials for NLO applications [2]. Among all the amino acids glycine is the simplest one and it has three polymorphic forms alpha, beta and gamma. It is reported that alpha and beta forms of glycine crystallizes in centrosymmetric space group P21/c [3,4] ruling out the possibility of optical 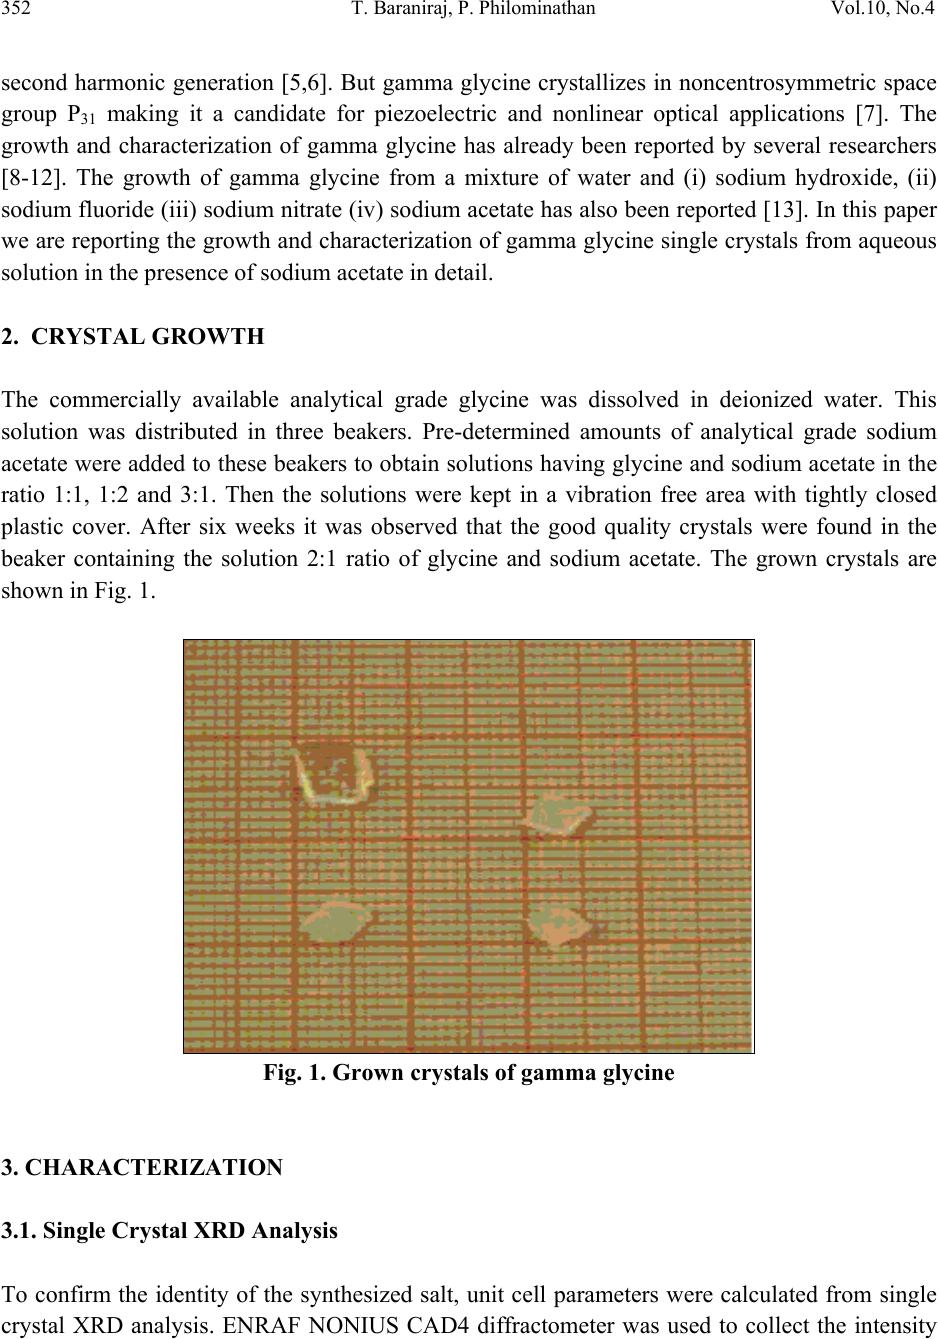 352 T. Baraniraj, P. Philominathan Vol.10, No.4 second harmonic generation [5,6]. But gamma glycine crystallizes in noncentrosymmetric space group P31 making it a candidate for piezoelectric and nonlinear optical applications [7]. The growth and characterization of gamma glycine has already been reported by several researchers [8-12]. The growth of gamma glycine from a mixture of water and (i) sodium hydroxide, (ii) sodium fluoride (iii) sodium nitrate (iv) sodium acetate has also been reported [13]. In this paper we are reporting the growth and characterization of gamma glycine single crystals from aqueous solution in the presence of sodium acetate in detail. 2. CRYSTAL GROWTH The commercially available analytical grade glycine was dissolved in deionized water. This solution was distributed in three beakers. Pre-determined amounts of analytical grade sodium acetate were added to these beakers to obtain solutions having glycine and sodium acetate in the ratio 1:1, 1:2 and 3:1. Then the solutions were kept in a vibration free area with tightly closed plastic cover. After six weeks it was observed that the good quality crystals were found in the beaker containing the solution 2:1 ratio of glycine and sodium acetate. The grown crystals are shown in Fig. 1. Fig. 1. Grown crystals of gamma glycine 3. CHARACTERIZATION 3.1. Single Crystal XRD Analysis To confirm the identity of the synthesized salt, unit cell parameters were calculated from single crystal XRD analysis. ENRAF NONIUS CAD4 diffractometer was used to collect the intensity  Vol.10, No.4 Crystal Growth and Characterization of Gamma Glycine 353 353 data using MoKα (λ=0.7170Å) radiation. Least square refinement of 25 reflections were done in the range 20-30˚. The obtained cell parameter values are a=b=7.19(5) Å, c=5.60(4) Å α=β=90˚ and =120˚. These values are in good agreement with the reported values [7]. 3.2. FTIR Spectral Analysis The FTIR analysis of gamma glycine was carried out in the middle IR region between 400 and 4000cm-1 by Perkin Elmer spectrophotometer using KBr pellet technique. The recorded spectrum is shown in Fig. 2. In the high energy region of the spectrum, there is a broad-like envelope between 2920 and 3180cm-1 resulting from the hydrogen bonded symmetric and asymmetric stretching vibrations of NH3+ group. The peaks observed at 504, 607 and 695cm-1 are attributed to carboxylate groups while the absorption peak at 1112cm-1 is attributed to NH3+ group. Thus carboxyl group is present as carboxylate ion and amino group is present as ammonium ion in gamma glycine. The peaks at 2922, 1332cm-1 are attributed to CH stretching vibration and CH2 wagging respectively. The peaks at 1603 and 1409cm-1 correspond to asymmetric and symmetric stretching vibration of COO-. The remaining peaks observed at 894, 1030cm-1 are due to CCN group. Fig. 2. FTIR spectrum of gamma glycine  354 T. Baraniraj, P. Philominathan Vol.10, No.4 3.3. Thermal Analyses The thermo gravimetric analysis (TGA) and differential thermal analysis (DTA) were carried out using NETZSCH STA 409C thermal analyzer at a heating rate of 20˚C/min in the nitrogen atmosphere to determine the thermal stability of the compound (Fig. 3). The DTA curve shows a major endothermic peak, which corresponds to the melting point of the material at 259˚C. Another important observation is that, there is no phase transition until the material melts and this enhances the temperature range for the utility of crystal for NLO applications. The absence of water of crystallization in the molecular structure is indicated by the absence of weight loss around 100˚C. From the TGA curve, it is observed that the material is stable up to 200˚C and it shows a sharp single weight loss after 200˚C which ends at 275˚C. At elevated temperature this decomposition process continuous up to 700˚C. Fig. 3. TG/DTA curve of gamma glycine 3.4. UV-Visible-NIR Spectral Study The UV-visible-NIR absorption spectrum of the grown crystal was carried out between 190 and 1100nm using Lambda (Model 35) spectrophotometer. The recorded UV- absorption spectrum is shown in Fig. 4. It is observed that the cut off wavelength is at around 300nm and the crystal is found to be transparent in the visible region of 300-1100nm. Absence of absorption in the region between 250 and 1200nm is the key requirement for the materials having NLO properties [14]. Hence, the title compound may be used for the NLO applications. 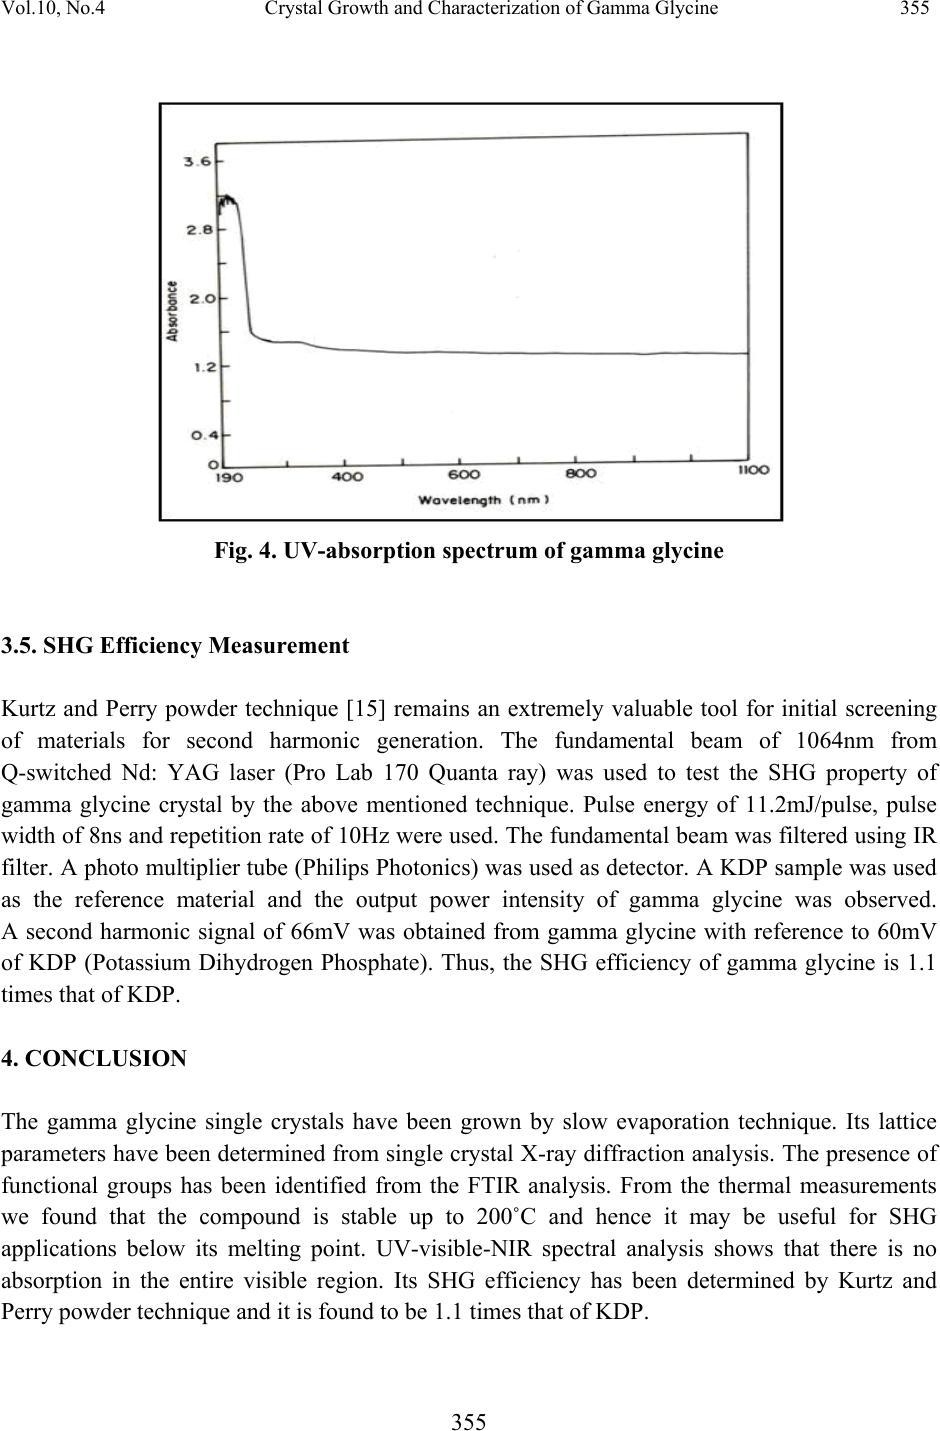 Vol.10, No.4 Crystal Growth and Characterization of Gamma Glycine 355 355 Fig. 4. UV-absorption spectrum of gamma glycine 3.5. SHG Efficiency Measurement Kurtz and Perry powder technique [15] remains an extremely valuable tool for initial screening of materials for second harmonic generation. The fundamental beam of 1064nm from Q-switched Nd: YAG laser (Pro Lab 170 Quanta ray) was used to test the SHG property of gamma glycine crystal by the above mentioned technique. Pulse energy of 11.2mJ/pulse, pulse width of 8ns and repetition rate of 10Hz were used. The fundamental beam was filtered using IR filter. A photo multiplier tube (Philips Photonics) was used as detector. A KDP sample was used as the reference material and the output power intensity of gamma glycine was observed. A second harmonic signal of 66mV was obtained from gamma glycine with reference to 60mV of KDP (Potassium Dihydrogen Phosphate). Thus, the SHG efficiency of gamma glycine is 1.1 times that of KDP. 4. CONCLUSION The gamma glycine single crystals have been grown by slow evaporation technique. Its lattice parameters have been determined from single crystal X-ray diffraction analysis. The presence of functional groups has been identified from the FTIR analysis. From the thermal measurements we found that the compound is stable up to 200˚C and hence it may be useful for SHG applications below its melting point. UV-visible-NIR spectral analysis shows that there is no absorption in the entire visible region. Its SHG efficiency has been determined by Kurtz and Perry powder technique and it is found to be 1.1 times that of KDP.  356 T. Baraniraj, P. Philominathan Vol.10, No.4 ACKNOWLEDGEMENTS The authors are grateful to the Coordinator, DST FIST Program, School of Chemistry, Bharathidasan University, Tiruchirappalli for providing the single crystal XRD facilities. REFERENCES [1] S. Selvakumar et.al., J. Mater. Chem. and Phy. 103 (2007a)153. [2] M. Narayan Bhat, and S.M. Dharmaprakash, J. Crystal Growth. 236 (2002a) 376. [3] P.G. Jonson, and A.K. Vick, Acta Crystallogr. B27 (1972) 2237. [4] L.F. Ower, and K.E. Turner Moore, Acta Crystallogr. B32 (1976) 11. [5] G. Albrecht, and R.B. Corey, J. Am. Chem. Soc. 61 (1939)1087. [6] E. Fischer, and Ber. Dtsch, Chem. Ges. 38 (1905) 2917. [7] Y. Iitaka, Acta Crystallogr. 11 (1958) 225. [8] M. Esthagu Peter,and P. Ramasamy, Spectrochim. Acta Part A. 75 (2010) 1417. [9] E. Ramachandran, K. Baskaran, and S. Natarajan, Cryst. Res. Technolgy. 42 (2007b) 73. [10] K. Srinivasan, and J. Arumugam, Opt. Mater. 30 (2007c) 40. [11] P.V. Dhanaraj, and N.P. Rajesh, Mater. Chem. and Phys. 15 (2009) 413. [12] M. Narayan Bhat, and S.M. Dharmaprakash, J. Cryst. Growth 236 (2002b) 376. [13] M. Narayan Bhat, and S.M. Dharmaprakash, J. Cryst. Growth 242 (2002c) 245. [14] N. Vijayan et.al., W.T.A. Harrison, J. Crystal Growth 262 (2004) 490. [15] S.K. Kurtz and T.T. Perry, J. Appl. Phys. 39 (1968) 3798. |