Paper Menu >>
Journal Menu >>
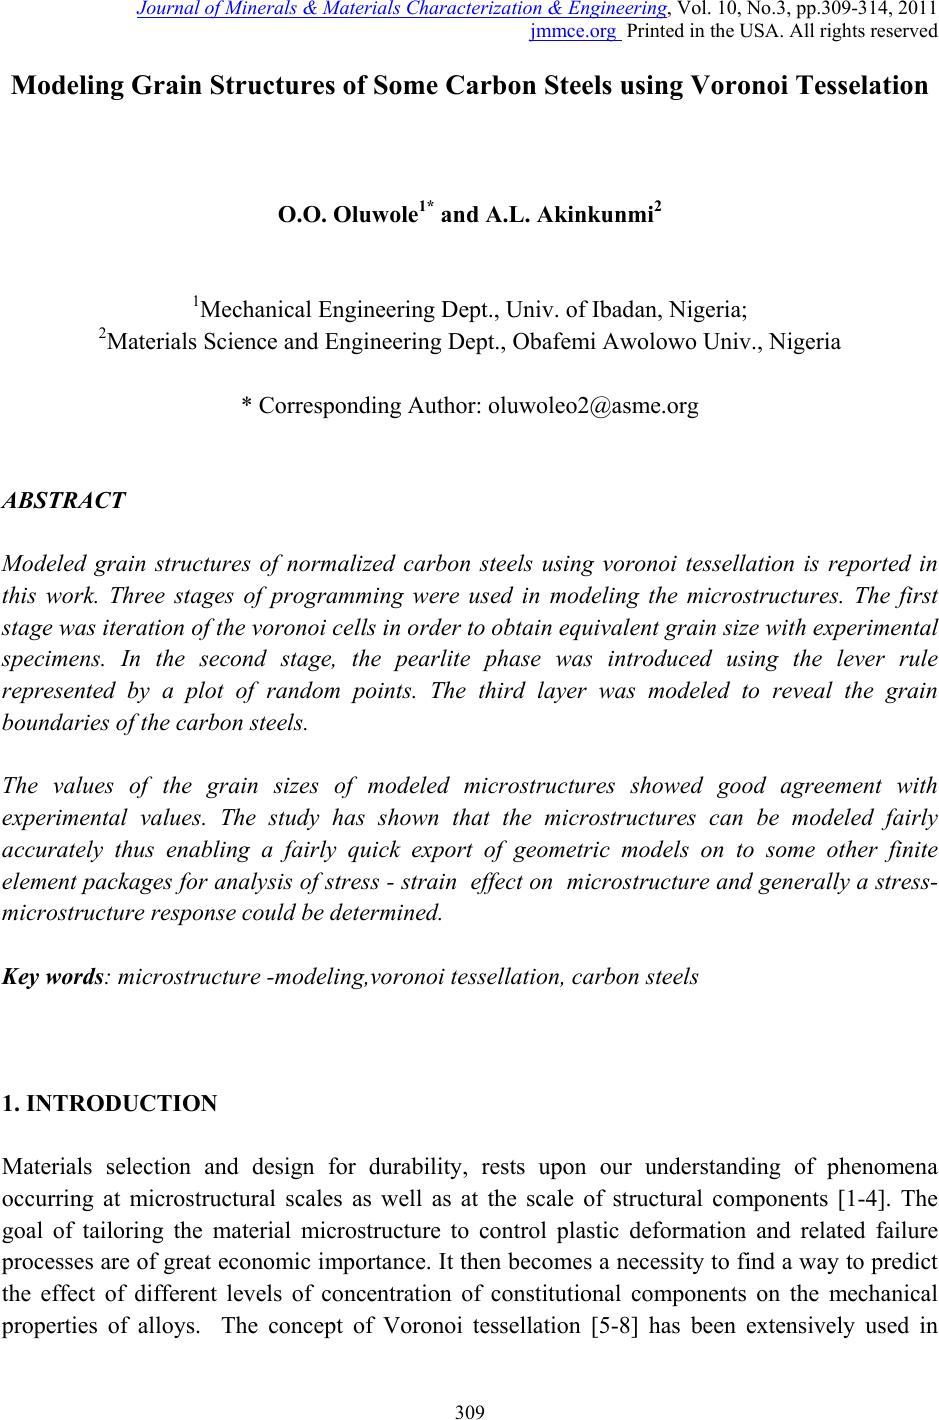 Journal of Minerals & Materials Characterization & Engineering, Vol. 10, No.3, pp.309-3 14, 2011 jmmce.org Printed in the USA. All rights reserved 309 Modeling Grain Structures of Some Carbon Steels using Voronoi Tesselation O.O. Oluwole1* and A.L. Akinkunmi2 1Mechanical Engineering Dept., Univ. of Ibadan, Nigeria; 2Materials Science and Engineering Dept., Obafemi Awolowo Univ., Nigeria * Corresponding Author: oluwoleo2@asme.org ABSTRACT Modeled grain structures of normalized carbon steels using voronoi tessellation is reported in this work. Three stages of programming were used in modeling the microstructures. The first stage was iteration of the voronoi cells in order to obtain equivalent grain size with experimental specimens. In the second stage, the pearlite phase was introduced using the lever rule represented by a plot of random points. The third layer was modeled to reveal the grain boundaries of the carbon steels. The values of the grain sizes of modeled microstructures showed good agreement with experimental values. The study has shown that the microstructures can be modeled fairly accurately thus enabling a fairly quick export of geometric models on to some other finite element packages for analysis of stress - strain effect on microstructure and generally a stress- microstructure response could be determined. Key words: microstructure -modeling,voronoi tessellation, carbon steels 1. INTRODUCTION Materials selection and design for durability, rests upon our understanding of phenomena occurring at microstructural scales as well as at the scale of structural components [1-4]. The goal of tailoring the material microstructure to control plastic deformation and related failure processes are of great economic importance. I t then become s a necessity to find a way to predict the effect of different levels of concentration of constitutional components on the mechanical properties of alloys. The concept of Voronoi tessellation [5-8] has been extensively used in 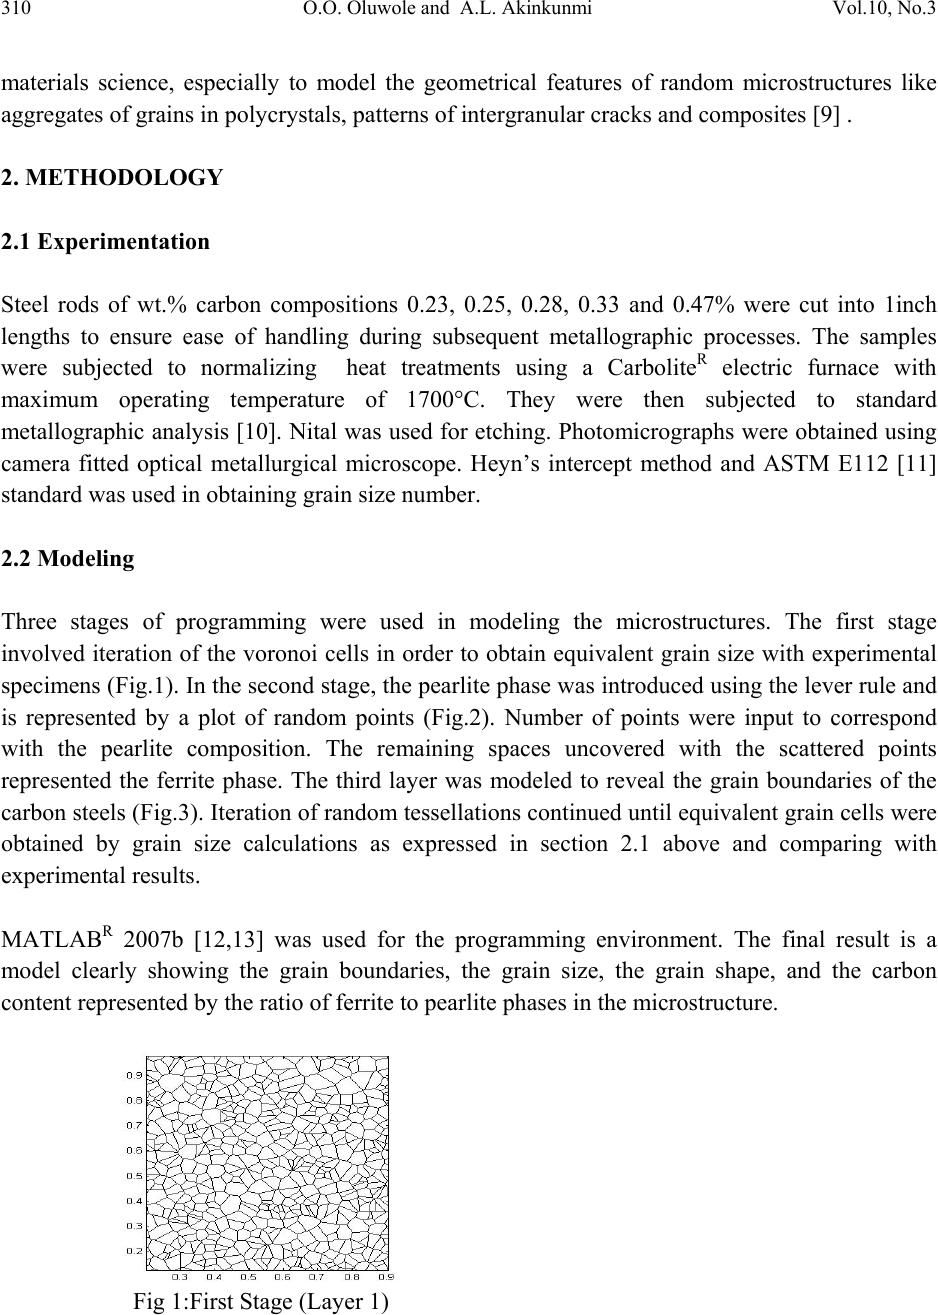 310 O.O. Oluwole and A.L. Akinkunmi Vol.10, No.3 materials science, especially to model the geometrical features of random microstructures like aggregates of grains in polycrystals, patterns of intergranular cracks and composites [9] . 2. METHODOLOGY 2.1 Experimentation Steel rods of wt.% carbon compositions 0.23, 0.25, 0.28, 0.33 and 0.47% were cut into 1inch lengths to ensure ease of handling during subsequent metallographic processes. The samples were subjected to normalizing heat treatments using a CarboliteR electric furnace with maximum operating temperature of 1700°C. They were then subjected to standard metallographic analysis [10]. Nital was used for etching. Photomicrographs were obtained using camera fitted optical metallurgical microscope. Heyn’s intercept method and ASTM E112 [11] standard was used in obtaining grain size number. 2.2 Modeling Three stages of programming were used in modeling the microstructures. The first stage involved iteration of the voronoi cells in order to obtain equivalent grain size with experimental specimens (Fig.1). In the second stage, the pearlite phase wa s introduced using the lever rule and is represented by a plot of random points (Fig.2). Number of points were input to correspond with the pearlite composition. The remaining spaces uncovered with the scattered points represented the ferrite phase. The third layer was modeled to reveal the grain boundaries of the carbon steels (Fig.3). Iteration of random tessellations continued until equivalent grain cells were obtained by grain size calculations as expressed in section 2.1 above and comparing with experimental results. MATLABR 2007b [12,13] was used for the programming environment. The final result is a model clearly showing the grain boundaries, the grain size, the grain shape, and the carbon content represented by the ratio of ferrite to pearlite phases in the microstructure. Fig 1:First Stage (Layer 1) 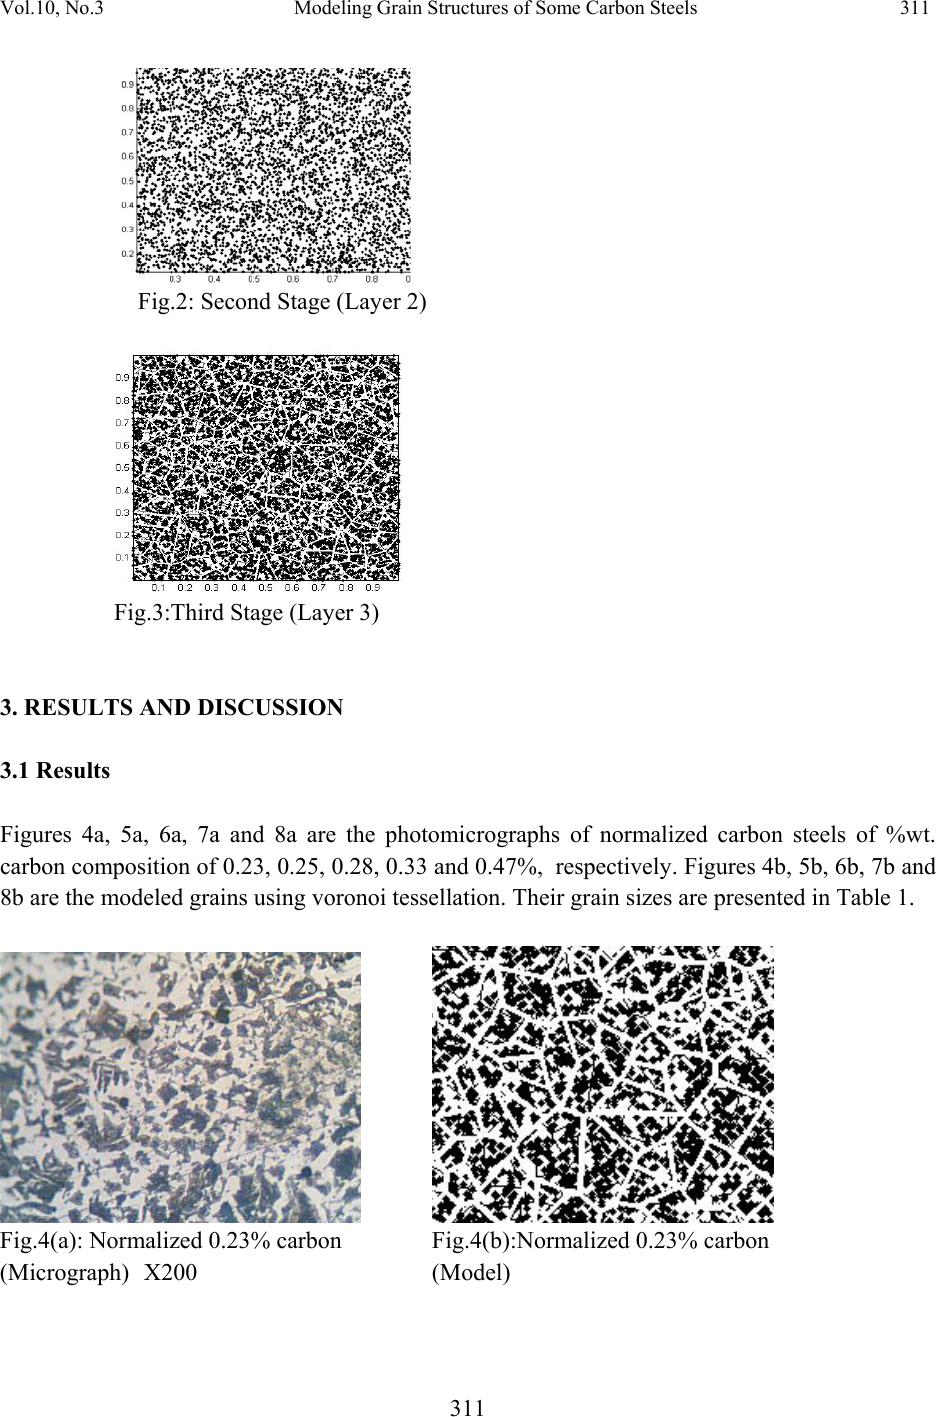 Vol.10, No.3 Modeling Grain Structures of Some Carbon Steels 311 311 Fig.2: Second Stage (Layer 2) Fig.3:Third Stage (Layer 3) 3. RESULTS AND DISCUSSION 3.1 Results Figures 4a, 5a, 6a, 7a and 8a are the photomicrographs of normalized carbon steels of %wt. carbon composition of 0.23, 0.25, 0.28, 0.33 and 0.47%, respectively. Figures 4b, 5b, 6b, 7b and 8b are the modeled grains using voronoi tessellation. Their grain sizes are presented in Table 1. Fig.4(a): Normalized 0.23% carbon Fig.4(b):Normalized 0.23% carbon (Micrograph) X200 (Model) 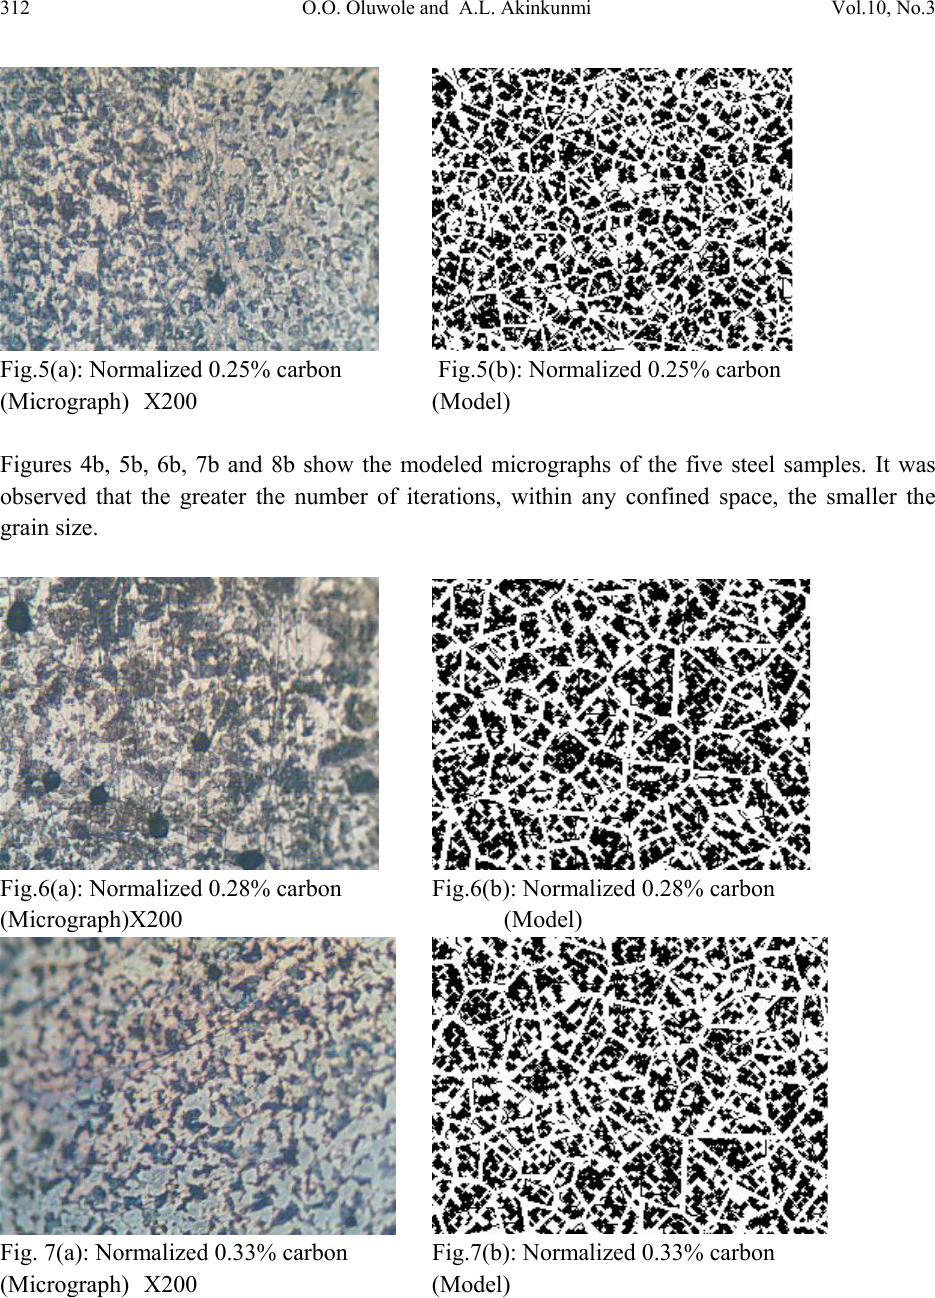 312 O.O. Oluwole and A.L. Akinkunmi Vol.10, No.3 Fig.5(a): Normalized 0.25% carbon Fig.5(b): Normalized 0.25% carbon (Micrograph) X200 (Model) Figures 4b, 5b, 6b, 7b and 8b show the modeled micrographs of the five steel samples. It was observed that the greater the number of iterations, within any confined space, the smaller the grain size. Fig.6(a): Normalized 0.28% carbon Fig.6(b): Normalized 0.28% carbon (Micrograph)X200 (Model) Fig. 7(a): Normalized 0.33% carbon Fig.7(b): Normalized 0.33% carbon (Micrograph) X200 (Model) 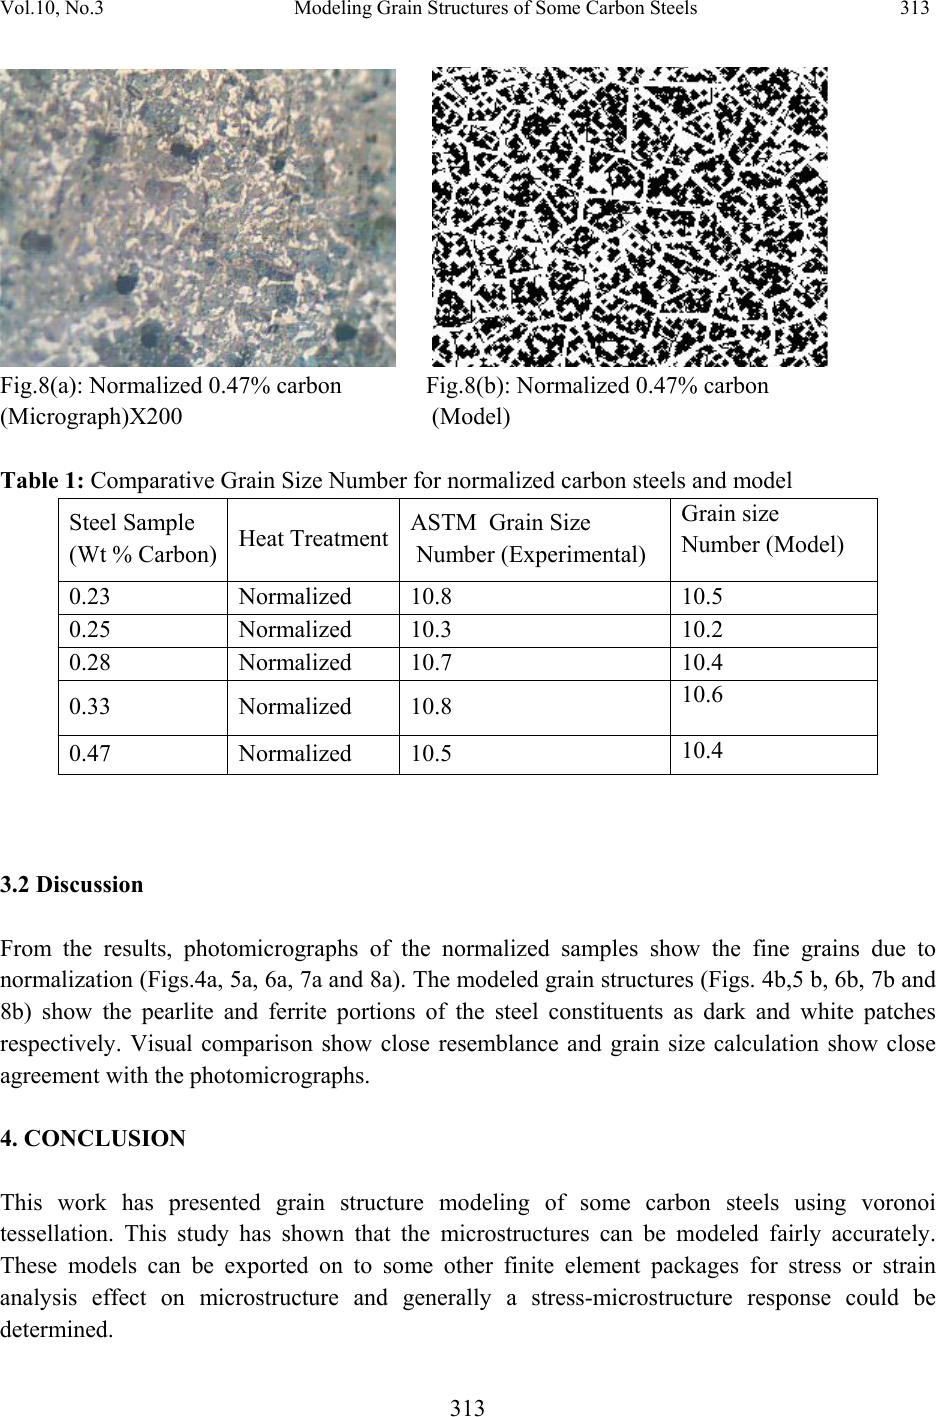 Vol.10, No.3 Modeling Grain Structures of Some Carbon Steels 313 313 Fig.8(a): Normalized 0.47% carbon Fig.8(b): Normalized 0.47% carbon (Micrograph)X200 (Model) Table 1: Comparative Grain Size Number for normalized carbon steels and model Steel Sample (Wt % Carbon) Heat TreatmentASTM Grain Size Number (Experimental) Grain size Number (Model) 0.23 Normalized 10.8 10.5 0.25 Normalized 10.3 10.2 0.28 Normalized 10.7 10.4 0.33 Normalized 10.8 10.6 0.47 Normalized 10.5 10.4 3.2 Discussion From the results, photomicrographs of the normalized samples show the fine grains due to normalization (Figs.4a, 5a, 6a, 7a and 8a). The modeled grain structures (Figs. 4b,5 b, 6b, 7b and 8b) show the pearlite and ferrite portions of the steel constituents as dark and white patches respectively. Visual comparison show close resemblance and grain size calculation show close agreement with the photomicrographs. 4. CONCLUSION This work has presented grain structure modeling of some carbon steels using voronoi tessellation. This study has shown that the microstructures can be modeled fairly accurately. These models can be exported on to some other finite element packages for stress or strain analysis effect on microstructure and generally a stress-microstructure response could be determined.  314 O.O. Oluwole and A.L. Akinkunmi Vol.10, No.3 REFERENCES [1] Reed-Hill, R.E., (1973) Physical Meta l lurgy Principles, 2nd ed., Van Nostrand [2] Makinamuhendisi (2008) ‘Low Carbon steel’ http://www.makinamuhendisi.com / mechanical / mechanical-engineering-archives/176-Low-Carbon-Steels-Mild-Steel.html [3] Key-to-steel (2008) Hardenable Carbon Steels http://www.key-to- steel.com/ViewArticle.asp?ID=90 [4] Wikepedia(2008) ‘Carbon Steels’ http://en.wikipedia.org/wiki/Carbon_steel [5] JSTOR SIAM (1999 ) Generating Voronoi Tesselations’ JSTOR SIAM Review, 41( 4), 637-676. [6] Arwade, S. R., 2000, Probabilistic Models for Aluminum Microstructures and Intergranular Fracture Analysis, Masters Thesis, Cornell University. [7] Sinum (2006)Lloyd algorithm for computing CVTs. http://www.math.psu.edu/qdu/Res/Pre/dmj06sinum.pdf [8] JSTOR(2008)‘Centroidal voronoi tessellations’. [9] Qiang Du, Vance Faber and Max Gunzburger, (1999) Centroidal Voronoi Tessellations: Applications and Algorithms, Society for Industrial and Applied Mathematics. [10]Oluwole, O.O., D.T. Oloruntoba, and O. Awheme. (2008) "Effect of Zinc Plating of Low Carbon Steel on Corrosion Resistance in Cocoa Fluid Environment". Materials and Design, 29(6):1266-1274. [11]Singh.V (2005) ‘Physical Metallurgy’ Standard Publishers, New-Delhi,p.493-497 [12]Higham.D.J and N.J. Higham (2000) Matlab Guide SIAM Philadelphia. [13]Mathwork (2004) Introduction: What is Matlab? Matlab Help File, Mathwork, Inc.USA |