Paper Menu >>
Journal Menu >>
 Journal of Mine ra ls & Materials Characteri za ti o n & Engineering, V ol. 10, No.3, pp. 257-266, 2011 jmmce.org Printed in the USA. All rights reserved 257 Effect of Silicon Content and Shake-Out Time on Hardness and Grain Size Properties of GL 250 Cast Iron P. Atanda 1, G. Oluwadare 2 and O. Oluwole *3 1Materials Science and Engineering Dept.,Obafemi Awolowo University, Nigeria 2Industrial Chemistry Department,Bells University, Nigeria. 3Mechanical Engineering Dpartment,University of Ibadan, Nigeria *Corresponding Author:oluwoleo2@asme.org ABSTRACT The properties of cast iron grade GL 250 are dependent on the microstructures developed during casting. These microstructures are in turn dependent on the composition of the alloy, type of mould and other numerous casting practice variables such as shake-out time, pouring temperature, mould ambient conditions and inoculating technique. In this work, the effect of silicon content and shake-out time on the grain size (GS) and hardness properties of GL 250 cast iron was studied using a pouring temperature of 14000C and sand mould casting. Using charge materials consisting of pig iron and other additives, GL 250 castings containing silicon contents of 1.7, 2.1 and 2.7% were casted using a constant pouring temperature of 14000C, molding sand of specified properties and ambient mould temperature of 320C. Results showed that type A flake type was obtained at 30mins shakeout time for all samples for the C.I composition under study. Increasing shake-out time decreased hardness and increased carbide grain size. Increasing silicon content was observed to increase grain size and reduce free graphite but with resultant decrease in hardness. Two mathematical relationships were derived. One related grain-size to silicon content and shakeout time while the second related Brinnel Hardness to Silicon content and shake-out time. They are: Grain Size=0.40 Si+0.17Shake-out Time-0.15 and BHN=-60.53Si-7.15Shake-out Time+329.35 at 14000C pouring temperature in a molding sand of specified properties and sand mould ambient temperature of 320C. Keywords: Shake-out time; Silicon content; Hardness; Grain-Size; GL 250 C.I  258 P. Atanda, G. Oluwadare and O. Oluwole Vol.10, No.3 1. INTRODUCTION Cast irons are widely used today in every sphere of life. Cast iron is an iron alloy characterized by its relatively high carbon content (usually 2% to 4%).When molten cast iron solidifies some of the carbon pr ecipi tates as gr aphite, f or ming tiny , irregular flak es with in the crystal stru cture of the metal (Walton,1958). While the graphite enhances the desirable properties of cast iron, the flakes disrupt the crystal structure and precipitate cracks, leading to cast iron's characteristic brittleness. White cast iron, gray cast iron and ductile iron are still massively in use today. In nodular cast iron the disadvantage opened up by free flakes in the cast matrix have been overcome, the free flakes having been nodularized with magnesium, or cerium and recent developments show that cheaper nodularization could be made with a combination of magnesium and calcium [1,2]. Gray iron is the most widely used, with annual production several times total of all other cast metals. It has excellent machinability, good wear resistance, and high vibration absorption [3]. Gray iron is valued particularly for its ability to be cast into complex shapes at relatively low cost. Thus, its application includes: sanitary wares, household appliances, rolling mill and general machinery parts, ingot moulds, cylinder blocks and heads for I.C. engines, frames for electric motors, machine tool structures, etc. [4]GL 250 grade of cast iron (or ASTM A-247 or DIN 1671) is a grade of grey iron with type A4-A7 graphite flakes having uniform distribution and apparent random orientation [5]. Mould material, inoculation, and shake-out time are some of the casting variables that affect the grain size of the as cast product. This work focused on the effect of shake-out time on hardness and grain size properties of GL 250 cast iron. 2. MATERIALS AND METHODS 2.1 Materials 2.1.1 Charge composition for GL 250 cast iron The GL 250 Cast iron was cast from starting materials with composition as shown below in Table 1. Melting was done using a coreless induction furnace of 250kg capacity and power rating of 250kw/1000Hz. After melting the spectrometric analysis of the melt was obtained and is presented in Table 2. 2.1.2 Innoculant Ferrosilicon was used as innoculant; introduced into the melt just before tapping of the liquid metal. 100g innoculant was used for every 250kg ladle.  Vol.10, No.3 Effect of Silicon Content and Shake-Out Time 259 259 Table 1: Material Charge Composition Material Composition C Si Mn P S Cu Sn Pig iron 4.0 2.2 0.8 0.9 0.8 - - Cropped Ends From rolling mill 0.23 0.2 0.5 - - 0.3 - Foundry Returns 2.9 2.9 0.9 - - 0.3 0.04 Carburizer 99.3 0.1 - - - - - Ferrosilicon 0.1 75.0 - - - - - Ferro- manganese 0.1 - 75.0 - - - - Copper - - - - - 99.1 - Tin - - - - - - 99.1 Table 2: Spectrometric Analysis of As-Cast GL250 Cast Iron Composition C Si Mn P S Cu Sn 3.3 2.1 0.68 0.09 0.09 0.25 0.05 2.1.3 Moulding sand Moulding sand used comprised of Nigerian moulding sand mixtures ( 70% Igbokoda and 30% Basita sands). The moulding sand was subjected to standard tests: Sand finess number (AFS), Permeability, Mould Strength, Moisture Content, Clay Content, Shatter Index and Sand Strength Tests. The results are presented in Table 3 . 2.2 Method 2.2.1 Casting Five sand moulds of auto flywheels were made using a Peugeot 504 auto flywheel, giving the flywheel some rapping for ease of removal from the moulds. The charge materials were then input into a 250kg capacity coreless induction furnace for melting. Just before tapping, ferrosilicon was added as innoculant. Innoculation is believed to have important effect on the formation of graphite nuclei during solidification, thus influencing the resulting structure and  260 P. Atanda, G. Oluwadare and O. Oluwole Vol.10, No.3 strength of casting[4,6]. The metal was poured into the five moulds and left for 12 mins, 30 mins, 1hr, 5hrs and 10hrs before shake-out. This procedure was repeated for melts having silicon contents of 1.7%, and 2.7%. Pouring temperature was fixed at 14000C. Specimens from the castings were then prepared for microstructureobservation. Table 3: Results of Tests on Moulding Sand AFS Permeab ility Mould Strength (N/m2) Moisture Content (%) Clay Content Shatter Index Sand Strength (KN/m2) Green comp Green Shear Dry Comp Dry Shear 62 125 80 3.0 1.5 85 112 38 660 370 2.2.2 Metallographic examination Specimens were prepared for metallographic examination by using standard grinding and polishing methods [7-12]. Polished and etched samples were observed under an optical microscope with camera attachment at X100 magnification to assess the microstructure developed in the casting with varying shake-out times; the type of carbides and graphite flakes formed and the grain size of the carbides. Photomicrographs of the observed microstructures were taken. The linear intercept method for grain size measurement was employed. Flake type was obtained using AFA and ASTM graphite flakes classification [13]. 2.2.3 Hardness measurement Brinnel hardness tests were carried out on samples of the castings. 3. RESULTS AND DISCUSSION 3.1 Results Optical micrographs of Cast Iron containing 1.7% , 2.1% and 2.7% Si for shake-out times of 12 mins, 30 mins, 1hr, 5 and 10 hrs are presented in Figure1. It was observed that there was less free graphite with increasing silicon content. Grain size was observed to increase as well with increasing silicon content.  Vol.10, No.3 Effect of Silicon Content and Shake-Out Time 261 261 A(Type B graphite) F(Type A graphite) K(Type B graphite) B(Type A graphite) G(Type A graphite) L(Type A graphite) C(Type D graphite) H(Type C graphite) M(Type C graphite) D(Type D graphite) I(Type C graphite) N(Type C graphite) E(Type E graphite) J(Type E graphite) O(Type D graphite) Fig.1: Optical micrographs of GL 250 cast in sand mould. Pouring Temperature-14000C X100 A-E-Cast Iron containing1.7% Si. (A=12mins,B=30mins,C=1hr,D=5hrs,E=10hrs) F-J-Cast iron containing 2.1%Si (F=12,G=30mins,H=1hr,I=5hrs,J=10hrs) K-O -Cast iron containing 2.7%Si (K=12,L=30mins,M=1hr,N=5hrs,O=10hrs) 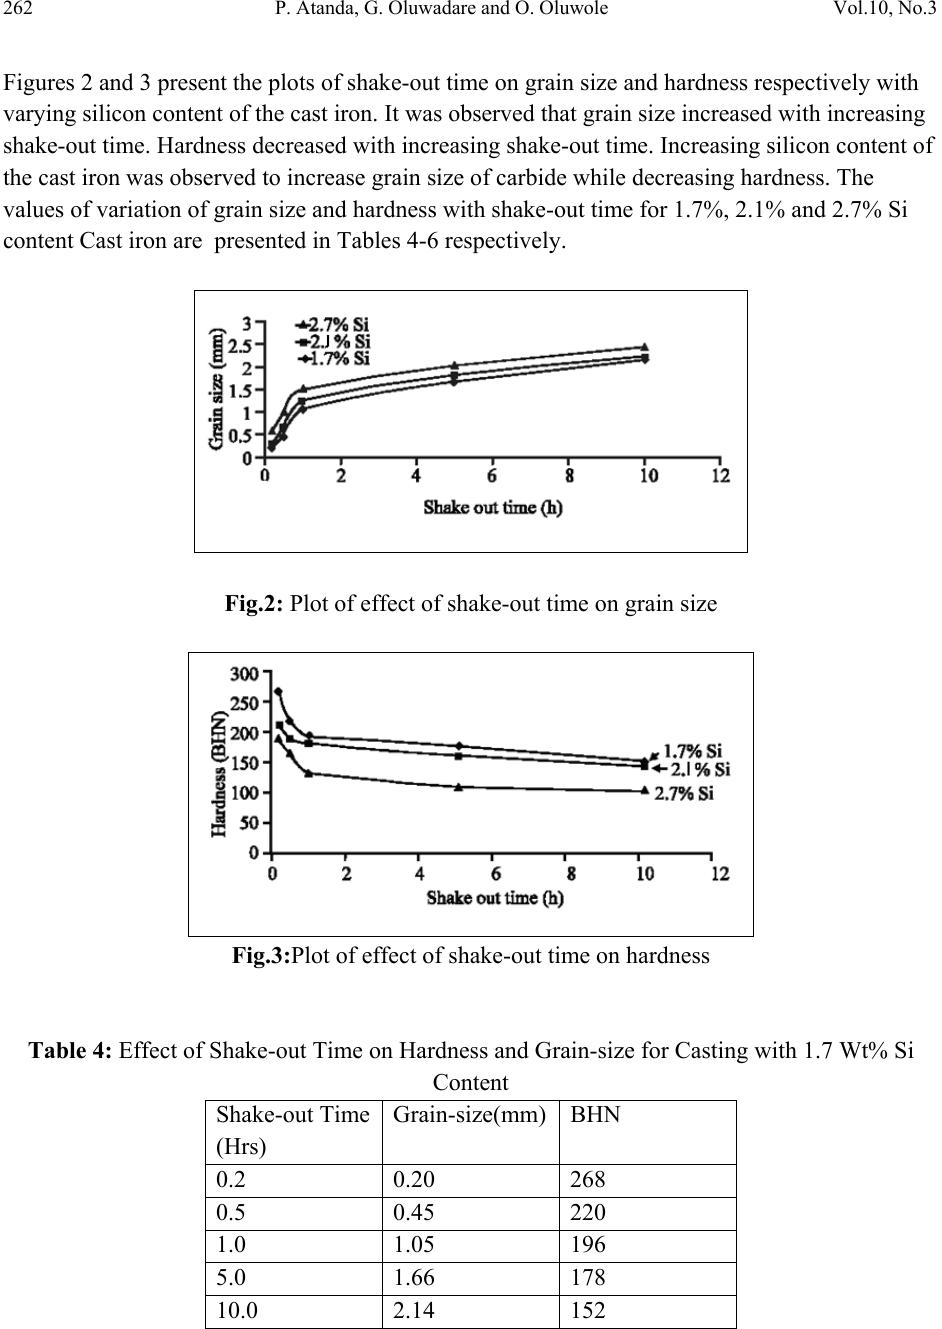 262 P. Atanda, G. Oluwadare and O. Oluwole Vol.10, No.3 Figures 2 and 3 present the plots of shake-out time on grain size and hardness respectively with varying silicon content of the cast iron. It was observed that grain size increased with increasing shake-out time. Hardness decreased with in c r e a sing shake-out time. Increasing silicon content of the cast iron was observed to increase grain size of carbide while decreasing hardness. The values of variation of grain size and hardness with shake-out time for 1.7%, 2.1% and 2.7% Si content Cast iron are presented in Tables 4-6 respectively. Fig.2: Plot of effect of shake-out time on grain size Fig.3:Plot of effect of shake-out time on hardness Table 4: Effect of Shake-out Time on Hardness and Grain-size for Casting with 1.7 Wt% Si Content Shake-out Time (Hrs) Grain-size(mm) BHN 0.2 0.20 268 0.5 0.45 220 1.0 1.05 196 5.0 1.66 178 10.0 2.14 152 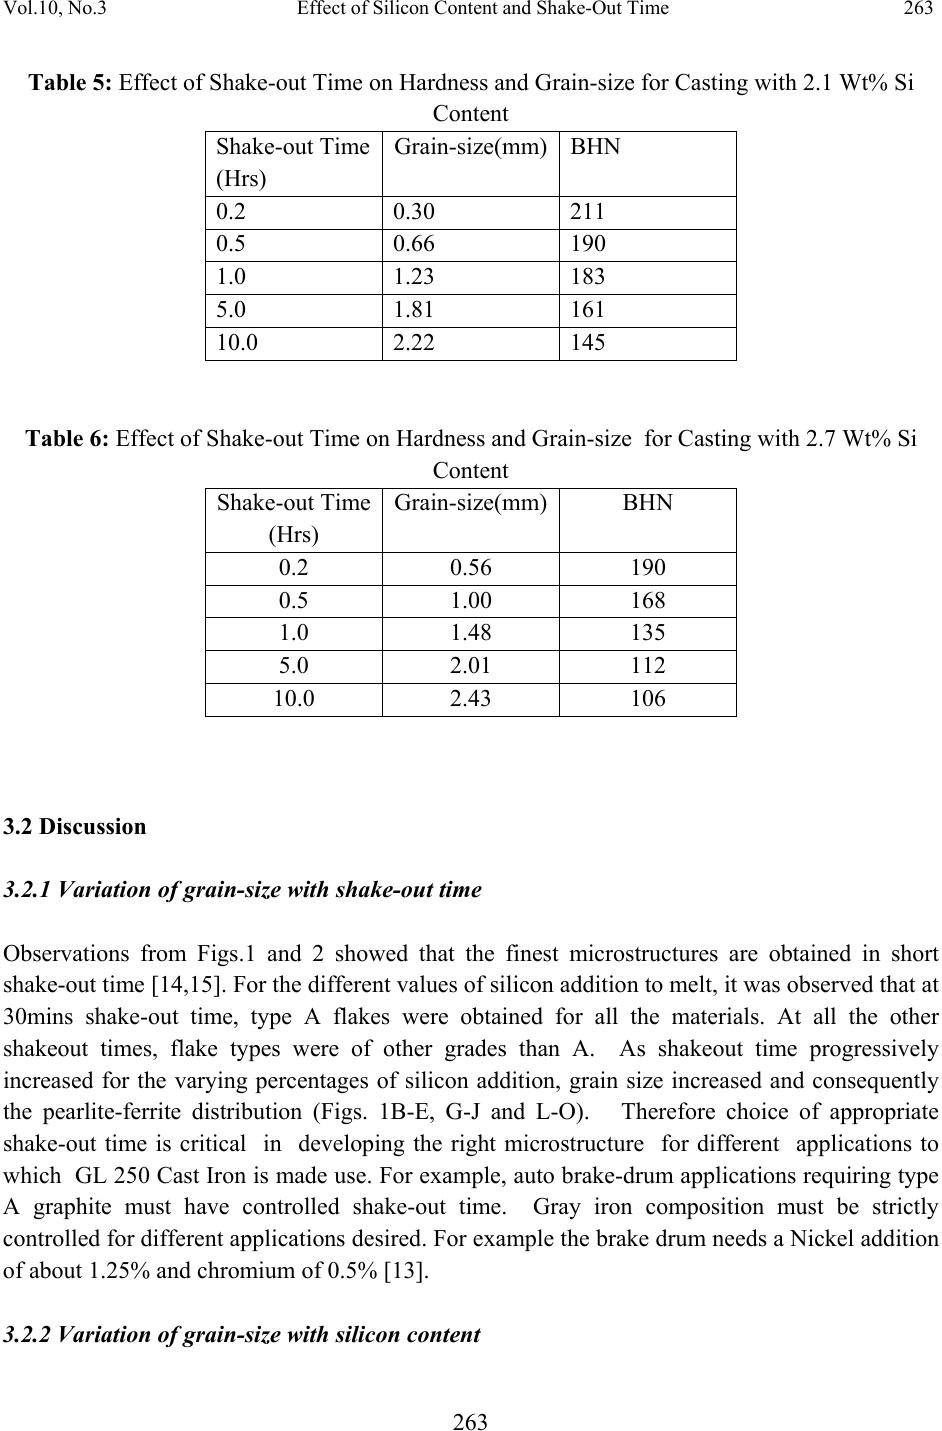 Vol.10, No.3 Effect of Silicon Content and Shake-Out Time 263 263 Table 5: Effect of Shake-out Time on Hardness and Grain-size for Casting with 2.1 Wt% Si Content Shake-out Time (Hrs) Grain-size(mm)BHN 0.2 0.30 211 0.5 0.66 190 1.0 1.23 183 5.0 1.81 161 10.0 2.22 145 Table 6: Effect of Shake-out Time on Hardness and Grain-size for Casting with 2.7 Wt% Si Content Shake-out Time (Hrs) Grain-size(mm)BHN 0.2 0.56 190 0.5 1.00 168 1.0 1.48 135 5.0 2.01 112 10.0 2.43 106 3.2 Discussion 3.2.1 Variation of grain-size with shake-out time Observations from Figs.1 and 2 showed that the finest microstructures are obtained in short shake-out time [14,15]. For the different values of silicon addition to melt, it was observed that at 30mins shake-out time, type A flakes were obtained for all the materials. At all the other shakeout times, flake types were of other grades than A. As shakeout time progressively increased for the varying percentages of silicon addition, grain size increased and consequently the pearlite-ferrite distribution (Figs. 1B-E, G-J and L-O). Therefore choice of appropriate shake-out time is critical in developing the right microstructure for different applications to which GL 250 Cast Iron is made use. For example, auto brake-drum applications requiring type A graphite must have controlled shake-out time. Gray iron composition must be strictly controlled for different applications desired. For example the brake drum needs a Nickel addition of about 1.25% and chromium of 0.5% [13]. 3.2.2 Variation of grain-size with silicon content  264 P. Atanda, G. Oluwadare and O. Oluwole Vol.10, No.3 Grain size was observed to increase with increasing silicon content of melt. Grain size in Fig. 1B was smaller than Fig.1G which was also smaller than Fig.1 L . The same was observed in Figs. 1 C, H and M. Grain size of 1 D< 1I<1N and Grain size of 1E<1J<1O. These are also observed in Fig.2. 3.2.3 Variation of hardness with shake-out time The hardness property of the casting was observed to follow an inverse relationship with increase in shake-out time (Fig.3). With increasing silicon content of casting, hardness was observed to decrease as well (Fig. 3) 3.2.4 Variation of hardness with shake-out time and silicon content From Tables 4, 5 and 6 it was observed that increase in grain-size led to a decrease in hardness of the casting for all the values of silicon content used in the casting. It was also observed that hardness decreased with increasing silicon content of the cast iron. 3.2.5 Derivation of equation relating shake-out time to silicon content, grain-size and hardness properties of GL 250 cast iron using moulding sand and pouring temperature of 14000C. The parameters varied; shake-out time and silicon content and the measured properties; grain size and hardness were linked up with shake-out time in two predictive equations by using multiple regression analysis. Microsoft excel was used in the regression analysis. Placing Grain- size and Brinnel Hardness as unknowns, with two known values-silicon content, and shake-out time two equations were obtained as given: Grain Size=0.40 Si+0.17Shake-out Time-0.15 BHN=-60.53Si-7.15Shake-out Time+329.35 With these equations, shake-out time could be determined with preset Grain size or Brinnel Hardness. Combining both equations give: Shake-outTime=6.85Grain-size-0.017Si+0.045BHN-13.19 4. CONCLUSION In this work, the effect of silicon content and shake-out time on the grain size(GS) and hardness properties of GL 250 cast iron was studied.  Vol.10, No.3 Effect of Silicon Content and Shake-Out Time 265 265 The results showed that increasing shake-out time decreased hardness and increased carbide grain size. Increasing silicon content was observed to increase grain size and reduce free graphite but with resultant decrease in hardness. Thus, grain size of carbide and hardness are both dependent on silicon content of the melt. Therefore, a particular shake-out time and silicon content can be chosen that will give desired carbide grain size and hardness for specified application material. However, graphite flake type A was obtained at 30 mins shakeout time for all samples. Two mathematical relationships were derived. One related grain-size to silicon content and shakeout time while the second related Brinnel Hardness to Silicon content and shake-out time at a pouring temperature of 14000C using moulding sand of specified properties. They are: Grain Size=0.40 Si+0.17Shake-out Time-0.15 and BHN=-60.53Si-7.15Shake-out Time+329.35 Shake-out time can be predicted using this equation if the specified pouring temperature and moulding sand properties are adhered to. Otherwise, any change in mould propertries will affect cooling rate, hence carbide grain-size. It is necessary for foundries to determine applicable relationship for their operating conditions. Combining both equations give: Shake- outTime=6.85Grain-size-0.017Si+0.045BHN-13.19 REFERENCES [1] Imasogie.B.I and Wendt.U(2004) ‘Characterisation of graphite particle shape in spheroidal graphite iron using a computer based analyser’ JMMCE,3(1),1-12 [2] Oluwole, O.O, Olorunniwo, O.E.,Ogundare, O.O., Atanda P.O. and Oridota, O.O., (2007) ‘Effect Of Magnesium And Calcium As Spheroidizers On The Graphite Morphology In Ductile Cast Iron’ JMMCE, 6(1),25-37 [3] Walton, C.F. (1958}, Iron casting Handbook, 3rd edition, published by Iron castings society , Incorporated [4] Krause.D.E(1969) ‘Grey iron-A unique Engineering Material’ ASTM Special Technical Publication., Pholadelphia.Pp. 3-28 [5] Walton C.F and Opar T.J. (1981): “Iron casting handbook covering data on Grey, Malleable and ductile iron, Iron casting Society Inc. New York [6] Ziegler.R(1964) ‘Investigation of the influence of nucleation stage of grey iron with graphite flake’Scweizer Archives, Jan Edtn.,p.4 [7] Kehl, G. L. (1949)The Principles of Metallographic Laboratory Practice. (3rd edition). McGraw-Hill, New York, Toronto, London. [8] Hughes, K.V.(1994) Practical Microscopical Metallography. University of Missouri Extension, Columbia Publication. [9] Brandon, D. G. (1966)Modern Techniques in Metallography. Butterw orths, London.  266 P. Atanda, G. Oluwadare and O. Oluwole Vol.10, No.3 [10] Greaves, R. H. & H. Wrighton(1960) Practical Microscopical Metallography (4th Edition). Chapman and Hall, London. [11] Fujita N. and Bhadeshia H. K. D. H.(1999) Mater. Sci. Tech., 15: 627 – 634. [12] Fawole, M.O. and Oso, B.A (2001). The Principles of Metallographic Laboratory Practice. Spectrum Books Ltd, Ibadan, Nigeria. [13] Singh.V(2005) ‘Pysical Metallurgy’ Standard Publishers’ p.459-462 [14] Flin. R.(1963) ‘Fundamentals of Metal Casting’Addison-Lee, New-York [15] Jain.P.L(1997)Principles of Foundry Technology’Tata McGraw-Hill, India. |