Paper Menu >>
Journal Menu >>
 Journal of Minerals & Materials Characterization & Engineering, Vol. 10, No.1, pp.49-57, 2011 jmmce.org Printed in the USA. All rights reserved 49 Growth and Characterization of L-glutamic Acid Hydro Chloro Bromide, A New Nonlinear Optical Material S. Kumararamana, K. Ki r ub a v at hib, K. Selvarajuc,* a Department of Physics, Nehru Memorial College, Puthanampatti-621 007, India b Department of Physics, Govt. Arts College for Women, Kumbakonam-612 001, India c Department of Physics, Govt. Arts College, Ariyalur-621 713, India *Corresponding Author: selsphy@yahoo.com, selvaraju17@rediffmail.com ABSTRACT The influence of mixed acids in the growth and characteristic properties of a nonlinear optical material L-glutamic acid hydro chloro bromide abbreviated as LGAHCB was examined. Single crystal X-ray diffraction analysis was used to calculate the lattice parameters of the crystals. Fourier transform infrared spectroscopies were performed to study the molecular vibrations of the grown crystal. The optical transmission spectrum shows very low absorption in the entire visible region. The powder second harmonic generation efficiency of LGAHCB is 1.5 times efficient as potassium dihydrogen phosphate (KDP). Key words: Growth from solution; Single crystal X-ray diffraction; Infrared spectrum; Nonlinear optical materials 1. INTRODUCTION Nonlinear optics is concerned with the interaction of electromagnetic fields with various media to produce new electromagnetic fields altered in phase, frequency and amplitude from the incident fields. Second harmonic generation (SHG) is an example of second order nonlinear optical (NLO) process [1,2]. Nonlinear optical materials are capable of producing higher values of the original frequency and hence this phenomenon can find application in optical modulation, fiber optic communication and opto-electronics [3]. In the last decades, many researchers have tried to find varieties of new NLO materials for laser applications [4,5] . 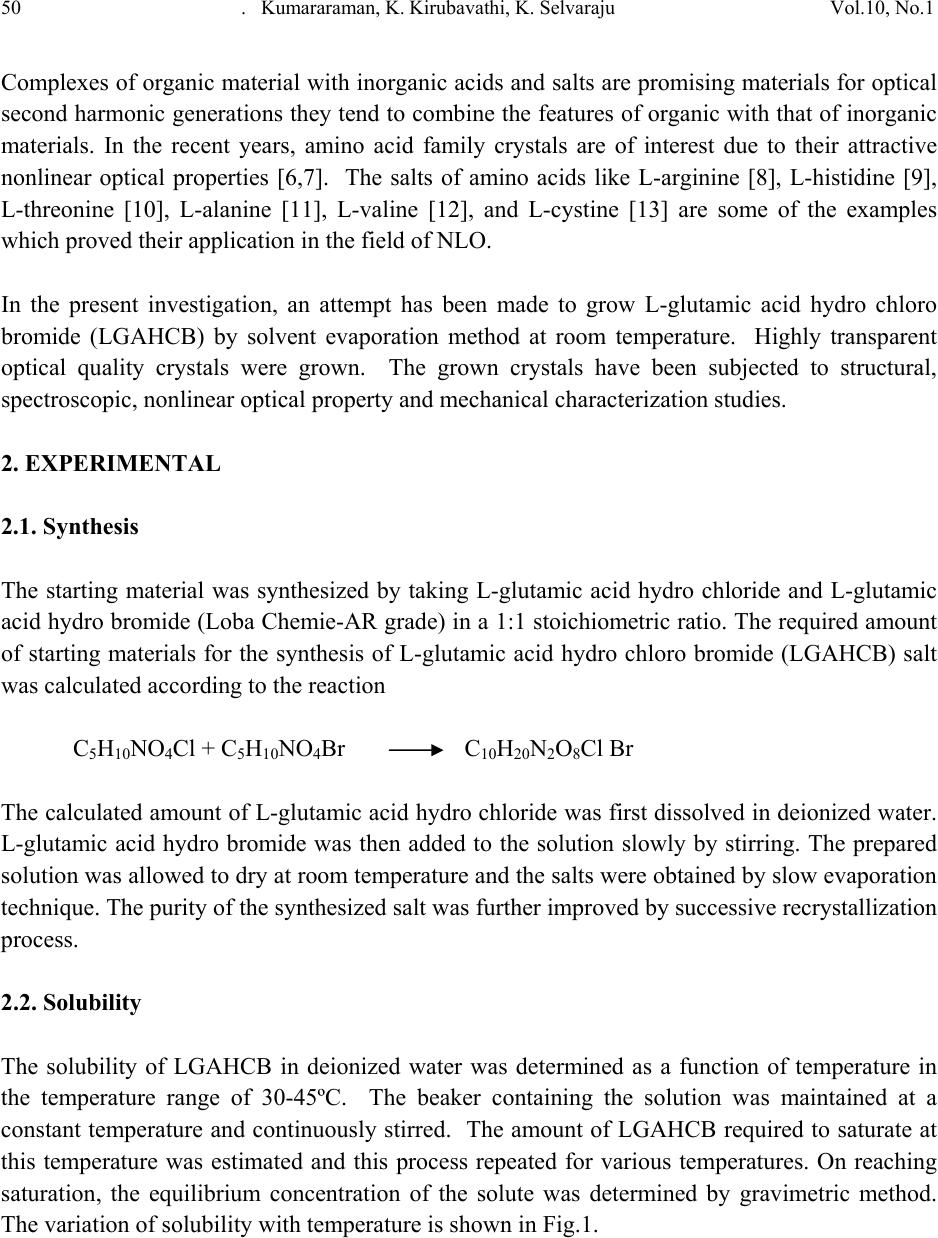 50 . Kumararaman, K.Kirubavathi, K. Selvaraju Vol.10, No.1 Complexes of organic material with inorganic acids and salts are promising materials for optical second harmonic generations they tend to combine the features of organic with that of inorganic materials. In the recent years, amino acid family crystals are of interest due to their attractive nonlinear optical properties [6,7]. The salts of amino acids like L-arginine [8], L-histidine [9], L-threonine [10], L-alanine [11], L-valine [12], and L-cystine [13] are some of the examples which proved their application in the field of NLO. In the present investigation, an attempt has been made to grow L-glutamic acid hydro chloro bromide (LGAHCB) by solvent evaporation method at room temperature. Highly transparent optical quality crystals were grown. The grown crystals have been subjected to structural, spectroscopic, nonlinear optical property and mechanical characterization studies. 2. EXPERIMENTAL 2.1. Synthesis The starting material was synthesized by taking L-glutamic acid hydro chloride and L-glutamic acid hydro bromide (Loba Chemie-AR grade) in a 1:1 stoichiometric ratio. The required amount of starting materials for the synthesis of L-glutamic acid hydro chloro bromide (LGAHCB) salt was calculated according to the reaction C 5H10NO4Cl + C5H10NO4Br C10H20N2O8Cl Br The calculated amount of L-glutamic acid hydro chloride was first dissolved in deionized water. L-glutamic acid hydro bromide was then added to the solution slowly by stirring. The prepared solution was allowed to dry at room temperature and the salts were obtained by slow evaporation technique. The purity of the synthesized salt was further improved by successive recrystallization process. 2.2. Solubility The solubility of LGAHCB in deionized water was determined as a function of temperature in the temperature range of 30-45ºC. The beaker containing the solution was maintained at a constant temperature and continuously stirred. The amount of LGAHCB required to saturate at this temperature was estimated and this process repeated for various temperatures. On reaching saturation, the equilibrium concentration of the solute was determined by gravimetric method. The variation of solubility with temperature is shown in Fig.1. 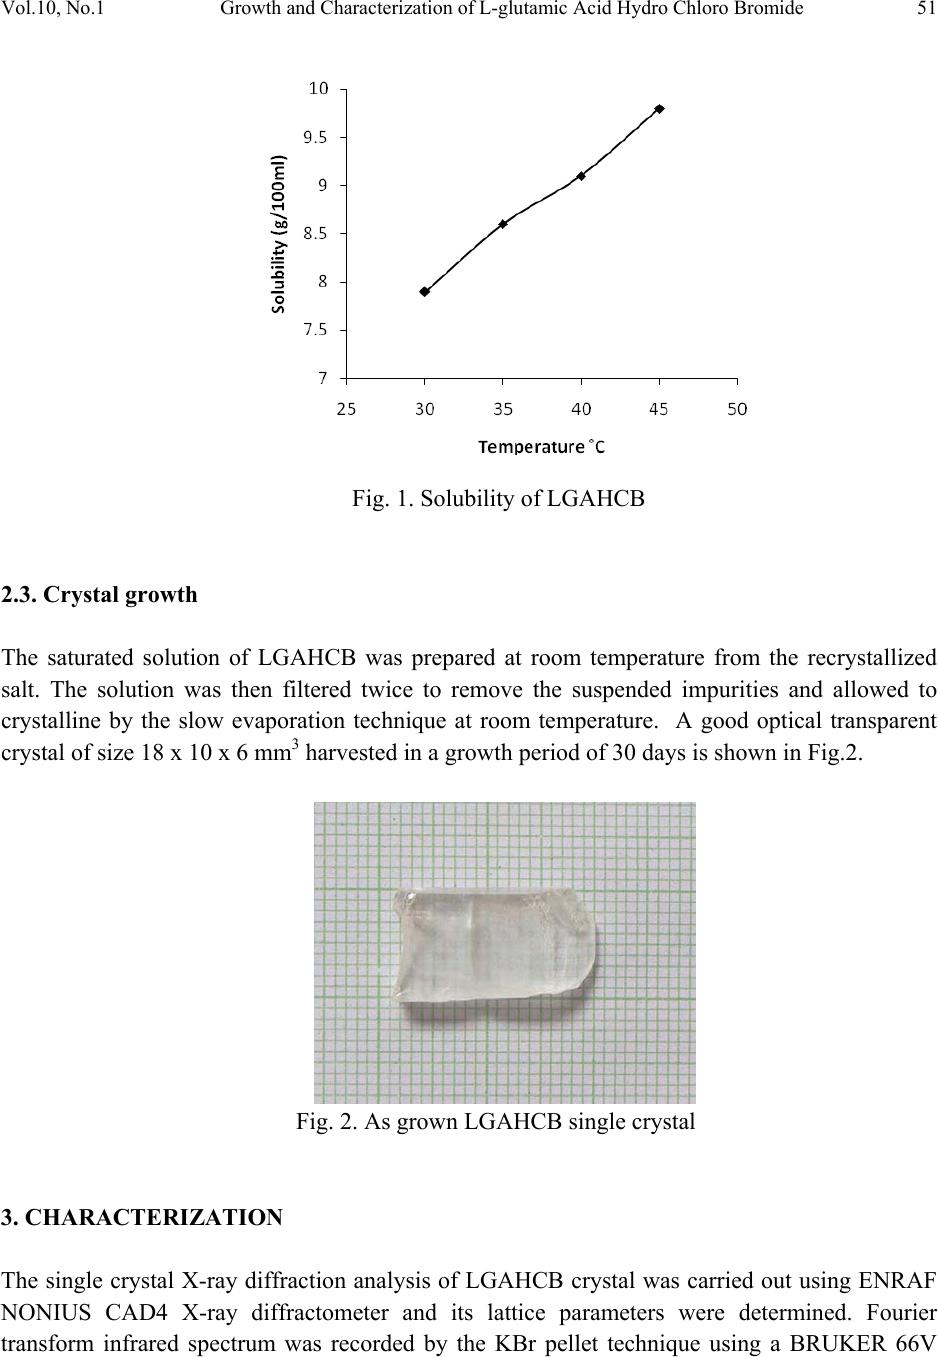 Vol.10, No.1 Growth and Characterization of L-glutamic Acid Hydro Chloro Bromide 51 Fig. 1. Solubility of LGAHCB 2.3. Crystal growth The saturated solution of LGAHCB was prepared at room temperature from the recrystallized salt. The solution was then filtered twice to remove the suspended impurities and allowed to crystalline by the slow evaporation technique at room temperature. A good optical transparent crystal of size 18 х 10 х 6 mm3 harvested in a growth period of 30 days is shown in Fig.2. Fig. 2. As grown LGAHCB single crystal 3. CHARACTERIZATION The single crystal X-ray diffraction analysis of LGAHCB crystal was carried out using ENRAF NONIUS CAD4 X-ray diffractometer and its lattice parameters were determined. Fourier transform infrared spectrum was recorded by the KBr pellet technique using a BRUKER 66V 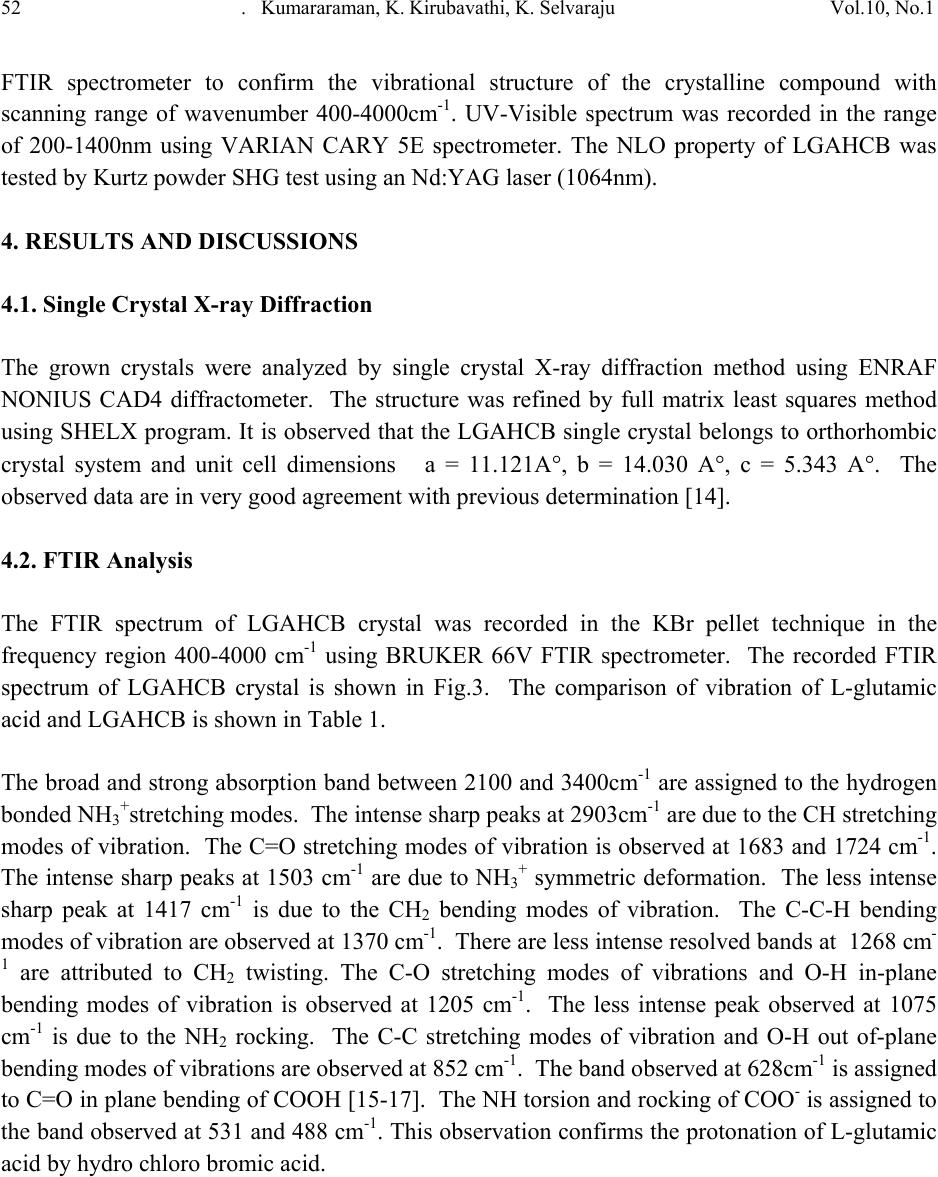 52 . Kumararaman, K.Kirubavathi, K. Selvaraju Vol.10, No.1 FTIR spectrometer to confirm the vibrational structure of the crystalline compound with scanning range of wavenumber 400-4000cm-1. UV-Visible spectrum was recorded in the range of 200-1400nm using VARIAN CARY 5E spectrometer. The NLO property of LGAHCB was tested by Kurtz powder SHG test using an Nd:YAG laser (1064nm). 4. RESULTS AND DISCUSSIONS 4.1. Single Crystal X-ray Diffraction The grown crystals were analyzed by single crystal X-ray diffraction method using ENRAF NONIUS CAD4 diffractometer. The structure was refined by full matrix least squares method using SHELX program. It is observed that the LGAHCB single crystal belongs to orthorhombic crystal system and unit cell dimensions a = 11.121A°, b = 14.030 A°, c = 5.343 A°. The observed data are in very good agreement with previous determination [14]. 4.2. FTIR Analysis The FTIR spectrum of LGAHCB crystal was recorded in the KBr pellet technique in the frequency region 400-4000 cm-1 using BRUKER 66V FTIR spectrometer. The recorded FTIR spectrum of LGAHCB crystal is shown in Fig.3. The comparison of vibration of L-glutamic acid and LGAHCB is shown in Table 1. The broad and strong absorption band between 2100 and 3400cm-1 are assigned to the hydrogen bonded NH3+stretching modes. The intense sharp peaks at 2903cm-1 are due to the CH stretching modes of vibration. The C=O stretching modes of vibration is observed at 1683 and 1724 cm-1. The intense sharp peaks at 1503 cm-1 are due to NH3+ symmetric deformation. The less intense sharp peak at 1417 cm-1 is due to the CH2 bending modes of vibration. The C-C-H bending modes of vibration are observed at 1370 cm-1. There are less intense resolved bands at 1268 cm- 1 are attributed to CH2 twisting. The C-O stretching modes of vibrations and O-H in-plane bending modes of vibration is observed at 1205 cm-1. The less intense peak observed at 1075 cm-1 is due to the NH2 rocking. The C-C stretching modes of vibration and O-H out of-plane bending modes of vibrations are observed at 852 cm-1. The band observed at 628cm-1 is assigned to C=O in plane bending of COOH [15-17]. The NH torsion and rocking of COO- is assigned to the band observed at 531 and 488 cm-1. This observation confirms the protonation of L-glutamic acid by hydro chloro bromic acid. 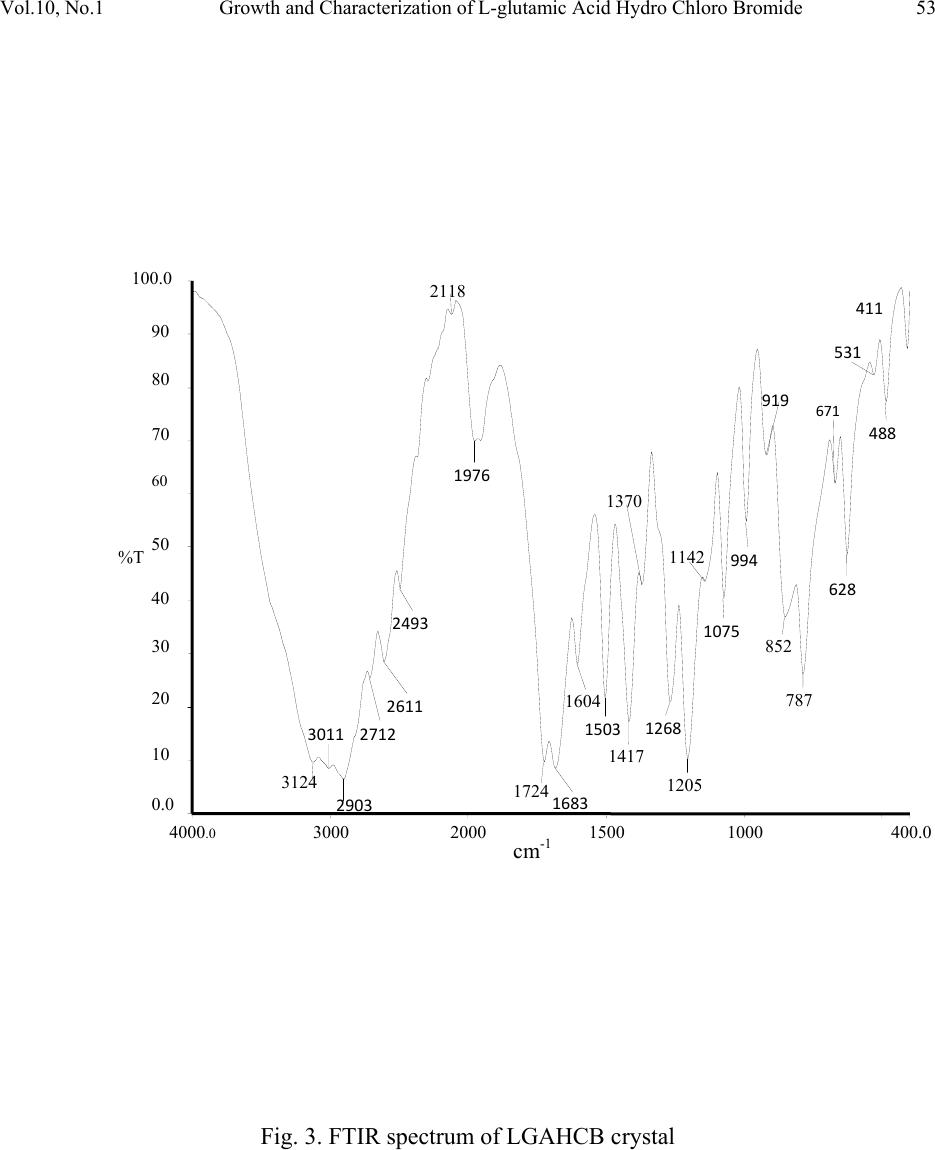 Vol.10, No.1 Growth and Characterization of L-glutamic Acid Hydro Chloro Bromide 53 Fig. 3. FTIR spectrum of LGAHCB crystal 4000 .0 30002000 1500 1000 400.0 0.0 10 20 30 40 50 60 70 80 90 100.0 cm-1 %T 3124 3011 2903 2712 2611 2493 2118 1976 1724 1683 1604 1503 1417 1370 1268 1205 1142 1075 994 919 852 787 671 628 531 488 411 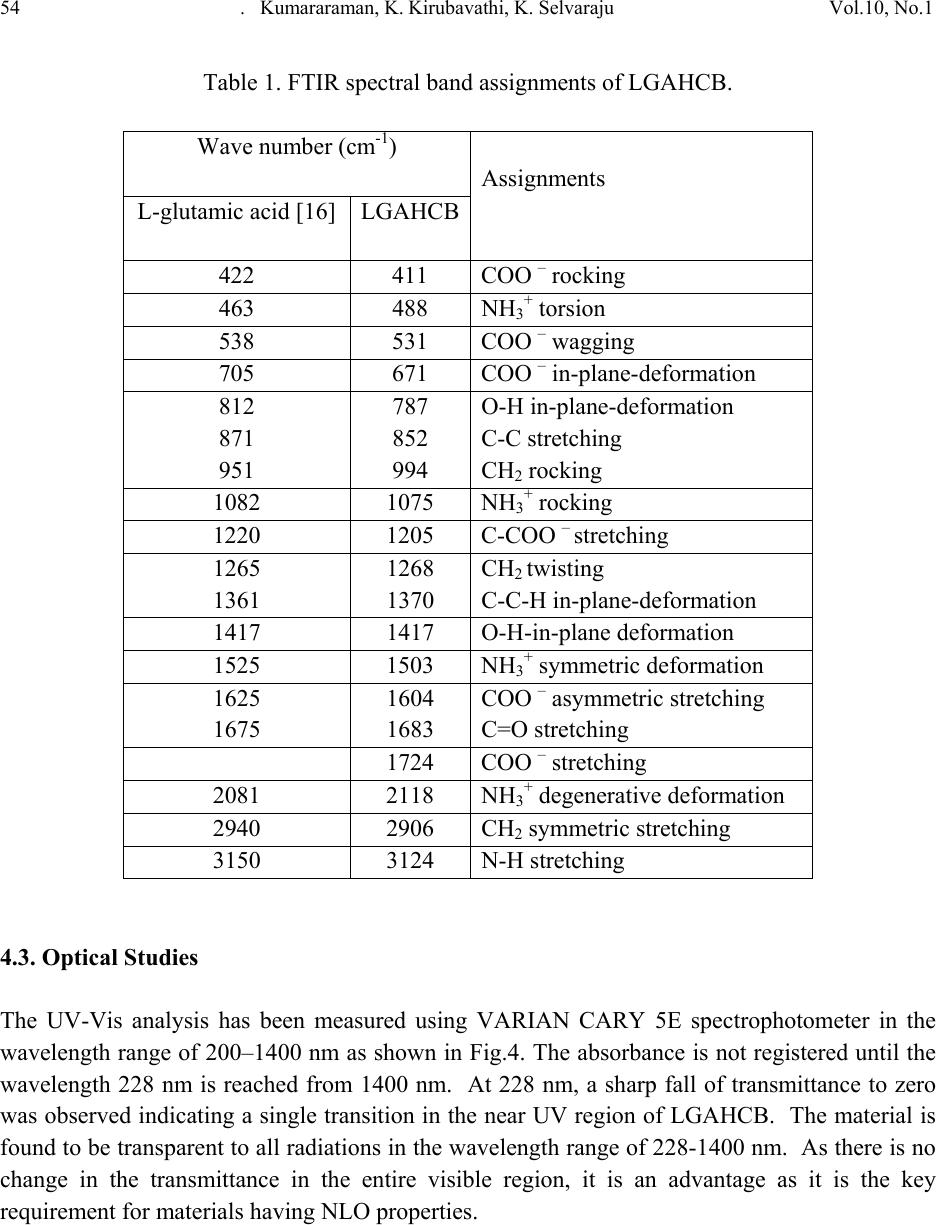 54 . Kumararaman, K.Kirubavathi, K. Selvaraju Vol.10, No.1 Table 1. FTIR spectral band assignments of LGAHCB. Wave number (cm-1) Assignments L-glutamic acid [16] LGAHCB 422 411 COO – rocking 463 488 NH3+ torsion 538 531 COO – wagging 705 671 COO – in-plane-deformation 812 871 951 787 852 994 O-H in-plane-deformation C-C stretching CH2 rocking 1082 1075 NH3+ rocking 1220 1205 C-COO – stretching 1265 1361 1268 1370 CH2 twisting C-C-H in-plane-deformation 1417 1417 O-H-in-plane deformation 1525 1503 NH3+ symmetric deformation 1625 1675 1604 1683 COO – asymmetric stretching C=O stretching 1724 COO – stretching 2081 2118 NH3+ degenerative deformation 2940 2906 CH2 symmetric stretching 3150 3124 N-H stretching 4.3. Optical Studies The UV-Vis analysis has been measured using VARIAN CARY 5E spectrophotometer in the wavelength range of 200–1400 nm as shown in Fig.4. The absorbance is not registered until the wavelength 228 nm is reached from 1400 nm. At 228 nm, a sharp fall of transmittance to zero was observed indicating a single transition in the near UV region of LGAHCB. The material is found to be transparent to all radiations in the wavelength range of 228-1400 nm. As there is no change in the transmittance in the entire visible region, it is an advantage as it is the key requirement for materials having NLO properties. 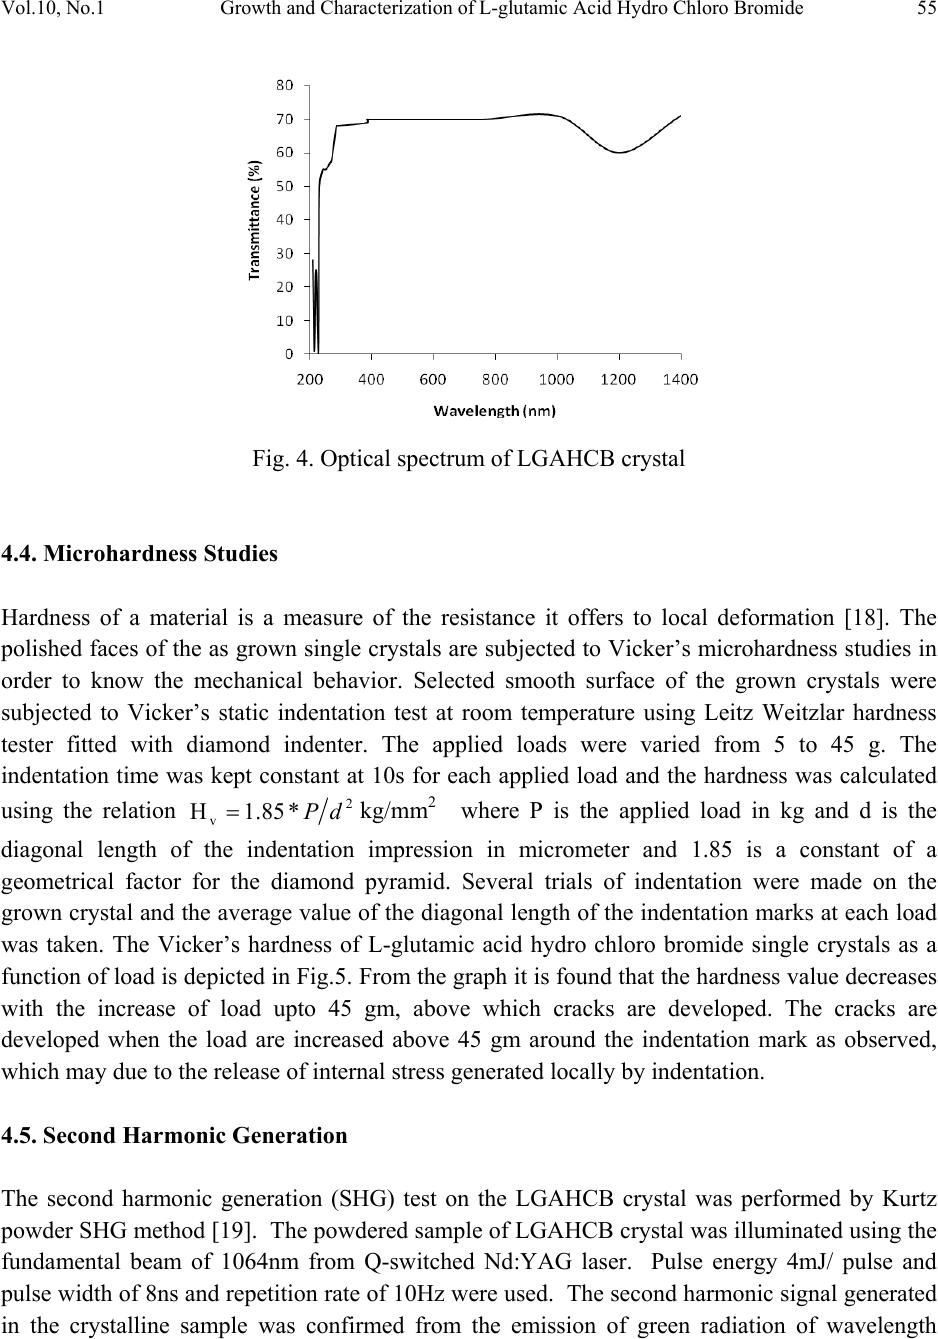 Vol.10, No.1 Growth and Characterization of L-glutamic Acid Hydro Chloro Bromide 55 Fig. 4. Optical spectrum of LGAHCB crystal 4.4. Microhardness Studies Hardness of a material is a measure of the resistance it offers to local deformation [18]. The polished faces of the as grown single crystals are subjected to Vicker’s microhardness studies in order to know the mechanical behavior. Selected smooth surface of the grown crystals were subjected to Vicker’s static indentation test at room temperature using Leitz Weitzlar hardness tester fitted with diamond indenter. The applied loads were varied from 5 to 45 g. The indentation time was kept constant at 10s for each applied load and the hardness was calculated using the relation 2 v*85.1H dP=kg/mm2 where P is the applied load in kg and d is the diagonal length of the indentation impression in micrometer and 1.85 is a constant of a geometrical factor for the diamond pyramid. Several trials of indentation were made on the grown crystal and the average value of the diagonal length of the indentation marks at each load was taken. The Vicker’s hardness of L-glutamic acid hydro chloro bromide single crystals as a function of load is depicted in Fig.5. From the graph it is found that the hardness value decreases with the increase of load upto 45 gm, above which cracks are developed. The cracks are developed when the load are increased above 45 gm around the indentation mark as observed, which may due to the release of internal stress generated locally by indentation. 4.5. Second Harmonic Generation The second harmonic generation (SHG) test on the LGAHCB crystal was performed by Kurtz powder SHG method [19]. The powdered sample of LGAHCB crystal was illuminated using the fundamental beam of 1064nm from Q-switched Nd:YAG laser. Pulse energy 4mJ/ pulse and pulse width of 8ns and repetition rate of 10Hz were used. The second harmonic signal generated in the crystalline sample was confirmed from the emission of green radiation of wavelength  56 . Kumararaman, K.Kirubavathi, K. Selvaraju Vol.10, No.1 532nm collected a monochromator after separating the 1064nm pump beam with an IR-blocking filter. A photo multiplier tube as used as detector. It is observed that the measured SHG efficiency of LGAHCB crystal was 1.5 times that of potassium dihydrogen phosphate (KDP). Fig. 5. Load vs Hardness number of LGAHCB crystal 5. CONCLUSIONS Good optical quality of L-glutamic acid hydro chloro bromide (LGAHCB) single crystals was grown by slow evaporation solution growth technique at room temperature. From the single crystal X-ray diffraction analysis, the LGAHCB crystal has orthorhombic system. The unit cell parameter values were also determined. The presence of the various functional groups of LGAHCB has been confirmed by Fourier transform infrared spectroscopy analysis. From the optical studies, the total transparency in the entire visible region, LGAHCB will be used for optical applications. The powder second harmonic generation efficiency measurement shows the grown LGAHCB crystal having 1.5 times higher nonlinear optical efficiency than potassium dihydrogen phosphate (KDP). REFERENCES 1. P.N. Prasad, D.J. Williams, Introduction to nonlinear optical effects in molecules and polymers, Wiley-Interscience, New York, 1991. 2. D.S. Chemla, J. Zyss, Nonlinear optical properties of organic molecules and crystals, vols. 1and 2, Academic Press, New York, 1987. 3. S.S. Gupte, A. Marcano, R.D. Pradhan, C.F. Desai, J. Melikechi, Appl. Phys.89 (2001) 4039.  Vol.10, No.1 Growth and Characterization of L-glutamic Acid Hydro Chloro Bromide 57 4. T. Uma Devi, N. Lawrence, R. Ramesh Babu, K. Ramamurthi, J. Cryst. Growth, 310 (2008) 116. 5. S.A. Martin Britto Dhas, S. Natarajan, Opt. Comm. 281 (2008) 457. 6. L. Misoguti, A.T. Varela, F.d. Nunes, V.S. Bagnato, F.E.A.Melo, J. Mendes Filho, S.C.Zilio, Opt. Mater. 6 (1996) 147. 7. M. Kitazawa, R. Higuchi, M. Takahashi, Appl. Phys. Lett. 64 (1994) 2477. 8. D. Eimert, S. Velsko, L. Davis, F. Wang, G. Loiaccono, G. Kennady, IEEE J. Quantum electron. 25 (1989) 179. 9. M.D. Aggarwal, J. Choi, W.S. Wang, K. Bhat, R.B. Lal, A.D. Shield, B.G. Penn, D.O. Frazier, J. Cryst. Growth 204 (1999) 179. 10. G. Ramesh Kumar, S. Gokul Raj, R.Sankar, R. Mohan, S. Pandi, R. Jayavel, J. Cryst. Growth 267 (2004) 213. 11. S. Dhanuskodi, K. Vasantha, Cryst. Res. Technol. 39 (2005) 259. 12. K.Kirubavathi, K.Selvaraju, R. Valluvan, N. Vijayan, S. Kumararaman, Spectrochim. acta A. 69 ( 2008) 1283. 13. K. Selvaraju, R. Valluvan, K. Kirubavathi, S. Kumararaman, Opt. Comm. 269 (2007) 230. 14. M. Delfino, G.M. Loiacono, J.A. Nicolosi, J. Solid State Chem. 23 (1978) 289. 15. K. Nakamoto, Infrared and Raman Spectra of Inorganic and Coordination Compounds, Wiley & Sons, New York, 1986. 16. Jag Mohan, Organic Spectroscopy Principles and Applications, Narosa Publishing House, New Delhi, 2005. 17. R.S. Krishnan, V.N. Sankaranarayanan, K.Krishnan, J. Indian Inst. Sci. 55 (1973) 66. 18. B.W. Mott, Microindentation Hardness Testing, vol. 206, Butterworths, London, 1956. 19. S. K. Kurtz, T.T. Perry, J. Appl. Phys. 39 (1968) 3798. |