Paper Menu >>
Journal Menu >>
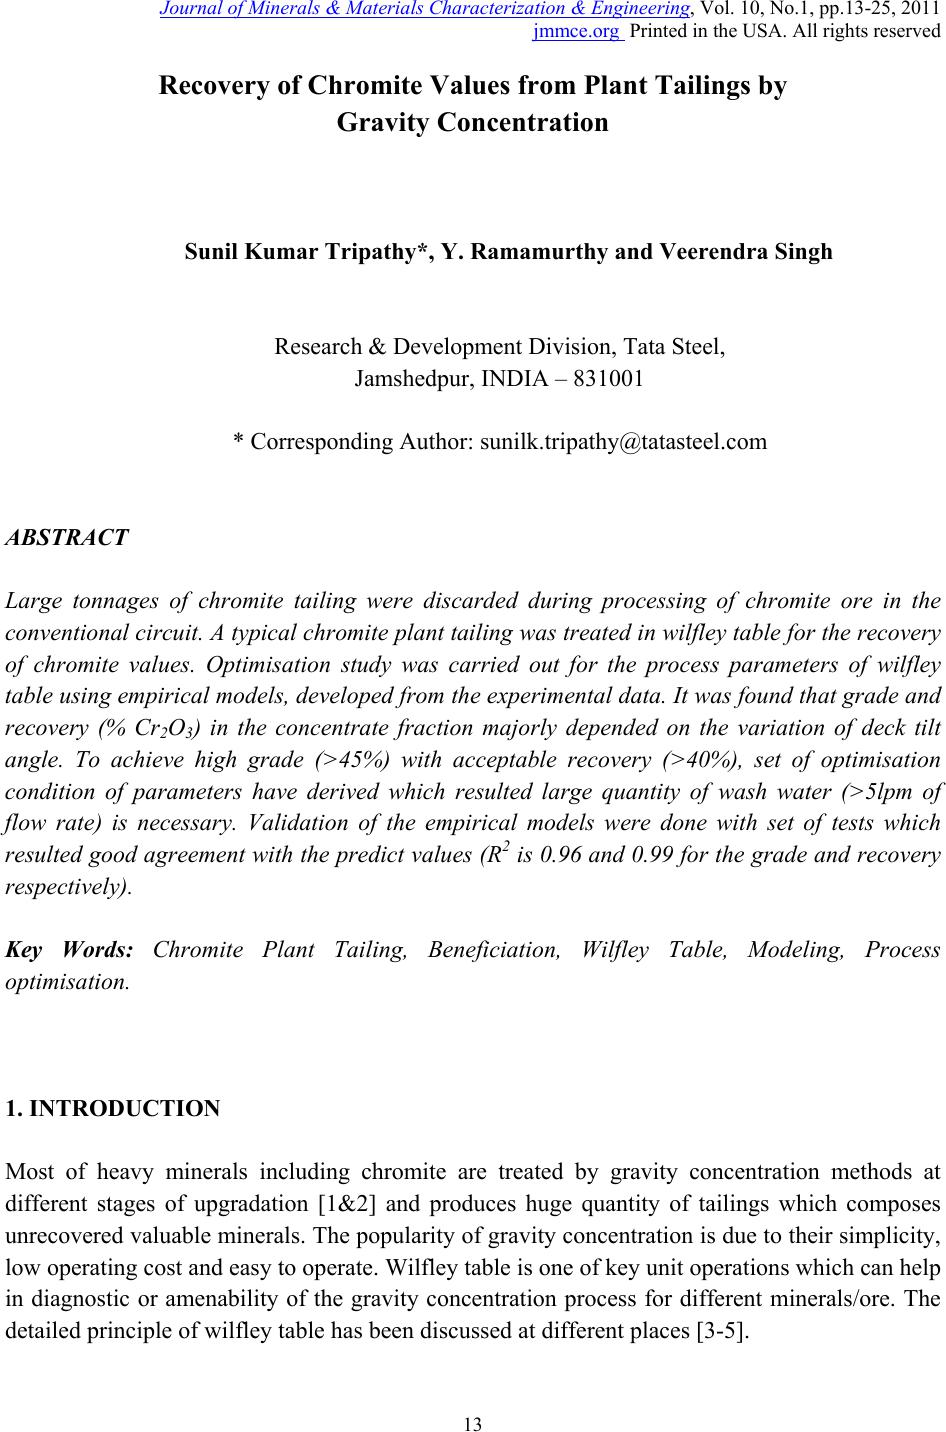 Journal of Minerals & Materials Characterization & Engineering, Vol. 10, No.1, pp.13-25, 2011 jmmce.org Printed in the USA. All rights reserved 13 Recovery of Chromite Values from Plant Tailings by Gravity Concentration Sunil Kumar Tripathy*, Y. Ramamurthy and Veerendra Singh Research & Development Division, Tata Steel, Jamshedpur, INDIA – 831001 * Corresponding Author: sunilk.tripathy@tatasteel.com ABSTRACT Large tonnages of chromite tailing were discarded during processing of chromite ore in the conventional circuit. A typical chromite plant tailing was treated in wilfley table for the recovery of chromite values. Optimisation study was carried out for the process parameters of wilfley table using empirical models, developed from the experimental data. It was found that grade and recovery (% Cr2O3) in the concentrate fraction majorly depended on the variation of deck tilt angle. To achieve high grade (>45%) with acceptable recovery (>40%), set of optimisation condition of parameters have derived which resulted large quantity of wash water (>5lpm of flow rate) is necessary. Validation of the empirical models were done with set of tests which resulted good agreement with the predict values (R2 is 0.96 and 0.99 for the grade and recovery respectively). Key Words: Chromite Plant Tailing, Beneficiation, Wilfley Table, Modeling, Process optimisation. 1. INTRODUCTION Most of heavy minerals including chromite are treated by gravity concentration methods at different stages of upgradation [1&2] and produces huge quantity of tailings which composes unrecovered valuable minerals. The popularity of gravity concentration is due to their simplicity, low operating cost and easy to operate. Wilfley table is one of key unit operations which can help in diagnostic or amenability of the gravity concentration process for different minerals/ore. The detailed principle of wilfley table has been discussed at different places [3-5]. 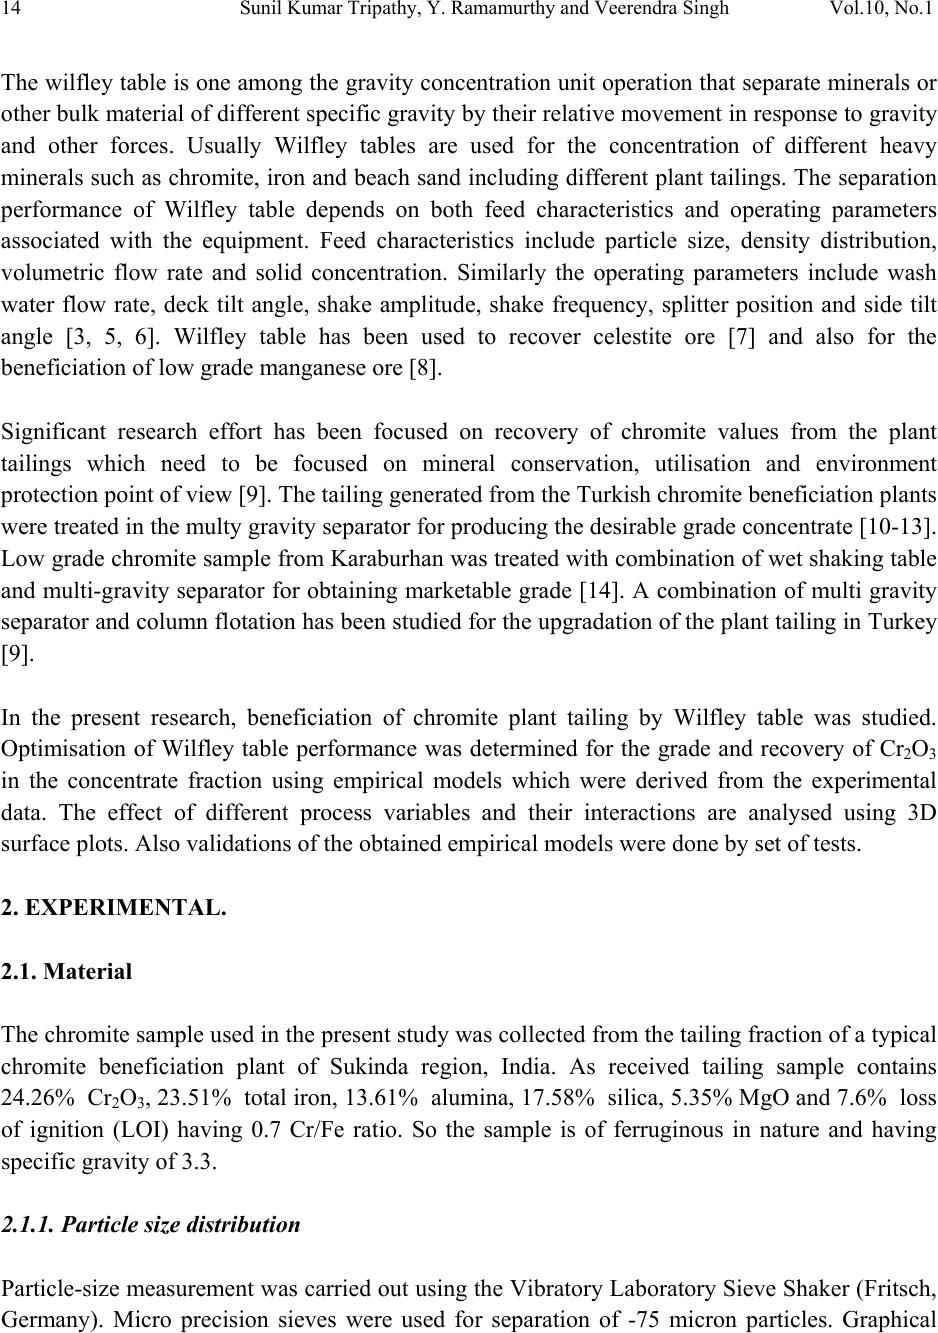 14 Sunil Kumar Tripathy, Y. Ramamurthy and Veerendra Singh Vol.10, No.1 The wilfley table is one among the gravity concentration unit operation that separate minerals or other bulk material of different specific gravity by their relative movement in response to gravity and other forces. Usually Wilfley tables are used for the concentration of different heavy minerals such as chromite, iron and beach sand including different plant tailings. The separation performance of Wilfley table depends on both feed characteristics and operating parameters associated with the equipment. Feed characteristics include particle size, density distribution, volumetric flow rate and solid concentration. Similarly the operating parameters include wash water flow rate, deck tilt angle, shake amplitude, shake frequency, splitter position and side tilt angle [3, 5, 6]. Wilfley table has been used to recover celestite ore [7] and also for the beneficiation of low grade manganese ore [8]. Significant research effort has been focused on recovery of chromite values from the plant tailings which need to be focused on mineral conservation, utilisation and environment protection point of view [9]. The tailing generated from the Turkish chromite beneficiation plants were treated in the multy gravity separator for producing the desirable grade concentrate [10-13]. Low grade chromite sample from Karaburhan was treated with combination of wet shaking table and multi-gravity separator for obtaining marketable grade [14]. A combination of multi gravity separator and column flotation has been studied for the upgradation of the plant tailing in Turkey [9]. In the present research, beneficiation of chromite plant tailing by Wilfley table was studied. Optimisation of Wilfley table performance was determined for the grade and recovery of Cr2O3 in the concentrate fraction using empirical models which were derived from the experimental data. The effect of different process variables and their interactions are analysed using 3D surface plots. Also validations of the obtained empirical models were done by set of tests. 2. EXPERIMENTAL. 2.1. Material The chromite sample used in the present study was collected from the tailing fraction of a typical chromite beneficiation plant of Sukinda region, India. As received tailing sample contains 24.26% Cr2O3, 23.51% total iron, 13.61% alumina, 17.58% silica, 5.35% MgO and 7.6% loss of ignition (LOI) having 0.7 Cr/Fe ratio. So the sample is of ferruginous in nature and having specific gravity of 3.3. 2.1.1. Particle size distribution Particle-size measurement was carried out using the Vibratory Laboratory Sieve Shaker (Fritsch, Germany). Micro precision sieves were used for separation of -75 micron particles. Graphical  Vol.10, No.1 Recovery of Chromite Values 15 representation of the size analysis data of the tailing sample is presented in Figure 1. It may be elucidated from the size measurement that the slime is extremely fine in nature and substantial amount of the tailing i s below 25 micron (33.45% by weight). Figure 1: Size distribution of the chromite plant tailing sample. 2.1.2. Sizewise chem ical analysis The chemical analysis of the different size fractions were carried out by ICP analyser and the result of the size wise chemical analysis is given in Table 1. This table shows that the Cr2O3 content varies from 18.2% to 29.26% and most of the Cr2O3 (about 51.18% by wt) is distributed in the size range -250 and +25 microns. But huge quantity (30.56% by wt) of Cr2O3 value is distributed at finer sizes i.e. below 25 micron. The total iron content varies from 13.23% to 23.61% and the maximum quantity of total iron (38.74% by weight) is distributed at finer sizes i.e. below 25 micron. Similarly, maximum amount of alumina, silica and MgO distributed at finer size (below 25 micron) are 29.07%, 28.32% and 35.43% respectively. 2.1.3. XRD study X-Ray Diffraction study was carried out to identify mineral phases in the chromite tailing sample. The diffractogram of the XRD study is shown in Figure 2. From this figure, it can be seen that hematite and goethite are the major iron-bearing mineral phases along with chromite whereas gibbsite, kaolinite and quartz occur as minor gangue mineral phases.  16 Sunil Kumar Tripathy, Y. Ramamurthy and Veerendra Singh Vol.10, No.1 Table 1: Size wise chemical analysis of the chromite tailing sample. Size Wt% Assay value (%) (µm) Retained Cr2O3 Fe(T) Al2O3 SiO2 MgO +600 2.47 23.76 19.2 11.8 11.21 5.8 -600+500 6.74 23.18 22.2 14.35 13.1 4.5 -500+250 11.26 18.2 21.86 16.14 18 3.7 -250+150 11.26 21.2 21.87 16.4 18.77 4.34 -150+106 8.35 27.5 18.9 14.5 17.8 6.1 -106+75 5.80 26.3 18.9 15 21.1 5.7 -75+45 8.49 24 13.23 15.93 24.36 5.45 -45+37 5.97 28.52 14.32 13.66 21.4 6.2 -37+25 6.22 29.26 15.19 12.12 18.14 6.26 -25 33.45 21 23.61 12.16 14.74 5.6 Figure 2: X-Ray Diffraction (XRD) pattern of the tailing sample with identified phase s ( : chromite, :hematite, : kaolinite, : gibbsite, : quartz, α: goethite). 2.2. Methods The experimental set up consists of feed slurry tank, a peristaltic pump and Wilfley table. The feed slurry tank (100-litres capacity) was attached with a stirrer to keep the solids in uniform suspension throughout the test programme. The peristaltic pump was used to feed the desired Position [°2Theta] 20 30 40 50 607080 0 2500 10000 CO B Pl ant Taily (Head)_R ▲ ■ ♦ ▲ ■ ■ ▲ ■ ♦ ▲ ▲ ▲ ♦ ▲ ■ ▲ ▲■ ■ ▲ ■ ♦♦ 2500 0 10000 20 3060 70 80 40 50 Position (Degree 2 ǿ) α α αα α Counts Position [°2Theta] 20 30 40 50 607080 0 2500 10000 CO B Pl ant Taily (Head)_R ▲ ■ ♦ ▲ ■ ■ ▲ ■ ♦ ▲ ▲ ▲ ♦ ▲ ■ ▲ ▲■ ■ ▲ ■ ♦♦ 2500 0 10000 20 3060 70 80 40 50 Position (Degree 2 ǿ) α α αα α Counts  Vol.10, No.1 Recovery of Chromite Values 17 quantity of slurry to the separation unit. The laboratory Wilfley table used in the study is a typical one, commonly used to concentrate minerals (laboratory model No. 15 S, supplied by M/s The Deister Concentrator Company Inc., USA). It has one deck of rectangular form with 350 x1000 mm, with linoleum as surface material. It is partially riffled, with riffles parallel to the deck motion. The riffles have 5 mm height on the feed end with decreasing height from the feed edge to the concentrate edge. The gap between riffles is 12 mm. The process variables wash water flow rate, deck tilt angle and feed slurry flow rate were varied by keeping the other variables such as solid concentration at 20% solids by weight, 15 mm of shake amplitude, 200cycles/min. of shake frequency and splitter position at 25 cm from the concentrate end were kept constant. 2.3. Experimental Program A statistically designed test program was performed to obtain the necessary data needed to develop empirical models that accurately describe the effect of three key operating parameter values and their interactive relationships when treating chromite plant tailings using wilfley table. The models were further used to optimize the parameters which could maximize the grade and recovery of the Cr2O3 in the concentrate fraction. The range of operating values for each parameter tested is shown in Table 2. Number of tests as per the Box–Behnken experimental design was conducted and the product samples were dried, weighed and analysed in terms of grade and recovery. After the model development, a set of optimum operating conditions were identified by considering the limit of grade and recovery of Cr2O3. Subsequent table tests were conducted for validation purposes. Table 2: Process variable ranges used in the 3-level Box-Behnken design. Process variables Parameter Values -1 Level 0 Level +1 Level X1. Wash water flow rate (l/min)2.5 5 7.5 X2. Deck tilt Angle (degree) 2 4 6 X3. Slurry feed Rate (l/hr) 100 130 160 3. RESULTS AND DISCUSSION The experimental programme provided a broad range of grade and recovery values which is shown in Table 3. It is observed from the table that the concentrate fraction is enriched up to with 60.88% Cr2O3 with recovery of 13.66% where as a maximum of 61.37% Cr2O3 recovery is reported with Cr2O3 content of 49.58%. The test results were analysed in further section.  18 Sunil Kumar Tripathy, Y. Ramamurthy and Veerendra Singh Vol.10, No.1 Table 3: Observed results at different levels of variables. Test Observed Conditions Observed Results No. X1 X 2 X 3 % Cr2O3 % Rec.(Cr2O3) 1 -1 -1 0 42.76 57.52 2 +1 -1 0 48.95 37.33 3 -1 +1 0 54.86 12.64 4 +1 +1 0 52.41 13.74 5 -1 0 -1 40.33 33.25 6 +1 0 -1 44.9 19.11 7 -1 0 +1 45.93 16.4 8 +1 0 +1 37.04 11.94 9 0 -1 -1 49.58 61.37 10 0 +1 -1 32.2 7.77 11 0 -1 +1 28.2 34.82 12 0 +1 +1 60.88 13.36 13 0 0 0 52.16 37.79 14 0 0 0 52.16 37.79 15 0 0 0 52.26 37.79 3.1. Model Evaluation By using the test results empirical models have developed for the chromite grade and recovery of concentrate fraction. Table 4 is the ANOVA (Analysis of Variance) for developed models for the concentrate fraction of Cr2O3 grade and recovery. All major statistics indicate that the models can be used for effectively describing the operating parameter effects on the response variables. Both the models have higher value of R2 (0.98 and 0.99 for grade and recovery respectively) which indicates the models are well agreement with the experimental data. The models are significant as the F value is high, the Prob>F value is less than 0.05 and the standard deviation is very small (1.67 for the grade and 0.97 for the recovery). The coefficient estimate and the significance level of the parameter and parameter interactions of the empirical models are provided in Table 5. The data clearly shows that the Cr2O3 grade of the concentrate fraction has affected majorly by deck tilt angle (X2) and the interaction between the deck tilt angle and slurry feed rate (X2X3) has major influence on grade of the concentrate fraction. Similarly for the recovery of % Cr2O3 in the concentrate fraction is influenced by deck tilt angle (X2) and interaction between wash water flow rate and deck tilt angle (X1X2). So, it is evident that deck tilt angle has  Vol.10, No.1 Recovery of Chromite Values 19 major influence on the separation of the chromite bearing minerals to the concentrate fraction. The high specific gravity minerals (chromite) are forced to spread out in thin, wide band which decides the particle traveling path (allows much sharper cuts between the concentrate, middling and tailing). In case of the grade model terms, the wash water flow rate (X1), slurry flow rate (X3), double interaction of wash water flow rate (X12) and deck tilt angle (X22) and for the recovery model terms, the double interaction of the deck tilt angle (X22) are not significant as the Prob>F are higher than 0.05. Table 4: ANOVA table derived for the grade and recovery models. Statistics Source Cr2O3(%) grade model Cr2O3(%) recovery model Sum of square 1147.44 4092.09 Degree of freedom 9 9 Mean square 127.49 454.68 F-Value 45.64 480.12 Prob>F <0.0001 <0.0001 Standard deviation 1.67 0.97 R2 0.98 0.99 Table 5: Estimated coefficient values for the parameter and paramet er interaction effects. Factor (%) Cr2O3 Grade (%)Cr2O3 Recovery Coefficient F-value Prob>F Coefficient F-value Prob>F estimate estimate X1 -0.072 0.015 0.9058 -4.71 187.51 < 0.0001 X2 3.86 42.62 0.0003 -17.94 2719.24 < 0.0001 X3 0.63 1.14 0.3217 -5.62 267.05 < 0.0001 X12 -1.54 3.57 0.1006 -8.32 307.68 < 0.0001 X22 -0.88 1.15 0.3183 0.84 3.11 0.1212 X32 -8.57 170.71 < 0.0001-9.3 384.24 < 0.0001 X1X2 -2.16 6.68 0.0362 5.32 119.66 < 0.0001 X1X3 -3.36 16.21 0.005 2.42 24.74 0.0016 X2X3 12.52 224.29 < 0.00018.03 272.7 < 0.0001  20 Sunil Kumar Tripathy, Y. Ramamurthy and Veerendra Singh Vol.10, No.1 For better understanding of the results, the predicted models are described in terms of three dimensional (3D) response surface plots which show the effect of process variables on grade and recovery of Cr2O3 in concentrate fraction. Figure 3 explains the effect of the process parameters of wilfley table on grade of concentrate fraction. Figure 3(a) shows the effect of wash water flow rate (X1) and deck tilt angle (X2) on grade of the concentrate fraction at center level of slurry feed rate. It is observed that higher grade is obtained at lower level of wash water flow rate and higher level of deck tilt angle, which is caused due to decrease in the residence time of the gangue minerals a nd that result wash away of the low density minerals to the tailing fraction. Figure 3(b) shows the effect of wash water flow rate (X1) and slurry feed rate (X3) on grade of the concentrate fraction of the wilfley table at center level of deck tilt angle. The grade of the concentrate fraction is maximum at intermediate of slurry feed rate and lower level of the wash water flow rate. It is also observed that as the wash water flow rate increases, there is an increase in the grade of the concentrate fraction at lower level of feed flow rate and at higher level of feed flow rate and vice versa. As the wash water flow rate increases, the transport of the gangue minerals to the tailing fraction increases which in turn improves the grade of the concentrate fraction. Figure 3(c) shows the effect of deck tilt angle (X2) and feed flow rate (X3) on grade of the concentrate fraction of the wilfley table at center level of wash water flow rate. The higher grade of the concentrate fraction is obtained at higher level of both deck tilt angle and feed flow rate. It is also noted that at lower level of deck tilt angle, as the feed rate increases there is decrease in the quality of the concentrate fraction but at higher deck tilt angle and vice versa. Figure 3. Response surface plots showing the effects on grade (%) of Cr2O3 in the concentrate fraction: (a) Between wash water flow rate (x1) and deck tilt angle (x2) , (b) Between wash water flow rate (x1) and feed flow rate (x3), (c) Between deck tilt angle (x2) and feed flow rate (x3). -1 -0.5 0 0.5 1 -1 0 1 40 45 50 55 60 Wash Water Flow Rate(x1) Deck Tilt Angle(x2) Grade(%) -1 -0.5 00.5 1 -1 -0.5 0 0.5 1 35 40 45 50 55 Wash Water Flow rate(x1) Feed Flow rate(x3) Grade(%) -1 -0.5 00.5 1 -1 -0.5 0 0.5 1 20 30 40 50 60 70 Deck Tilt Angle(x2) Feed Flow rate(x3) Grade(%) abc -1 -0.5 0 0.5 1 -1 0 1 40 45 50 55 60 Wash Water Flow Rate(x1) Deck Tilt Angle(x2) Grade(%) -1 -0.5 00.5 1 -1 -0.5 0 0.5 1 35 40 45 50 55 Wash Water Flow rate(x1) Feed Flow rate(x3) Grade(%) -1 -0.5 00.5 1 -1 -0.5 0 0.5 1 20 30 40 50 60 70 Deck Tilt Angle(x2) Feed Flow rate(x3) Grade(%) -1 -0.5 0 0.5 1 -1 0 1 40 45 50 55 60 Wash Water Flow Rate(x1) Deck Tilt Angle(x2) Grade(%) -1 -0.5 00.5 1 -1 -0.5 0 0.5 1 35 40 45 50 55 Wash Water Flow rate(x1) Feed Flow rate(x3) Grade(%) -1 -0.5 00.5 1 -1 -0.5 0 0.5 1 20 30 40 50 60 70 Deck Tilt Angle(x2) Feed Flow rate(x3) Grade(%) abc 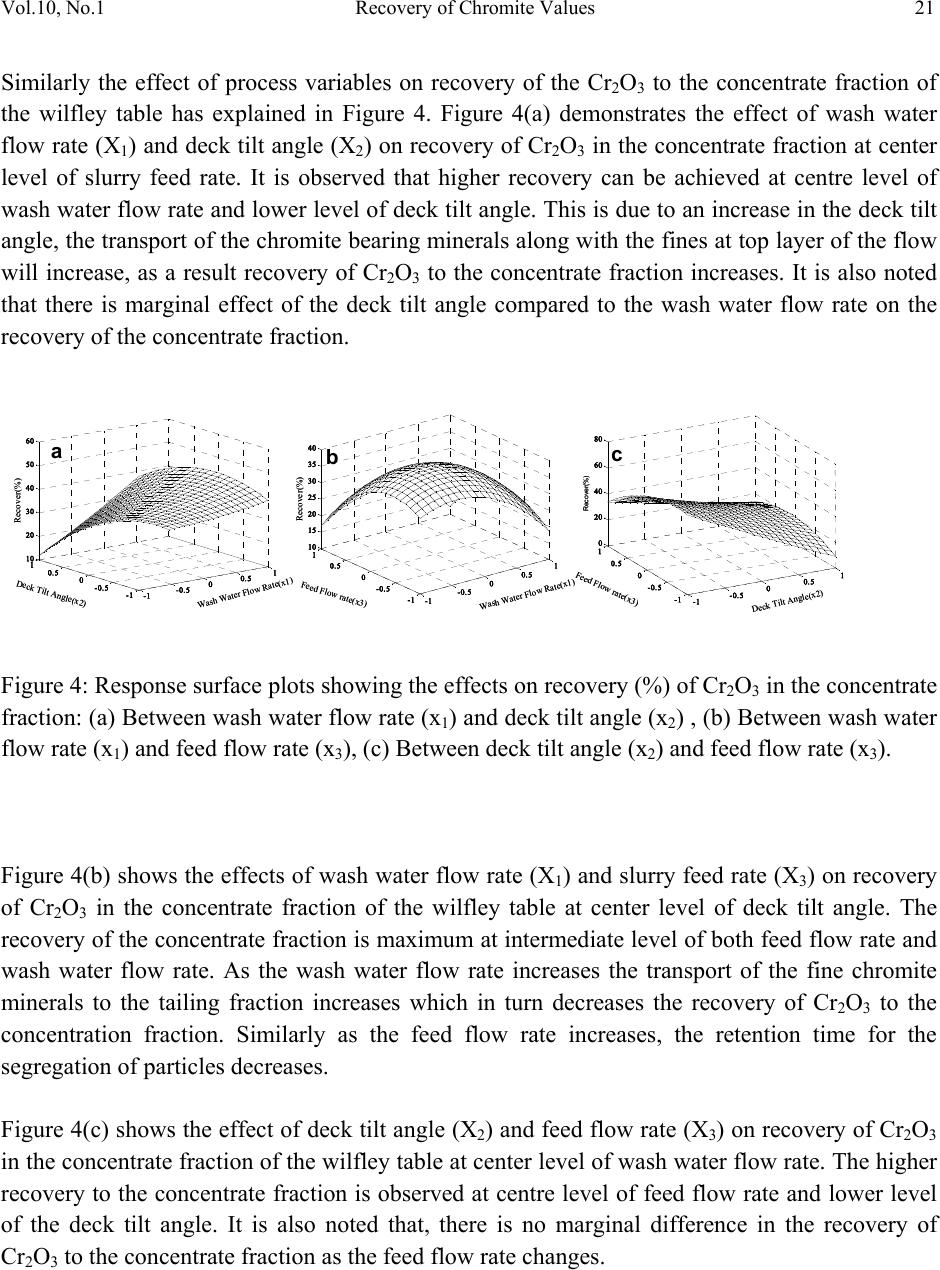 Vol.10, No.1 Recovery of Chromite Values 21 Similarly the effect of process variables on recovery of the Cr2O3 to the concentrate fraction of the wilfley table has explained in Figure 4. Figure 4(a) demonstrates the effect of wash water flow rate (X1) and deck tilt angle (X2) on recovery of Cr2O3 in the concentrate fraction at center level of slurry feed rate. It is observed that higher recovery can be achieved at centre level of wash water flow rate and lower level of deck tilt angle. This is due to an increase in the deck tilt angle, the transport of the chromite bearing minerals along with the fines at top layer of the flow will increase, as a result recovery of Cr2O3 to the concentrate fraction increases. It is also noted that there is marginal effect of the deck tilt angle compared to the wash water flow rate on the recovery of the concentrate fraction. Figure 4: Response surface plots showing the effects on recovery (%) of Cr2O3 in the concentrate fraction: (a) Between wash water flow rate (x1) and deck tilt angle (x2) , (b) Between wash water flow rate (x1) and feed flow rate (x3), (c) Between deck tilt angle (x2) and feed flow rate (x3). Figure 4(b) shows the effects of wash water flow rate (X1) and slurry feed rate (X3) on recovery of Cr2O3 in the concentrate fraction of the wilfley table at center level of deck tilt angle. The recovery of the concentrate fraction is maximum at intermediate level of both feed flow rate and wash water flow rate. As the wash water flow rate increases the transport of the fine chromite minerals to the tailing fraction increases which in turn decreases the recovery of Cr2O3 to the concentration fraction. Similarly as the feed flow rate increases, the retention time for the segregation of particles decrea ses. Figure 4(c) shows the effect of deck tilt angle (X2) and feed flow rate (X3) on recovery of Cr2O3 in the concentrate fraction of the wilfley table at center level of wash water flow rate. The higher recovery to the concentrate fraction is observed at centre level of feed flow rate and lower level of the deck tilt angle. It is also noted that, there is no marginal difference in the recovery of Cr2O3 to the concentrate frac tion as the feed flow rate changes. -1 -0.5 00.5 1 -1 -0.5 0 0.5 1 10 20 30 40 50 60 Wash Water Flow Rate(x1) Deck Tilt Angle(x2) Recover(%) -1 -0.5 00.5 1 -1 -0.5 0 0.5 1 10 15 20 25 30 35 40 Wash Water Flow Rate(x1) Feed Flow rate(x3) Recover(%) -1 -0.500.5 1 -1 -0.5 0 0.5 1 0 20 40 60 80 Deck Tilt Angle(x2) Feed Flow rate(x3) Recover(%) abc -1 -0.5 00.5 1 -1 -0.5 0 0.5 1 10 20 30 40 50 60 Wash Water Flow Rate(x1) Deck Tilt Angle(x2) Recover(%) -1 -0.5 00.5 1 -1 -0.5 0 0.5 1 10 15 20 25 30 35 40 Wash Water Flow Rate(x1) Feed Flow rate(x3) Recover(%) -1 -0.500.5 1 -1 -0.5 0 0.5 1 0 20 40 60 80 Deck Tilt Angle(x2) Feed Flow rate(x3) Recover(%) abc 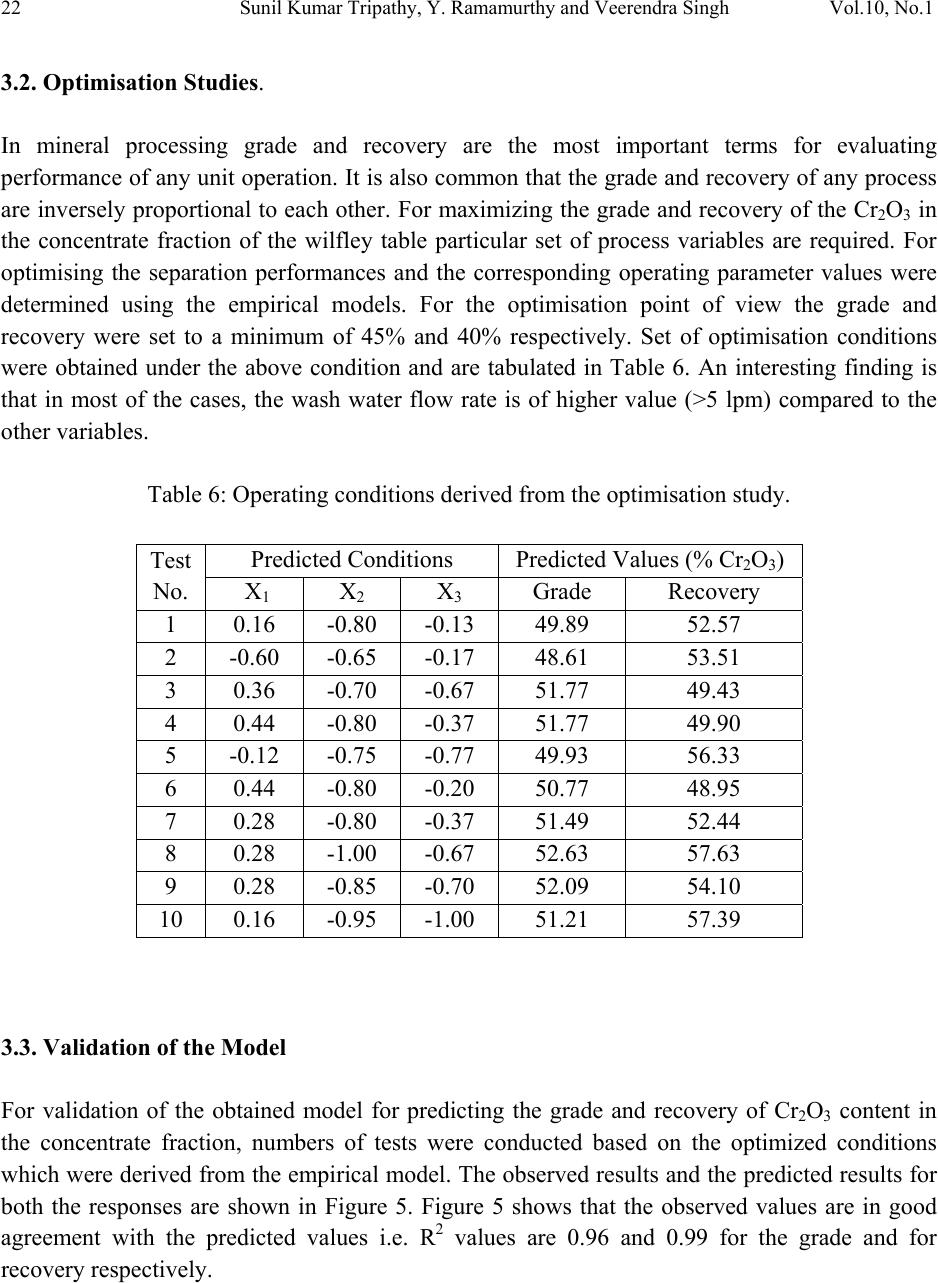 22 Sunil Kumar Tripathy, Y. Ramamurthy and Veerendra Singh Vol.10, No.1 3.2. Optimisation Studies. In mineral processing grade and recovery are the most important terms for evaluating performance of any unit operation. It is also common that the grade and recovery of any process are inversely proportional to each other. For maximizing the grade and recovery of the Cr2O3 in the concentrate fraction of the wilfley table particular set of process variables are required. For optimising the separation performances and the corresponding operating parameter values were determined using the empirical models. For the optimisation point of view the grade and recovery were set to a minimum of 45% and 40% respectively. Set of optimisation conditions were obtained under the above condition and are tabulated in Table 6. An interesting finding is that in most of the cases, the wash water flow rate is of higher value (>5 lpm) compared to the other variables. Table 6: Operating conditions derived from the optimisation study. Test No. Predicted Conditions Predicted Values (% Cr2O3) X1 X 2 X 3 Grade Recovery 1 0.16 -0.80 -0.13 49.89 52.57 2 -0.60 -0.65 -0.17 48.61 53.51 3 0.36 -0.70 -0.67 51.77 49.43 4 0.44 -0.80 -0.37 51.77 49.90 5 -0.12 -0.75 -0.77 49.93 56.33 6 0.44 -0.80 -0.20 50.77 48.95 7 0.28 -0.80 -0.37 51.49 52.44 8 0.28 -1.00 -0.67 52.63 57.63 9 0.28 -0.85 -0.70 52.09 54.10 10 0.16 -0.95 -1.00 51.21 57.39 3.3. Validation of the Model For validation of the obtained model for predicting the grade and recovery of Cr2O3 content in the concentrate fraction, numbers of tests were conducted based on the optimized conditions which were derived from the empirical model. The observed results and the predicted results for both the responses are shown in Figure 5. Figure 5 shows that the observed values are in good agreement with the predicted values i.e. R2 values are 0.96 and 0.99 for the grade and for recovery respectively. 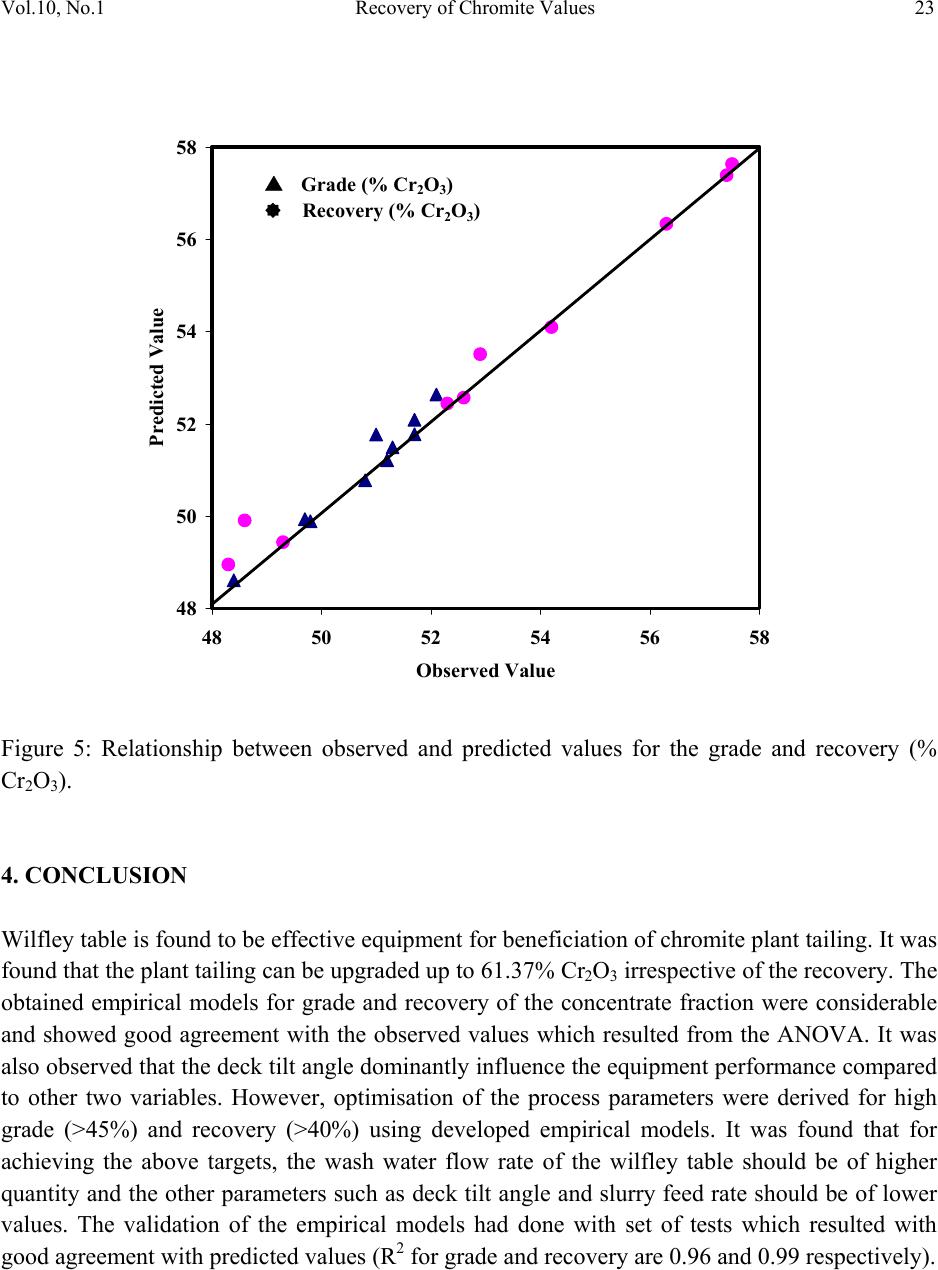 Vol.10, No.1 Recovery of Chromite Values 23 Figure 5: Relationship between observed and predicted values for the grade and recovery (% Cr2O3). 4. CONCLUSION Wilfley table is found to be effective equipment for beneficiation of chromite plant tailing. It was found that the plant tailing can be upgraded up to 61.37% Cr2O3 irrespective of the recovery. The obtained empirical models for grade and recovery of the concentrate fraction were considerable and showed good agreement with the observed values which resulted from the ANOVA. It was also observed that the deck tilt angle dominantly influence the equipment performance compared to other two variables. However, optimisation of the process parameters were derived for high grade (>45%) and recovery (>40%) using developed empirical models. It was found that for achieving the above targets, the wash water flow rate of the wilfley table should be of higher quantity and the other parameters such as deck tilt angle and slurry feed rate should be of lower values. The validation of the empirical models had done with set of tests which resulted with good agreement with predicted values (R2 for grade and recovery are 0.96 and 0.99 respectively). 48 50 52 54 56 58 48 50 52 54 56 58 Observed Value Predicted Value Grade (% Cr 2 O 3 ) Recovery (% Cr 2 O 3 )  24 Sunil Kumar Tripathy, Y. Ramamurthy and Veerendra Singh Vol.10, No.1 ACKNOWLEDGEMENT Authors are thankful to Tata Steel management for giving an opportunity to work on this project and permission to publish. The support and services provided by staff of R & D division are also duly acknowledged. REFERENCE [1] Demi G., Koci B, and Boci. S; Gravity concentration of poor chromium ores in Albania, XXIII International Mineral Processing Congress, Istanbul, Turkey, pp 310-312, 2006. [2] Meloy, T. P, Williams, M. C; Bevilacqua, P. ; Ferrara, G.; Shaking Tables - Effects Of Riffles; Minerals And Metallurgical Processing (Part A), SME Transactions Volume 296, pp. 1870-1877,1994. [3] Sivamohan R and Forssberg E, Principles of tabling, International Journal of Mineral Processing, 15 (1985), pp. 281—295. [4] Falconer, A.; Gravity separation: Old technique/new methods, Physical Separation in Science and Engineering, 2003, Vol. 12, No. 1, pp. 31–48. [5] Burt, R., 1984. Gravity Concentration Technology. Elsevier Science. [6] Carvalho M.T, Agante E., F. Dura, Recovery of PET from packaging plastics mixtures by wet shaking table, Waste Management 27 (2007) 1747–1754. [7] Selim A.Q, El-Midany A.A., Abdel-Fattah A.S, Ibrahim, S.S; Rationalization of the up- grading circuit of celestite for advanced applications; Powder Technology 198 (2010) ;pp.233–239. [8] Hosseini M.R, Bahrami A, Pazouki M; Influence of shaking table parameters on manganese grade and recovery; XXIV International Mineral Processing Congress (IMPC), 2008; Beijing, China, pp. 783-790. [9] Guney A., Onal G., and Atmaca T, New aspect of chromite gravity tailings re-processing; Minerals Engineering, Vol 14. No I I. pp 1527 -1530, 2001. [10] Cicek, T. C. and Cocen, I.; Applicability of Mozley multigravity separator (MGS) to fine chromite tailings of Turkish chromite concentrating plants, Minerals Engineering 15, pp 91–93 (2002). [11] Ozkan S.G. and Ipekoglu B; Concentration Studies on Chromite Tailings by Multi Gravity Separator, 17th International Mining Congress and Exhibition of Turkey- IMCET2001,pp 765-768, 2001. [12] Cicek, T, Cocen, I and Samanli; (1998), Gravimetric concentration of fi ne ch ro mite tailings. Innovation i n m i n e r a l a n d c o a l processing, pp 731-736, Atak, Onal and Celik (eds), Balkema, Rotterdam, The Netherlands. [13] Belardi. G, Sheau. N, Plescia. P, and Vegilo. F, Recent developments in gravity treatment of chromite fin es, Minerals and Metallurgical Processing, Aug. 1995, pp. 161-165.  Vol.10, No.1 Recovery of Chromite Values 25 [14] Sonmez, E and Turgut, B. 1998. Enrichment of low-grade Karaburhan chromite ores by gravitational methods, I nn ov at io n in mineral and coal processing, pp 723-726, Atak, Onal and Celik (eds), Balkema, Rotterdam, The Netherlands. |