Paper Menu >>
Journal Menu >>
 Journal of Minerals & Materials Characterization & Engineering, Vol. 9, No.12, pp.1113-1130, 2010 jmmce.org Printed in the USA. All rights reserved 1113 Corrosion Behavior of Mild Steel and SS 304L in Presence of Dissolved Copper M. Mobin* and Hina Shabnam Department of Applied Chemistry, Faculty of Engineering and Technology Aligarh Muslim University, Ali garh-202002 (India), *Corresponding author: drmobin@hotmail.com ABSTRACT The failure of steel components in multistage flash (MSF) desalination or power plants as a result of the deposition of carryover heavy metals/oxides is a common problem and reported by many authors. The present investigation was undertaken to study the corrosion behavior of mild steel and AISI 304L SS in presence of dissolved Cu ions under different experimental conditions. The experimental conditions include: variation in aqueous medium, Cu ion concentration, pH and flow condition. The corrosion rate of mild steel and SS 304L in presence of different concentration of Cu was determined by weight loss measurements and solvent analysis of iron ions into the test solution after completion of immersion. The amount of Cu ions present in the test solution after completion of immersion was also estimated using Atomic absorption spectrophotometer. The pH of the test solution was monitored during the entire period of immersion. Electrochemical techniques like free corrosion potential measurements and potentiodynamic polarization measurements were carried to find out the role of Cu ions on the corrosion behavior of mild steel and SS 304L. The effect of Cu on corrosion rate of mild steel is quite pronounced and follows interesting trend. However, SS 304L is not affected either in distilled water or artificial seawater and do not show any significant variation in corrosion rates in presence of Cu ions. Keywords: Mild steel; SS 304L; corrosion; copper ions; immersion tests; electrochemical tests 1. INTRODUCTION The corrosion is a major cause of component or material failure in desalination and power plants. Though one or more forms of corrosion are involved during corrosion failure in desalination plants general and pitting corrosion are more common modes of failures. The failure of steel components in desalination or power plants as a result of the deposition of carryover heavy metals/oxides is a common problem and reported by many authors. The problem may appear in the form of pitting or crevices which act as initiators of stress corrosion in the form of stress  1114 M. Mobin and Hina Shabnam Vol.9, No.12 corrosion cracking, corrosion fatigue or intergranular corrosion and result in the failure of components. However, this aspect has been given little attention and is least understood yet has great relevance to seawater desalination and power plants [1]. In seawater processing systems, if dissolved oxygen and pH are under control, general corrosion is the predominant mode of attack on conventional construction materials such as carbon steel. This form of corrosion is easily controllable and is desirable in the sense that it permits predictive estimates of service life. Pitting, the most detrimental form of attack, is often responsible for the corrosion failures of components in desalination and power plants. In process plants, it accounts at least 90% of metal damage by corrosion [2]. Out of the several causes of pitting one of the causes attributed to pitting is the contact of steel with heavy metal ions such as Cu [3]. This aspect has been given little attention and is least understood yet has great relevance to seawater desalination and power plants [4]. A survey of literature shows that a number of cases regarding the Cu induced pitting corrosion of iron and galvanized pipes and tanks in recirculating hot water system have been reported [5-8]. A very small concentration of Cu was found to be sufficient to cause accelerated attack. In multistage flash (MSF) desalination plants the recirculating brine generally contains Cu. The source of Cu is the cupronickel condenser tubes in the distiller which are subjected to vapor phase corrosion leading to the contamination of brine and condensate with Cu and Ni. The deterioration of protective Cu oxide during the start up following outage also contributes Cu in the brine and distillate. The Cu in the brine/distillate gets deposited on the flash chamber components and initiate accelerated corrosion attack [9-10]. In power-water cogeneration plants the condensate from the MSF plant is sent to the boiler and carry over Cu is likely to get deposited over the water touched parts. In steam turbines, the deposits along the steam path resulting from the boiler carryover are most problematic. The deposits are detrimental to efficiency of the turbine. A study of the corrosion related problems in steam generating equipments shows that while 26% of the failures are attributed to pitting; 57% are caused by deposition on blades formed from high dissolved and suspended solid carryover of steam [11]. The present work is concerned with the effect of Cu on localized corrosion behavior of mild steel and SS 304L under different experimental conditions. The experimental conditions which have been taken into account are the nature of aqueous medium, Cu ion concentration, pH, temperature and flow condition. The studies include: immersion tests, spectrophotometric estimation of iron ions, pH monitoring, analysis of free Cu ions by atomic absorption spectrophotometer and electrochemical techniques like free corrosion potential measurements and potentiodynamic polarization measurements. The results of the study shall provide important information about the role of Cu carryover on the failure of components in desalination and power plant. 2. EXPERIMENTAL 2.1 Preparation of Specimens Commercial grade mild steel and AISI 304L SS were used for the immersion and electrochemical tests. For immersion tests coupons of dimension (4.0×3.2×0.13) cm were cut  Vol.9, No.12 Corrosion Behavior of Mild Steel and SS 304L 1115 from the sheet. To hold the specimens, a hole of 1.5 mm diameter was made near the edge. For electrochemical tests circular samples with 1.5 cm diameter were cut from the mild steel and SS 304L sheets. A conducting wire was spot welded to one face of the specimens for the electrical connection and the specimens were then mounted in a cold setting resin to provide a crevice free mount. The specimens were then machined and abraded on 180 grit SiC paper to simulate near service conditions. The abraded specimens were washed and degreased with ethyl alcohol and dried up. The composition of steels as analyzed by optical emission spectrophotometer is given in the Table 1. Table 1. Composition of steel as analyzed by optical emission spectrometer % Composition of elements Steel C Si Mn P S Cr Ni Mo Cu Fe Mild Steel 0.206 0.004 0.166 0.028 0.0440.078 0.088 0.114 0.052 Bal AISI 304L 0.048 0.440 1.587 0.028 0.00718.0027.635 0.353 0.326 Bal 2.1.2. Preparation of test solution The test solutions were made up with distilled water and artificial seawater. The composition of artificial seawater is given in Table 2 [12]. The solutions containing 1, 10, 20, 30, 40 and 100 ppm of Cu were prepared in distilled water and artificial seawater using analar grade CDH chemicals. The pH of the solutions was adjusted using NH4OH and CH3COOH. For test solution made up with distilled water a pH of 5.0, 6.5 and 8.5 was maintained whereas for the test solution made up with artificial seawater a pH of 8.2 was maintained. Table 2. Chemical composition of artificial seawater [12] Compound Concentration (g/l) NaCl 24.53 MgCl2 5.20 Na2SO4 4.09 CaCl2 1.16 KCl 0.695 NaHCO3 0.201 KBr 0.101 H3BO3 0.027 SrCl2 0.025 NaF 0.003  1116 M. Mobin and Hina Shabnam Vol.9, No.12 2.1.3. Immersion test procedures Immersion tests were performed in accordance with ASTM designation G31-72 (Re-approved 1990). After taking the initial weight and dimensions, the coupons were hanged in the test solution containing varying concentration of copper ions, with the help of a nylon thread. To avoid the galvanic and crevice corrosion the coupons were loosely tied with the nylon thread. A blank experiment was also carried out for the comparison purpose. The immersion tests were carried out under both static and dynamic condition. Under static condition, the tests runs were of 24, 360 and 720 hrs duration for mild steel and 720 and 4320 hrs durations for SS 304L. Under dynamic conditions the runs were of 24 hrs duration. After completion of the immersion test, the specimens were taken out and cleaned following ASTM designation G1-90 and observed for any localized attack. The average corrosion rate was determined using the following relationship: 534 () W Corrosionrate mpy A T ρ = Where, W= mass loss in mg; A= area in inch2; T = time of exposure in hrs and ρ= density in g/cm3 2.2. Solution Analysis of Metal Ion Corrosion rate of mild steel and SS 304L was also measured from the determination of total iron ions (Fe2+/Fe3+) entered into the test solution during the course of corrosion. The analysis was performed spectrophotometrically using single beam spectrophotometer. The corrosion rate was calculated using the following relationship: 21 [] m Corrosionrategm h st − − =× Where, ‘m’ is the mass of corroded metal (calculated from the total iron content determined in the test solution);‘s’ is the area of the test metal in m2; and ‘t’ is the exposure time in hrs. 2.3. Monitoring of pH The pH of the different test solutions containing mild steel and SS 304L samples was measured on daily basis. The pH measurement was continued till the entire period of immersion. 2.4. Estimation of Cu Ions in the Test Solution To observe the behavior of Cu on the corrosion of mild steel and SS 304L, the amount of copper present into the test solutions after the completion of immersion was estimated by using atomic absorption spectrophotometer.  Vol.9, No.12 Corrosion Behavior of Mild Steel and SS 304L 1117 2.5. Electrochemical Tests To investigate the effect of Cu on the corrosion behavior of mild steel and SS 304L electrochemical tests like free corrosion potential measurements and potentiodynamic polarization measurements were carried out. The tests were carried out in both distilled water and artificial seawater at room temperature. 2.5.1 Free corrosion potential measurements The free corrosion potential measurements (Ecorr) were carried out in presence and absence of Cu ions at room temperature under static condition. The change in voltage against SCE used as reference electrode was plotted vs. time. The steel specimen was connected to a wire having alligator clip on both the ends. One end of the alligator clip was attached to the steel specimen and placed into the test solution and other end was connected to multimeter. 2.5.2 Potentiodynamic polarization measurements The potentiodynamic polarization measurements were conducted on EG&G potentiostat/galvanostat Model 263A. The experiments were carried out using a corrosion cell from EG&G; model K 0047, with Ag/AgCl electrodes (saturated KCl) as reference and Pt wire as counter electrode. The potentiodynamic polarization measurements were carried out using a scan rate of 0.166mV commencing at a potential above 250mV more active than stable open circuit potential. To observe the effect of Cu in a given aqueous medium potentiodynamic curves were obtained using the same specimen under similar experimental condition except a periodic change in copper ion concentration. However, before starting the scanning at each concentration, the specimen was stabilized for about 1 hr for attaining a steady state which was shown by a stable potential. 3. RESULTS 3.1. Immersion Tests The corrosion rates of mild steel and SS 304L in both distilled water and artificial seawater at different experimental conditions as obtained by weight loss measurement technique are shown in Table 3 and 4. In distilled water, under static condition, there is no appreciable influence of Cu on the corrosion rate of mild steel except at 100 ppm of Cu concentration where a decrease in corrosion rate is observed. However, the decrease in corrosion rate in presence of 100ppm Cu appears to be more appreciable at pH 6.5 and 8.5. Under dynamic condition, in absence of Cu, the corrosion rate of the mild steel increases substantially. However, the presence of Cu ions causes a lowering in corrosion rate; the lowering in corrosion rate being more pronounced at 100 ppm Cu. In artificial seawater, the corrosion rate of mild steel increases slightly under both static and dynamic conditions. Under experimental conditions, SS 304L is unaffected in both distilled and artificial seawater. In general, there is negligible effect of copper on the corrosion rate of SS  1118 M. Mobin and Hina Shabnam Vol.9, No.12 304L at a pH range between 5-8.2 for an immersion period of 720 hrs and 4320 hrs in both distilled and artificial seawater. 3.2. Solution Analysis of Metal Ion The corrosion rate of mild steel and SS 304L in distilled water and artificial seawater was also measured by determining the total iron ions entered into the test solution during the course of immersion and the result is shown in Table 3 and 4. The corrosion rates as obtained by solvent analysis are consistent with corrosion rates determined by weight loss measurements. The iron analysis in the test solutions was also performed for SS 304L immersed in distilled water and artificial seawater. The results did not show any iron content in the test solution after completion of immersion. 3.3. Monitoring of pH The pH of the test solutions during the entire period of immersion was measured. Figure 1; show some representative plots of pH vs. exposure period. In case of mild steel immersed in distilled water containing varying concentration of Cu, except for the solution of pH 5.0 where a slight increase in pH during initial period of immersion was observed, there is no significant change in pH in the test solution maintained at pH 6.5 and 8.5. In case of SS 304L immersed in distilled water there was no appreciable change in pH in the solutions maintained at pH 5.0, 6.5 and 8.5. In artificial seawater the pH of the test solution remained almost constant during the entire period of immersion. 3.4. Estimation of Cu in the test solution The concentration of Cu present into the test solutions estimated after the completion of immersion is shown in Table 3 and 4. In case of mild steel immersed in distilled and artificial seawater the following behaviors are distinctly observed: (I) In the solutions containing lower concentration of Cu (up to 10 ppm) no Cu was detected at the end of immersion. (II) With Cu concentration exceeding 10 ppm appreciable amount of Cu remained into the solutions at the end of immersion. The amount of Cu increased with increasing pH and decreased with increasing exposure period. In case of 304L (III) immersed in distilled and artificial seawater nearly all the Cu ions added into the test solution remained unchanged and estimated by atomic absorption spectrophotometer  Vol.9, No.12 Corrosion Behavior of Mild Steel and SS 304L 1119 (a) (b) (c) (d) Fig.1: pH vs time plot in absence and presence of varying concentration of Cu ( 0 ppm Cu; 1ppm Cu; 10ppm Cu; × 20 ppm Cu; 30 ppm Cu; z 40ppm Cu; +100ppm Cu) for (a) mild steel in distilled water, pH 5.0 (b) mild steel in artificial seawater, pH 8.2 (c) SS 304L in distilled water, pH 5.0 (d) SS 304L in artificial seawater, pH 8.2.  1120 M. Mobin and Hina Shabnam Vol.9, No.12 Table 3. Effect of Cu on the corrosion rate of mild steel under different experimental conditions at room temperature Corrosion rate as obtained by weight loss measurements (mpy) Corrosion rate as determined by solvent analysis of iron ions ( mpy) Conc. Of Cu ions left over in the test solutions (ppm) Aqueous medium pH Flow condition Cu ions conc. (ppm) 24hrs 360hrs 720hrs 24hrs 360hrs 720hrs 24hrs 360hrs 720hrs Distilled water 5.0 Static 0 4.53 4.36 4.28 4.45 4.25 4.20 - - - „ 1 4.69 4.63 4.59 4.60 4.55 4.49 0.0 0.0 0.0 „ 10 4.71 4.69 4.60 4.69 4.60 4.55 0.0 0.0 0.0 „ 20 4.52 4.49 4.42 4.46 4.37 4.40 2.0 0.1 0.0 „ 30 4.46 4.36 4.27 4.39 4.18 4.10 7.0 0.9 0.0 „ 40 4.73 4.56 4.49 4.68 4.52 4.45 18.0 1.5 0.0 „ 100 4.11 4.04 3.94 4.06 3.80 3.70 13.0 2.4 0.4 Dynamic 0 51.7 - - 50.1 - - - - - „ 1 23.4 - - 22.3 - - - - - „ 100 18.1 - - 18.0 - - - - - 6.5 Static 0 3.19 3.07 2.84 3.07 2.89 2.63 - - - „ 1 3.28 3.19 2.91 3.19 2.97 2.71 0.0 0.0 0.0 „ 10 3.53 3.28 3.02 3.22 3.06 2.96 0.0 0.0 0.0 „ 20 2.83 2.65 2.47 2.83 2.79 2.40 6.0 0.4 0.0 „ 30 2.47 2.35 2.28 2.36 2.23 2.17 10.0 1.2 0.0 „ 40 2.96 2.54 2.49 2.71 2.36 2.40 20.0 2.0 0.0 „ 100 1.68 1.12 0.98 1.67 1.15 0.73 30.0 4.9 0.1 Dynamic 0 11.4 - - 10.31 - - - - - „ 1 10.1 - - 9.89 - - - - - „ 100 6.07 - - 5.93 - - - - - 8.5 Static 0 3.04 2.76 2.60 2.98 2.79 2.58 - - - „ 1 3.26 2.95 2.69 3.16 2.83 2.65 0.0 0.0 0.0 „ 10 3.58 3.27 2.72 3.55 3.06 2.80 0.0 0.0 0.0 „ 20 2.93 2.65 2.67 2.90 2.82 2.76 5.0 0.0 0.0 „ 30 2.85 2.74 2.49 2.77 2.65 2.38 19.0 1.8 0.0 „ 40 2.76 2.62 2.58 2.82 2.60 2.49 30.0 2.3 0.0 „ 100 1.81 1.05 0.86 1.81 1.30 0.66 50.0 7.0 0.2 Dynamic 0 13.54 - - 12.96 - - - - - „ 1 15.02 - - 16.72 - - - - - „ 100 12.42 - - 11.70 - - - - - Artificial seawater 8.2 Static 0 3.17 2.97 2.48 3.09 3.01 2.64 - - - „ 1 3.56 3.22 2.96 3.49 3.32 2.90 0.0 0.0 0.0 „ 10 3.73 3.54 3,29 3.56 3.65 3.06 2.1 0.9 0.0 „ 20 3.86 3.63 3.42 3.84 3.80 3.27 8.9 1.5 0.2 „ 30 3.99 3.90 3.67 3.90 3.76 3.53 12.7 5.3 0.9 „ 40 4.05 3.88 3.73 3.99 3.80 3.65 29.1 10.4 5.3 „ 100 3.99 3.76 3.48 3.86 3.70 3.49 63.5 14.7 3.2 Dynamic 0 23.57 - - 22.49 - - - - - „ 1 28.42 - - 26.48 - - - - - „ 100 33.01 - - 32.06 - - - - - 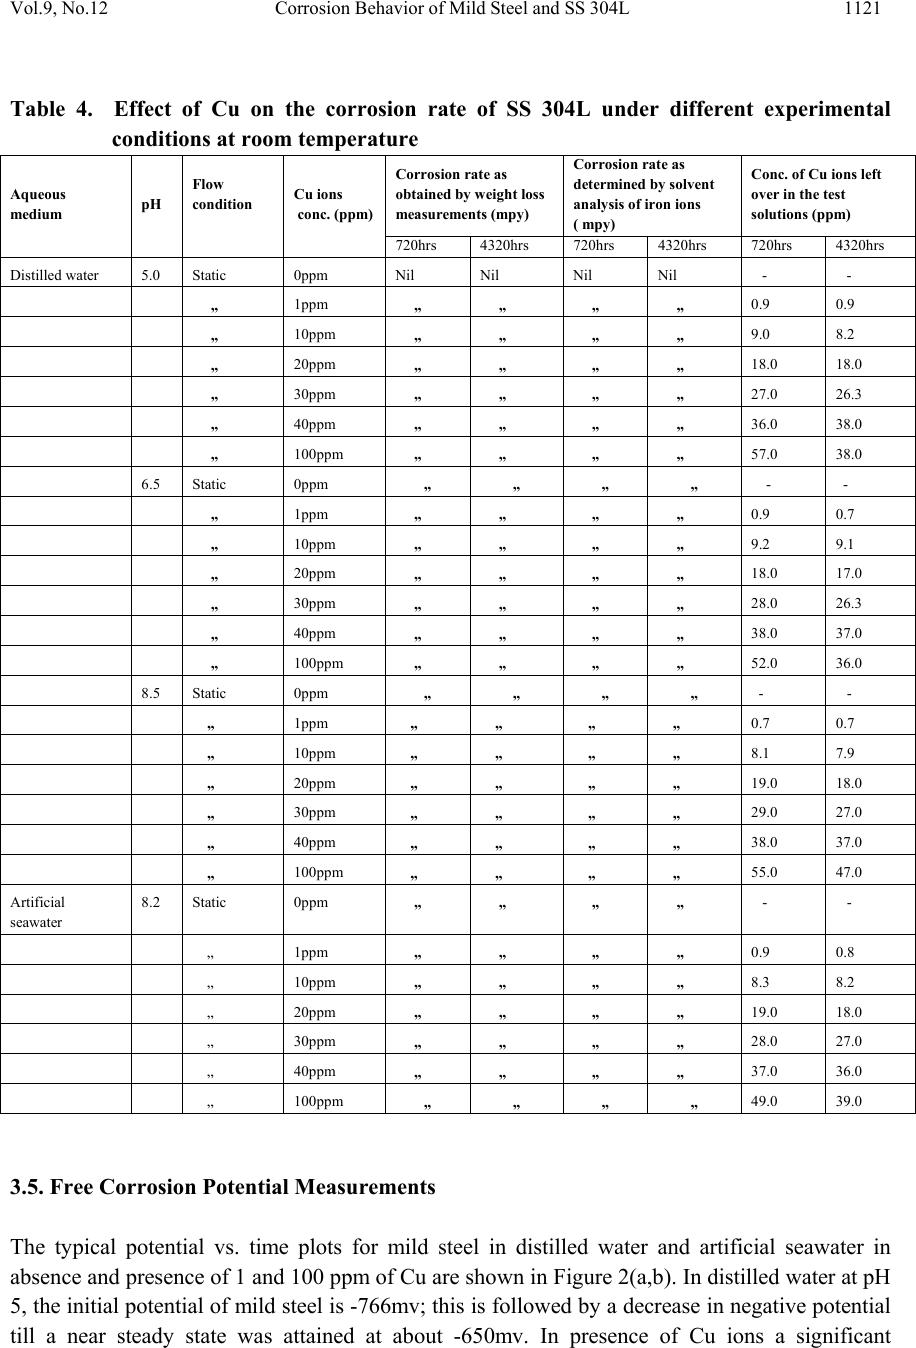 Vol.9, No.12 Corrosion Behavior of Mild Steel and SS 304L 1121 Table 4. Effect of Cu on the corrosion rate of SS 304L under different experimental conditions at room temperature Corrosion rate as obtained by weight loss measurements (mpy) Corrosion rate as determined by solvent analysis of iron ions ( mpy) Conc. of Cu ions left over in the test solutions (ppm) Aqueous medium pH Flow condition Cu ions conc. (ppm) 720hrs 4320hrs 720hrs 4320hrs 720hrs 4320hrs Distilled water 5.0 Static 0ppm Nil Nil Nil Nil - - „ 1ppm „ „ „ „ 0.9 0.9 „ 10ppm „ „ „ „ 9.0 8.2 „ 20ppm „ „ „ „ 18.0 18.0 „ 30ppm „ „ „ „ 27.0 26.3 „ 40ppm „ „ „ „ 36.0 38.0 „ 100ppm „ „ „ „ 57.0 38.0 6.5 Static 0ppm „ „ „ „ - - „ 1ppm „ „ „ „ 0.9 0.7 „ 10ppm „ „ „ „ 9.2 9.1 „ 20ppm „ „ „ „ 18.0 17.0 „ 30ppm „ „ „ „ 28.0 26.3 „ 40ppm „ „ „ „ 38.0 37.0 „ 100ppm „ „ „ „ 52.0 36.0 8.5 Static 0ppm „ „ „ „ - - „ 1ppm „ „ „ „ 0.7 0.7 „ 10ppm „ „ „ „ 8.1 7.9 „ 20ppm „ „ „ „ 19.0 18.0 „ 30ppm „ „ „ „ 29.0 27.0 „ 40ppm „ „ „ „ 38.0 37.0 „ 100ppm „ „ „ „ 55.0 47.0 Artificial seawater 8.2 Static 0ppm „ „ „ „ - - „ 1ppm „ „ „ „ 0.9 0.8 „ 10ppm „ „ „ „ 8.3 8.2 „ 20ppm „ „ „ „ 19.0 18.0 „ 30ppm „ „ „ „ 28.0 27.0 „ 40ppm „ „ „ „ 37.0 36.0 „ 100ppm „ „ „ „ 49.0 39.0 3.5. Free Corrosion Potential Measurements The typical potential vs. time plots for mild steel in distilled water and artificial seawater in absence and presence of 1 and 100 ppm of Cu are shown in Figure 2(a,b). In distilled water at pH 5, the initial potential of mild steel is -766mv; this is followed by a decrease in negative potential till a near steady state was attained at about -650mv. In presence of Cu ions a significant 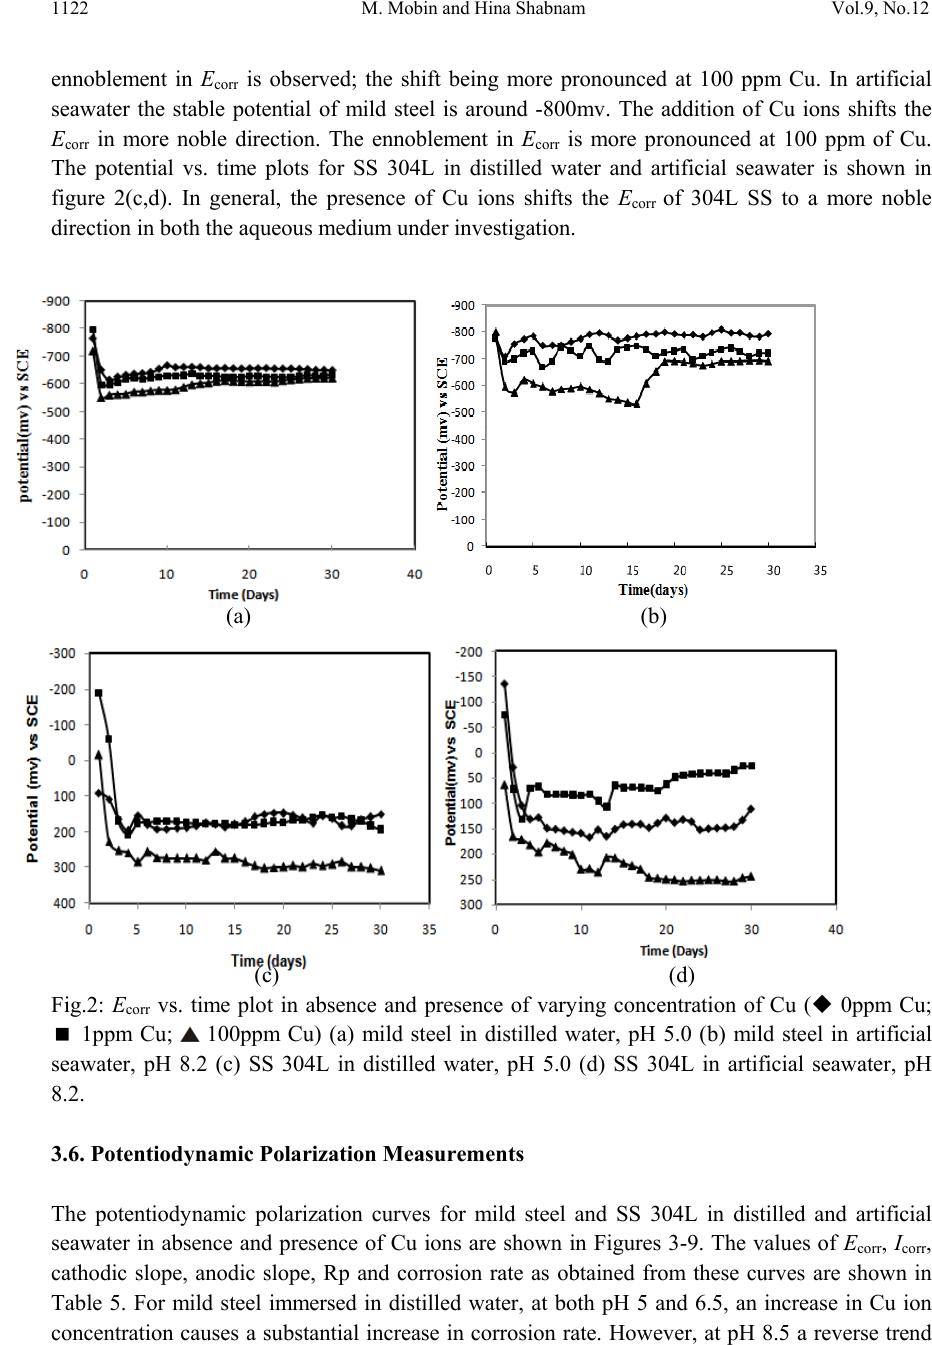 1122 M. Mobin and Hina Shabnam Vol.9, No.12 ennoblement in Ecor r is observed; the shift being more pronounced at 100 ppm Cu. In artificial seawater the stable potential of mild steel is around -800mv. The addition of Cu ions shifts the Ecor r in more noble direction. The ennoblement in Ecorr is more pronounced at 100 ppm of Cu. The potential vs. time plots for SS 304L in distilled water and artificial seawater is shown in figure 2(c,d). In general, the presence of Cu ions shifts the Ecorr of 304L SS to a more noble direction in both the aqueous medium under investigation. (a) (b) (c) (d) Fig.2: Ecor r vs. time plot in absence and presence of varying concentration of Cu ( 0ppm Cu; 1ppm Cu; 100ppm Cu) (a) mild steel in distilled water, pH 5.0 (b) mild steel in artificial seawater, pH 8.2 (c) SS 304L in distilled water, pH 5.0 (d) SS 304L in artificial seawater, pH 8.2. 3.6. Potentiodynamic Polarization Measurements The potentiodynamic polarization curves for mild steel and SS 304L in distilled and artificial seawater in absence and presence of Cu ions are shown in Figures 3-9. The values of Eco rr, Icorr, cathodic slope, anodic slope, Rp and corrosion rate as obtained from these curves are shown in Table 5. For mild steel immersed in distilled water, at both pH 5 and 6.5, an increase in Cu ion concentration causes a substantial increase in corrosion rate. However, at pH 8.5 a reverse trend 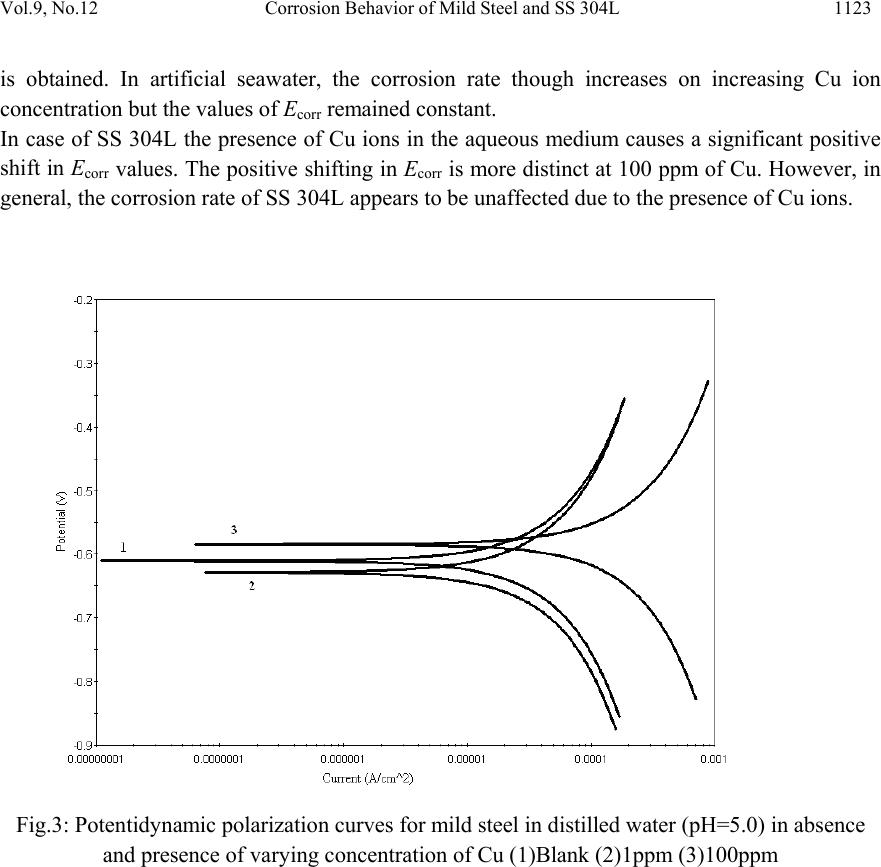 Vol.9, No.12 Corrosion Behavior of Mild Steel and SS 304L 1123 is obtained. In artificial seawater, the corrosion rate though increases on increasing Cu ion concentration but the values of Ecorr remained constant. In case of SS 304L the presence of Cu ions in the aqueous medium causes a significant positive shift in Ecorr values. The positive shifting in Ecorr is more distinct at 100 ppm of Cu. However, in general, the corrosion rate of SS 304L appears to be unaffected due to the presence of Cu ions. Fig.3: Potentidynamic polarization curves for mild steel in distilled water (pH=5.0) in absence and presence of varying concentration of Cu (1)Blank (2)1ppm (3)100ppm 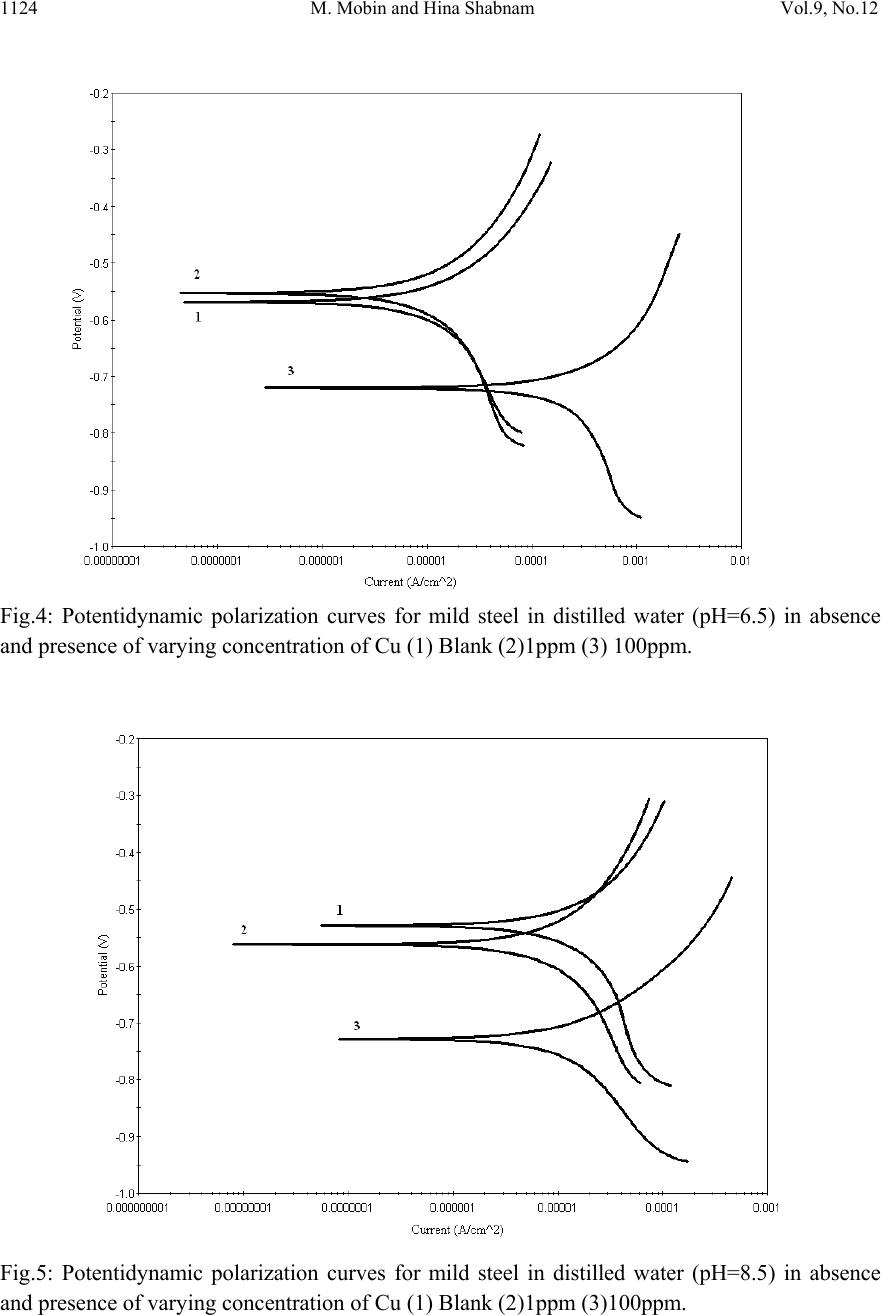 1124 M. Mobin and Hina Shabnam Vol.9, No.12 Fig.4: Potentidynamic polarization curves for mild steel in distilled water (pH=6.5) in absence and presence of varying concentration of Cu (1) Blank (2)1ppm (3) 100ppm. Fig.5: Potentidynamic polarization curves for mild steel in distilled water (pH=8.5) in absence and presence of varying concentration of Cu (1) Blank (2)1ppm (3)100ppm.  Vol.9, No.12 Corrosion Behavior of Mild Steel and SS 304L 1125 Fig.6: Potentidynamic polarization curves for mild steel in artificial seawater (pH=8.2) in absence and presence of varying concentration of Cu (1) Blank (2) 1ppm (3)100ppm. Fig.7: Potentidynamic polarization curves for SS 304L steel in distilled water (pH=5.0) in absence and presence of varying concentration of Cu (1)Blank (2)1ppm (3)100ppm  1126 M. Mobin and Hina Shabnam Vol.9, No.12 Fig.8: Potentidynamic polarization curves for SS 304Lsteel in distilled water (pH=6.5) in absence and presence of varying concentration of Cu (1) Blank (2) 1ppm (3)100ppm. Figure 9: Potentidynamic polarization curves for SS 304L in distilled water (pH=8.5) in absence and presence of varying concentration of Cu (1)Blank (2)1ppm (3)100ppm.  Vol.9, No.12 Corrosion Behavior of Mild Steel and SS 304L 1127 Table 5. Corrosion parameters for mild steel and SS 304L in distilled water and artificial seawater as obtained by potentiodynamic polarization measurements. Alloy Aqueous medium pH Cu ions conc. (ppm) Ecorr (mv) Icorr (A/cm2) βc (mv) βa (mv) Rp (ohm- cm2) Corrosion rate (mpy) Mild steel Distilled water 5.0 0ppm -610 4.7×10⁻⁴ 3560.56 2705.49 1.42×10³ 107.7 1 ppm -628 2.4×10⁻⁴ 1891.23 1562.81 1.53×10³ 55.3 100ppm -584 1.1×10⁻³ 2560.83 1339.78 3.2×10² 269.2 6.5 0ppm -568 5.5×10⁻⁵ 2714.92 428.197 2.9×10³ 12.7 1ppm -552 5.1×10⁻⁵ 1584.76 569.46 3.5×10³ 11.9 100ppm -720 9.4×10⁻⁴ 2032.00 433.44 1.4×10² 216.0 8.5 0ppm -528 1.0×10⁻⁴ 10081.6 721.17 2.9×10³ 24.2 1ppm -562 8.3×10⁻⁵ 3932.02 1031.30 4.2×10³ 19.0 100ppm -728 2.6×10⁻⁵ 424.13 209.77 2.3×10³ 5.9 Artificial seawater 8.2 0ppm -849 2.8×10⁻⁵ 241.02 149.41 1.4×10³ 6.5 1ppm -831 1.9×10⁻⁵ 154.50 93.23 1.3×10³ 4.3 100ppm -818 3.2×10⁻⁵ 240.18 86.56 8.6×10² 7.5 SS 304L Distilled water 5.0 0ppm -102 2.5×10⁻⁶ 186.40 679.15 2.5×10⁴ 0.59 1ppm -98 2.4×10⁻⁶ 220.61 578.50 2.8×10⁴ 0.56 100ppm -13 3.6×10⁻⁶ 211.38 876.15 2.0×10⁴ 0.83 6.5 0ppm -151 1.0×10⁻⁷ 95.7 561.31 3.3×10⁵ 0.024 1ppm +29 2.4×10⁻⁷ 131.39 889.06 2.0×10⁵ 0.055 100ppm +69 7.9×10⁻⁶ 133.78 992.10 5.1×10⁴ 1.8 8.5 0ppm -97 1.3×10⁻⁷ 119.41 601.09 3.5×10⁵ 0.031 1ppm -149 8.7×10⁻⁸ 96.06 502.86 4.0×10⁵ 0.020 100ppm +74 1.8×10⁻⁷ 127.35 808.06 2.6×10⁵ 0.041 4. DISCUSSION The effect of copper ions on corrosion behavior of mild steel and SS 304L in both distilled and artificial seawater was studied at room temperature under both static and dynamic conditions using weight loss and electrochemical techniques. The influence of different environmental variables such as pH, flow velocity, presence of oxidizers, etc on the corrosion rate of metals is  1128 M. Mobin and Hina Shabnam Vol.9, No.12 quite complex and depends upon the characteristics of metal and environment to which it is exposed [13]. For mild steel corrosion there is a complex dependence of corrosion rate on pH. In pH range 5-9 (near neutral pH range) the direct role of pH on the corrosion rate of steel has not been established [14]. In aerated solutions, under static condition, in near neutral pH range the major reactions controlling corrosion process is the reduction of dissolved O2 and other oxidizers, if any, present into the solution. Further, the corrosion processes that are controlled by activation polarization the dynamic condition (solution agitation) have no effect on the corrosion rate. However, if the corrosion process is under cathodic diffusion control, the dynamic condition increases the corrosion rate. Considering the present investigation, under static condition at room temperature, the pH range selected for the study is unlikely to affect the corrosion rate of mild steel. A variation in the corrosion rate of mild steel is expected to be caused by the presence of Cu ions present into the solution and also the solution composition. Under dynamic conditions, in addition to the above factors, the amount of solution agitation is also likely to influence the corrosion rate. For mild steel immersed in distilled water, the corrosion process under the experimental conditions is controlled by cathodic diffusion and the dynamic condition is expected to cause an increase in corrosion rate. The result of immersion in absence of Cu, show a large increase in corrosion rate of mild steel under dynamic condition. In presence of Cu ions the corrosion process is reversed and a large decreased in corrosion rate is observed. Under static condition, a lower concentration of Cu (< 20 ppm) causes a slight increase in the corrosion rate. However, as the Cu concentration is increased in the solution a decreasing trend in the corrosion rate is observed. An increase in the corrosion rate at lower concentration of Cu is attributed to the additional cathodic reaction involving the reduction of Cu ions in addition to the reduction of the dissolved oxygen. A decrease in the corrosion rate with increasing Cu concentration may be due to the deposition of reduced Cu on the steel surface which forms a protective barrier against further oxidation of steel. In presence of Cu2+ the redox reaction taking place at the steel surface may be written as follows: Cu2+ + Fe →Cu + Fe2+ Consequently, the metallic Cu formed a protective film on the steel surface. Since the electrode potential of Cu (Ecu2+/cu) is greater than electrode potential of Fe (Fe2+/Fe) the film protected the steel efficiently and caused a decrease in corrosion rate. When Cu concentration reached to a certain value, the above reaction moved forcefully from left to right, and a greater amount of Cu metal is formed on the steel surface [15]. As a result, the Cu film thickened quickly and a part of the film is detached from the steel surface. Some particulates of Cu were observed in the solutions containing higher concentrations of Cu. Further, a good amount of Cu ions do not participate in the reduction reaction and remained present into the solutions. The estimation of large amount of Cu ions in the test solutions at the end of the immersion supports the above observation. Under dynamic condition, a large decrease in the corrosion rate in presence of Cu ions is attributed to the formation of a stable passive film on the steel surface. Under dynamic condition there appears to be a competition between oxygen and Cu ions and the passive film formed at the substrate is more stable due to the availability of enough oxygen at the  Vol.9, No.12 Corrosion Behavior of Mild Steel and SS 304L 1129 steel/solution interface. The observed increase in corrosion rate of mild steel in artificial seawater under dynamic condition is due to the absence of passive film on the substrate. Considering the results of immersion for SS 304L in both distilled and artificial seawater there is no effect of Cu on the corrosion rate. The results of corrosion rate as estimated by solvent analysis of iron ions is consistent with the results obtained by the weight loss measurements. The results of immersion tests find support from free corrosion potential measurements. In presence of higher concentration of Cu there is significant ennoblement in the Ecorr of mild steel and SS 304L suggesting the protective role of Cu. Considering the results of potentiodynamic polarization measurements, in general, the corrosion rate of mild steel increases with increasing Cu concentration. At pH 5, in presence of 1ppm of Cu there was a cathodic shift in Ecorr making the steel surface more active. However, a lower value of Icorr resulted in the lowering in corrosion rate. At 100 ppm Cu, though there was an anodic shift in Ecorr making the steel surface nobler, an increase in the Icorr value caused a substantial increase in the corrosion rate. The corrosion parameters as obtained by the potentiodynamic polarization measurements are instantaneous and increase in the corrosion rate with increasing Cu concentration can be explained on the basis of additional cathodic reaction involving the reduction of Cu ions and rapid measurements of rate of electron transfer reactions. For SS 304L, the corrosion parameters as derived from potentiodynamic polarization curves show a positive shift in Ecorr values in presence of Cu ions. As a result the metal surface becomes still nobler. 5. CONCLUSIONS 1. The microscopic examination of the mild steel and SS 304L coupons subjected to immersion in distilled and artificial seawater did not show any evidence of localized attack (pitting corrosion) in presence of different concentration of Cu ions. 2. The results of immersion tests showed a decrease in the corrosion rate of mild steel with increasing Cu concentration. This is attributed to the deposition of reduced Cu on the steel surface which protected the steel efficiently and caused a decrease in corrosion rate. 3. SS 304L is unaffected in both distilled and artificial seawater and presence of Cu in the medium showed no effect on the corrosion rate. 4. The results of immersion tests find support from free corrosion potential measurements. In presence of higher concentration of Cu there is significant ennoblement in the Ecorr of mild steel and SS 304L suggesting the protective role of Cu. 5. The corrosion parameters as derived from potentiodynamic polarization measurements showed an increase in the corrosion rate of mild steel with increasing Cu concentration. This is explained on the basis of instantaneous measurement of the corrosion parameters and rapid of rate of electron transfer reactions.  1130 M. Mobin and Hina Shabnam Vol.9, No.12 REFERENCES [1] Malik, A.U., Kutty, P.C.M., Andijani, I.N. and Al-Fozan, S.A., Materials Performance and Failure Evaluation in SWCC MSF Plants, Desalination, 97, p.171. (1994). [2] Asphahani, A.I. and Silence, W.L., Metal Hand Book: ASME Publication. 13 p. 113. (1987). [3] Internal Corrosion of Water Distribution System: Cooperative Research Report, American Water Work Association and DVGW-for Schungsteus, p. 191. (1985) [4] Schrieber, C.F., Measurement and Control Related Corrosion and Scales in Water Desalination Installation in Measurement of Control in Water Desalination, p. 427. (1986). [5] L. Kenworthy, The Problems of Copper and Galvanized Iron in Water System, J. Inst. Metals. (1943). [6] H. Guise, Dissolved copper effect on iron pipe, J.AWWA, 63, p.79. (1971). [7] G.P. Treweek, R.R. Trusell and R.D. Pomeroy, Copper induced corrosion of galvanized steel pipe, in Proc. 6th Water Technology Conference, Louisville, AWWA, Denver, (1978). [8] L. Grrasha, W. Rinse and M. Davis, Corrosive Effect of Dissolved Copper on Galvanized Steel, Phase-II, Internal Report, Metropolitan Water District of S.C., (1981). [9] A.U. Malik and M.A.K. Al-Sofi, Private communication, (1995). [10] E.A. Al-Sums, S. Aziz, A. Al-Radif, M.S. Said and O. Heikel, Vapor side corrosion of copper base condenser tubes of the MSF desalination plants of Abu Dhabi, Desalination, 97, p.109. (1994). [11] J. Otaker, Developing Steam purity limits, Power, New York, (1989). [12] ASTM D1141, Standard Specification for Substitute Ocean Water in Annual Book of ASTM Standards 4.08, ASM International, PA (1996). [13] M.G. Fontana, Corrosion Engineering, Tata McGraw-Hill Publishing Company Ltd, New Delhi, p. 63. (2006). [14] Metal Handbook, ASM International, Vol. 13, Corrosion, 9th ed., p. 38. (1987). [15] T.Gu, Z.Huang, Coll. Surf. 40, p.71. (1989). |