Paper Menu >>
Journal Menu >>
 Journal of Minera ls & Materials Ch ar ac teri zatio n & Engineeri ng, Vol. 9, No.12, pp.1087-1100, 2010 jmmce.org Printed in the USA. All rights reserved 1087 An Experimental Study on Mechanical and Fracture Behavior of Phosphoric Iron A. K. Vishnoia*, B.K. Mishraa, S. Prakashb a Department of Mechanical and Industrial Engineering, IIT Roorkee, India b Department of Metallurgical and Materials Engineering, IIT Roorkee, India *Corresponding Author: amitvishnoi.iitr@gmail.com ABSTRACT Phosphoric iron of two different phosphorus content, namely P1 (Fe-0.30P-0.226C), P2 (Fe- 0.11P-.028C) were first prepared by ingot casting route. The ingot were soaked and forged at 1150oC. The microstructures of the phosphoric iron and its relevant mechanica l properties such as hardness and tensile properties have been cha racterized. J-R curves o f th e m ateri al have b een determined at room temperature. Fracture behaviour under tearing load has been studied through fracture toughness tests on phosphoric iron using Compact Tension (CT) specimens of Width (W) =50 mm and thickness (B) =12.5mm. J-R curves were obtained from specimens pre- cracked to a/W = 0.5 .The single specimen unloading compliance method have been used for generating J-R curves. 1. INTRODUCTION Simple fracture is the separation of body into two pieces in response to the applied stresses. The applied stresses may be tensile, compressive, shear or torsional or a combination of them. Fracture of engineering structures is one of the most dreadful failures of the structural materials as it involves human lives and the structures itself. The problem of fracture has been greatly increased due to the amplified use of complex structures. As a result, extensive investigation were initiated in many countries and the work revealed that pre-existing flaws or high stress concentration region present in structure could initiate the crack and the propagation of such crack lead to the final fracture of the component or structure. The corrosion behaviour of iron containing high phosphorous or phosphoric irons is an unexplored area of corrosion science and engineering. Recent research work on Delhi Iron Pillar [1-4], a good example of high phosphorus containing iron, has revealed some of its corrosion resistance properties. Research on Delhi Iron Pillar (DIP) provided the current impetus to  1088 A. K. Vishnoi, B.K. Mishra, S. Prakash Vol.9, No.12 understand the corrosion behaviour of Fe-P alloy. The average composition of phosphorous in the DIP is about 0.25 wt%, while that of carbon is 0.15 % [2]. Irons, containing phosphorous contents of this order have been subjected to research by Balasubrahmaniyam et al [5]. His group has studied the corrosion properties of phosphoric iron manufactured by the ingot route [5]. Phosphorus increases the yield and ultimate tensile strengths with a corresponding reduction in ductility as measured by elongation and reduction in area, to a point where brittle failure occurs. This loss of ductility occurs during prolonged exposure of steel in the temperature range of 250- 6000C [6-9]. This condition is frequently encountered in tempering of steel. Hence it is called temper embrittlement. Phosphorous increases the ductile to brittle transition temperature of steel. It causes brittleness in steel during cold working [10-12]. In present work, an attempt has been made to determine the mechanical properties and fracture behaviour of phosphoric iron for two different phosphorus content, namely P1 (Fe-0.30P- 0.226C), P2 (Fe-0.11P-.028C). 2. EXPERIMENTAL PROCEDURE 2.1 Materials The materials used for the present investigation are the two compositions of phosphoric iron. The phosphoric irons were produced by ingot casting. For obtaining 1 kg of phosphoric iron containing 0.1 % P, we require 0.001 kg P. For obtaining 50 kg phosphoric iron with 0.1 % P, we require 0.050 kg P = 50 gm P. As 0.176 kg P is present in 1 kg Fe-P alloy, 0.050 kg P is present in 0.050/0.176 = 284 gm Fe-P = 0.284 kg of Ferro-phosphorous alloy. Similarly, for obtaining 0.3 % P, we require 0.003 kg P. For obtaining 50 kg phosphoric iron with 0.3 % P, we require 0.150 kg P = 150 gm P. As 0.176 kg P is present in 1 kg Fe-P alloy, 0.150 kg P is present in 0.150/0.176 = 852 gm Fe-P = 0.852 kg of ferro-phosphorous alloy. 2.1.1 Melting and casting Utilizing a high frequency induction-melting furnace of 300 Kg capacity, 100 Kg of soft iron was first melted. To the molten iron, initially 25 Kg of steel scrap was added. During melting, slag covered the melt. Some of this slag was removed from the top of the melt. After proper melting of soft iron and steel scrap, approximately one third of the meet was transferred to a ladle, which was in the form of bucket of about 1.5 feet height. As per the calculations, the required amount of Fe-P mother alloy was added during taping of the melt into the ladle. Finally, the melt from the ladle was poured from the top side into a square mould, 50 cm height and 100cm square cross-section. 2.1.2 Reheating and soaking A high temperature furnace was used for reheating the ingots and soaking at desired temperature (11500C). The ingots were placed in the furnace and the furnace was then heated. It took about 5 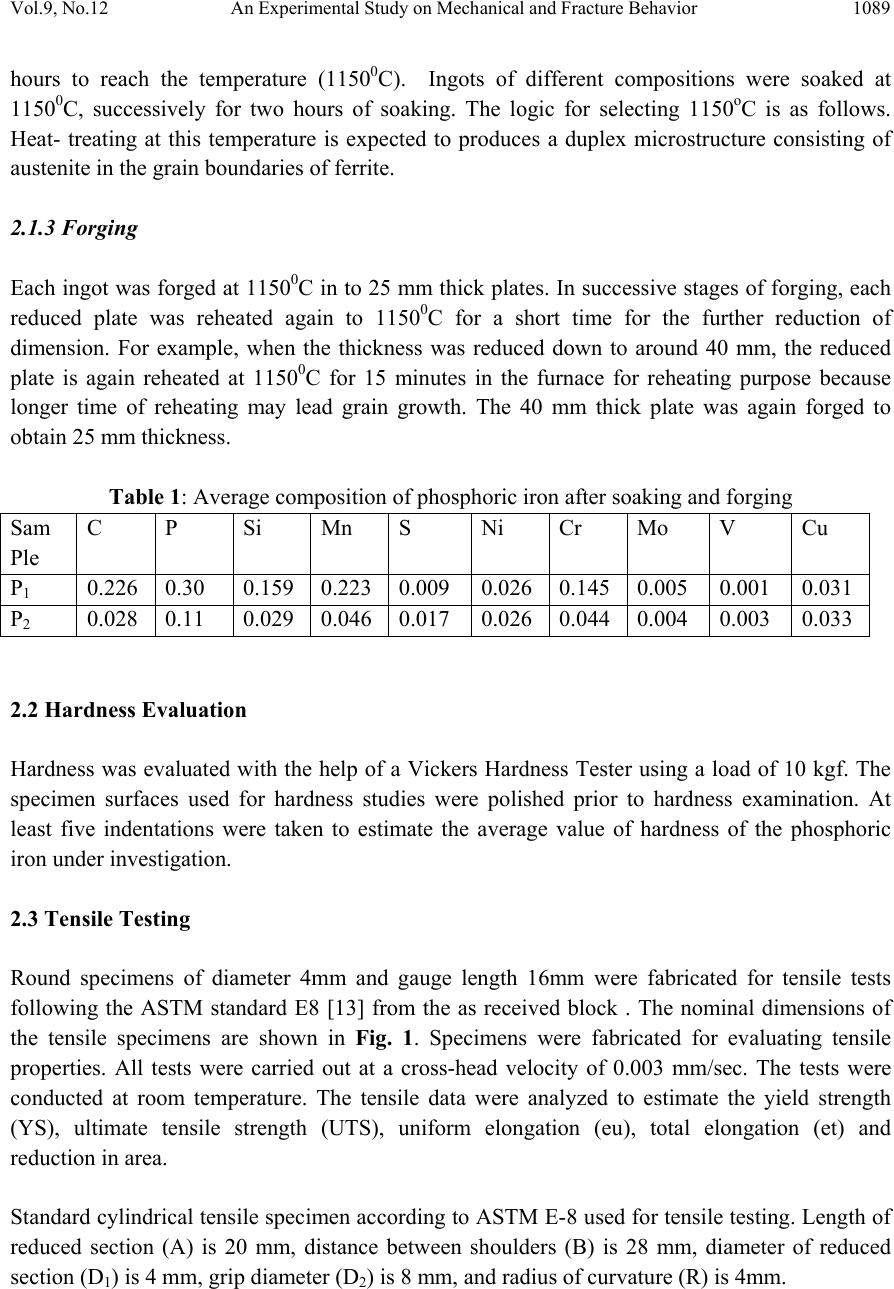 Vol.9, No.12 An Experimental Study on Mechanical and Fracture Behavior 1089 hours to reach the temperature (11500C). Ingots of different compositions were soaked at 11500C, successively for two hours of soaking. The logic for selecting 1150oC is as follows. Heat- treating at this temperature is expected to produces a duplex microstructure consisting of austenite in the grain boundaries of ferrite. 2.1.3 Forging Each ingot was forged at 11500C in to 25 mm thick plates. In successive stages of forging, each reduced plate was reheated again to 11500C for a short time for the further reduction of dimension. For example, when the thickness was reduced down to around 40 mm, the reduced plate is again reheated at 11500C for 15 minutes in the furnace for reheating purpose because longer time of reheating may lead grain growth. The 40 mm thick plate was again forged to obtain 25 mm thickness. Table 1: Average composition of phosphoric iron after soaking and forging Sam Ple C P Si Mn S Ni Cr Mo V Cu P1 0.226 0.30 0.159 0.223 0.009 0.026 0.145 0.005 0.001 0.031 P2 0.028 0.11 0.029 0.046 0.017 0.026 0.044 0.004 0.003 0.033 2.2 Hardness Evaluation Hardness was evaluated with the help of a Vickers Hardness Tester using a load of 10 kgf. The specimen surfaces used for hardness studies were polished prior to hardness examination. At least five indentations were taken to estimate the average value of hardness of the phosphoric iron under investigation. 2.3 Tensile Testing Round specimens of diameter 4mm and gauge length 16mm were fabricated for tensile tests following the ASTM standard E8 [13] from the as received block . The nominal dimensions of the tensile specimens are shown in Fig. 1. Specimens were fabricated for evaluating tensile properties. All tests were carried out at a cross-head velocity of 0.003 mm/sec. The tests were conducted at room temperature. The tensile data were analyzed to estimate the yield strength (YS), ultimate tensile strength (UTS), uniform elongation (eu), total elongation (et) and reduction in area. Standard cylindrical tensile specimen according to ASTM E-8 used for tensile testing. Length of reduced section (A) is 20 mm, distance between shoulders (B) is 28 mm, diameter of reduced section (D1) is 4 mm, grip diameter (D2) is 8 mm, and radius of curvature (R) is 4mm. 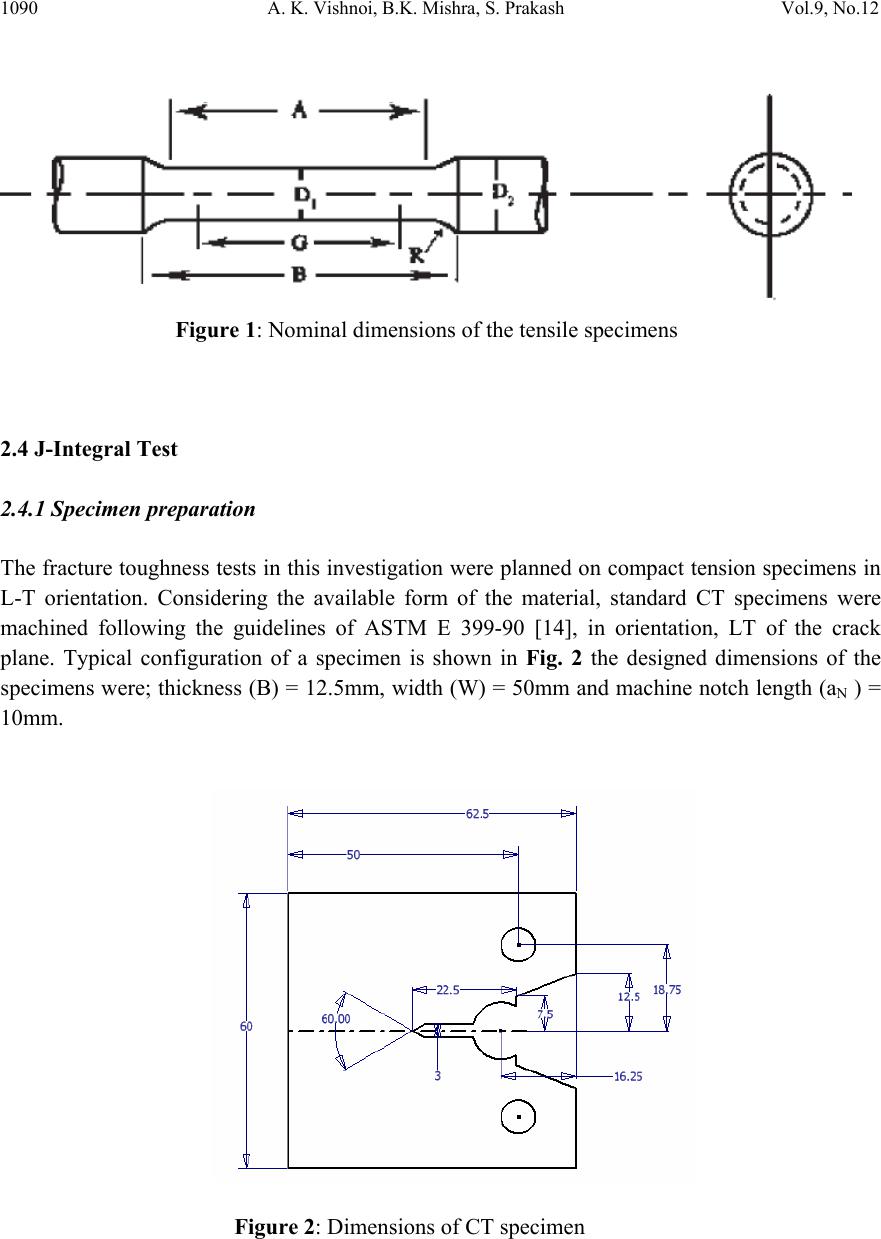 1090 A. K. Vishnoi, B.K. Mishra, S. Prakash Vol.9, No.12 Figure 1: Nominal dimensions of the tensile specimens 2.4 J-Integral Test 2.4.1 Specimen preparation The fracture toughness tests in this investigation were planned on compact tension specimens in L-T orientation. Considering the available form of the material, standard CT specimens were machined following the guidelines of ASTM E 399-90 [14], in orientation, LT of the crack plane. Typical configuration of a specimen is shown in Fig. 2 the designed dimensions of the specimens were; thickness (B) = 12.5mm, width (W) = 50mm and machine notch length (aN ) = 10mm. Figure 2: Dimensions of CT specimen 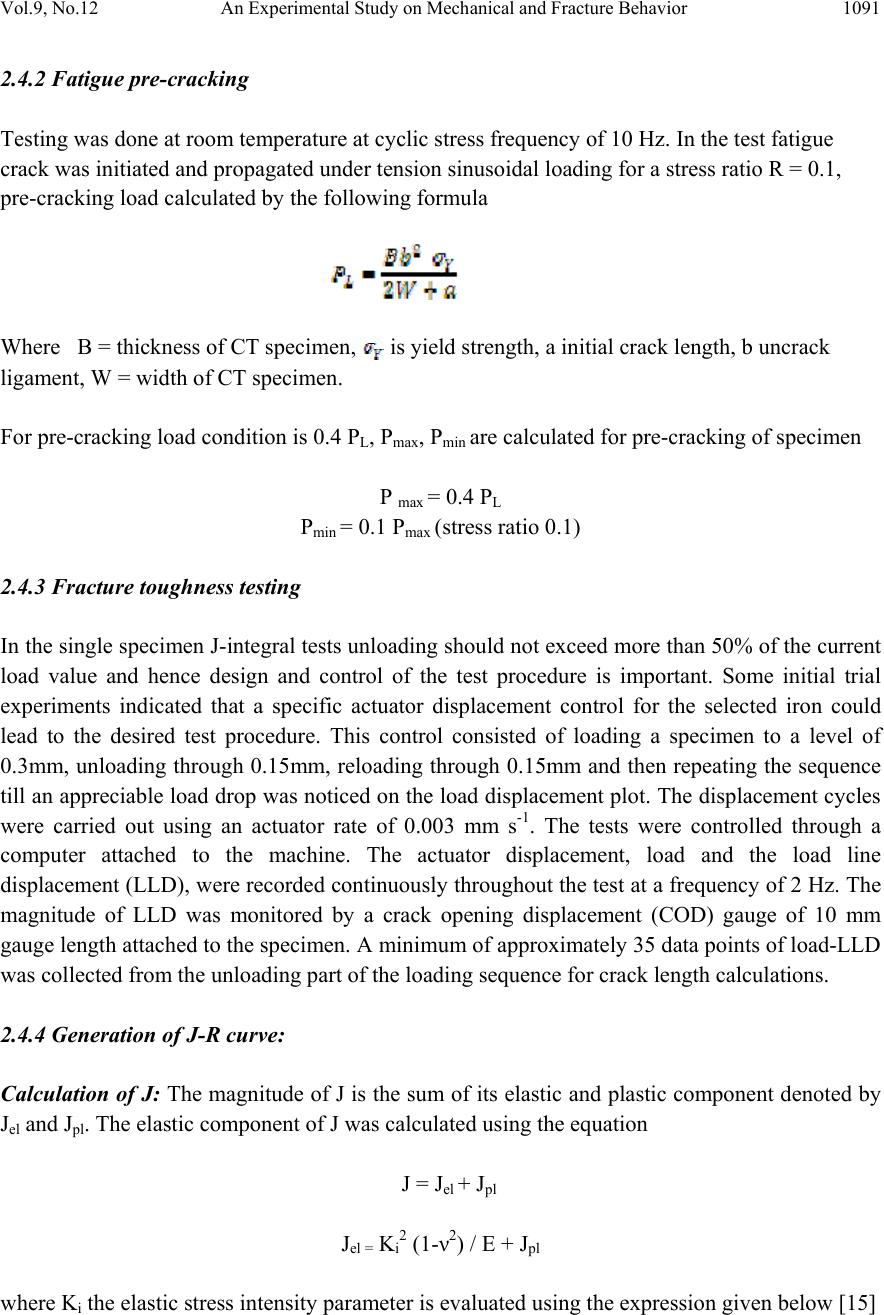 Vol.9, No.12 An Experimental Study on Mechanical and Fracture Behavior 1091 2.4.2 Fatigue pre-cracking Testing was done at room temperature at cyclic stress frequency of 10 Hz. In the test fatigue crack was initiated and propagated under tension sinusoidal loading for a stress ratio R = 0.1, pre-cracking load calculated by the following formula Where B = thickness of CT specimen, is yield strength, a initial crack length, b uncrack ligament, W = width of CT specimen. For pre-cracking load condition is 0.4 PL, Pmax, Pmin are calculated for pre-cracking of specimen P max = 0.4 PL Pmin = 0.1 Pmax (stress ratio 0.1) 2.4.3 Fracture toughness testing In the single specimen J-integral tests unloading should not exceed more than 50% of the current load value and hence design and control of the test procedure is important. Some initial trial experiments indicated that a specific actuator displacement control for the selected iron could lead to the desired test procedure. This control consisted of loading a specimen to a level of 0.3mm, unloading through 0.15mm, reloading through 0.15mm and then repeating the sequence till an appreciable load drop was noticed on the load displacement plot. The displacement cycles were carried out using an actuator rate of 0.003 mm s-1. The tests were controlled through a computer attached to the machine. The actuator displacement, load and the load line displacement (LLD), were recorded continuously throughout the test at a frequency of 2 Hz. The magnitude of LLD was monitored by a crack opening displacement (COD) gauge of 10 mm gauge length attached to the specimen. A minimum of approximately 35 data points of load-LLD was collected from the unloading part of the loading sequence for crack length calculations. 2.4.4 Generation of J-R curve: Calculation of J: The magnitude of J is the sum of its elastic and plastic component denoted by Jel and Jpl. The elastic component of J was calculated using the equation J = Jel + Jpl Jel = Ki2 (1-ν2) / E + Jpl where Ki the elastic stress intensity parameter is evaluated using the expression given below [15]  1092 A. K. Vishnoi, B.K. Mishra, S. Prakash Vol.9, No.12 The magnitude Jpl of was calculated by considering only load vs. plastic load line displacement. In order to obtain the latter, the elastic part of displacement at different loads was first calculated from the slope of the initial load-LLD diagram. A simple subtraction of the elastic component from the total displacement yielded the plastic part of LLD. The area under the load vs. plastic LLD data from the start of the test to the load of interest was calculated to obtain the magnitude of .This was done by using the expression [16] where , The quantity is the increment of plastic area under the force versus plastic load- line displacement record between lines of constant displacement at points i-1 and i. The quantity represents the total crack growth corrected plastic J at point i and is obtained in two steps by first incrementing the existing and then by modifying the total accumulated result to account for the crack growth increment .Accurate evaluation of from the above relationship requires small and uniform crack growth increments consistent with the suggested elastic compliance spacing .The quantity can be calculated from the following equation. where, Vpl(i) = plastic part of the load-line displacement, V(i) – (P(i) CLL(i), and CLL(i) = experimental compliance, (∆V/∆P), corresponding to current crack size 2.4.5 Calculation of crack size: The inverse of the slope yielded the compliance (Ci) of the specimen corresponding to the load from which the unloading has been carried out. The obtained Ci –values were corrected for the  Vol.9, No.12 An Experimental Study on Mechanical and Fracture Behavior 1093 specimen rotation using the following expression to get the corrected compliance (Cci) of the specimen at that particular load [17]. H = initial half-span of the load points (centre of pin holes) R = radius of rotation of the crack centre line, (W + a)/2 where a is the updated crack length. D = one half of the initial distance between the displacement measurement points θ = angle of rotation of a rigid body element about the unbroken midsection line, or dm = Total measured load-line displacement The crack length (ai) at this point of interest was next estimated using the expression suggested by Hudak et. al. [18] where, W =width of the specimen B = total thickness of the specimen The obtained values of J and the corresponding crack extension Δa were plotted to get the J- Δa curves of the material in various test conditions. 2.5 Fractography The end of the ductile crack extension during loading of the specimens, subjected to J-integral test, was marked by post fatigue cracking, and then the specimens were loaded to fracture. The fractured surfaces were ultrasonically cleaned and examined using a scanning electron microscope. This was done to record the interesting features of stable crack extension. 3. Results and Discussions Hardness was evaluated with the help of a Vickers Hardness Tester using a load of 10 kgf as shown in Table: 2. The five indentations were taken to estimate the average value of hardness of the steel under investigation.  1094 A. K. Vishnoi, B.K. Mishra, S. Prakash Vol.9, No.12 Table 2: Hardness value of specimens SAMPLE Hardness HV P11 202 P12 190 P13 210 P21 179 P22 170 P23 165 3.1 Tensile Test The tensile tests were conducted at room temperature. The stress strain plot for P11 and P12 is shown in Fig. 3 while for P21 and P22 is shown in Fig. 4 along with the tensile properties in Table 3. Table 3: Tensile Properties of Phosphoric Iron P1 Specimen Yield stress, (MPa) Ultimate tensile stress (Mpa ) P11 434.7 664 P12 344.2 573 P13 480 610 Figure 3: Stress strain diagram for specimen P11 and P12 0.0 0.1 0.2 0.3 0.4 0 100 200 300 400 500 600 700 Stress (MPa) Strain (%) strees strain curve of phosphoric iron(P11) 0.0 0.1 0.2 0.3 0.4 0.5 0 100 200 300 400 500 600 700 800 Stress (MPa) Strain strees strain curve of phosphoric iron(P12)  Vol.9, No.12 An Experimental Study on Mechanical and Fracture Behavior 1095 0.0 0.5 1.0 1.5 2.0 2.5 3.0 3.5 0 1000 2000 3000 4000 5000 Stress (MPa) Strain strees strain curve of phosphoric iron(P21) Figure 4: stress strain diagram for specimen P21 and P22 3.2 J-integral Fracture Toughness Pre-crack load was calculated as below: = 16.9 KN Then an exclusion line is drawn parallel to the construction line intersecting the abscissa at 0.15 mm. A second exclusion line is drawn parallel to the construction line intersecting the abscissa at 1.5 mm. A J - ∆a data points that fall inside the area enclosed by these two parallel lines are plotted. In order to fit the power law equation for J-R curve, the experimental points of J vs. Δa lying between two exclusion lines were considered. The exclusion lines were constructed parallel to the experimental blunting line at Δa-offset values of 0.15 and 1.5mm following the ASTM standard E-1820 [37]. A line parallel to the experimental blunting line at Δa = 0.2mm was next constructed. The intersection of this offset line with the fitted J-R curve was considered as the critical value of J, i.e. JQ. 0.0 0.2 0.4 0.6 0.8 1.0 1.2 1.4 0 1000 2000 3000 4000 5000 Stress (MPa) Strain strees strain curve of phosphoric iron(P22) 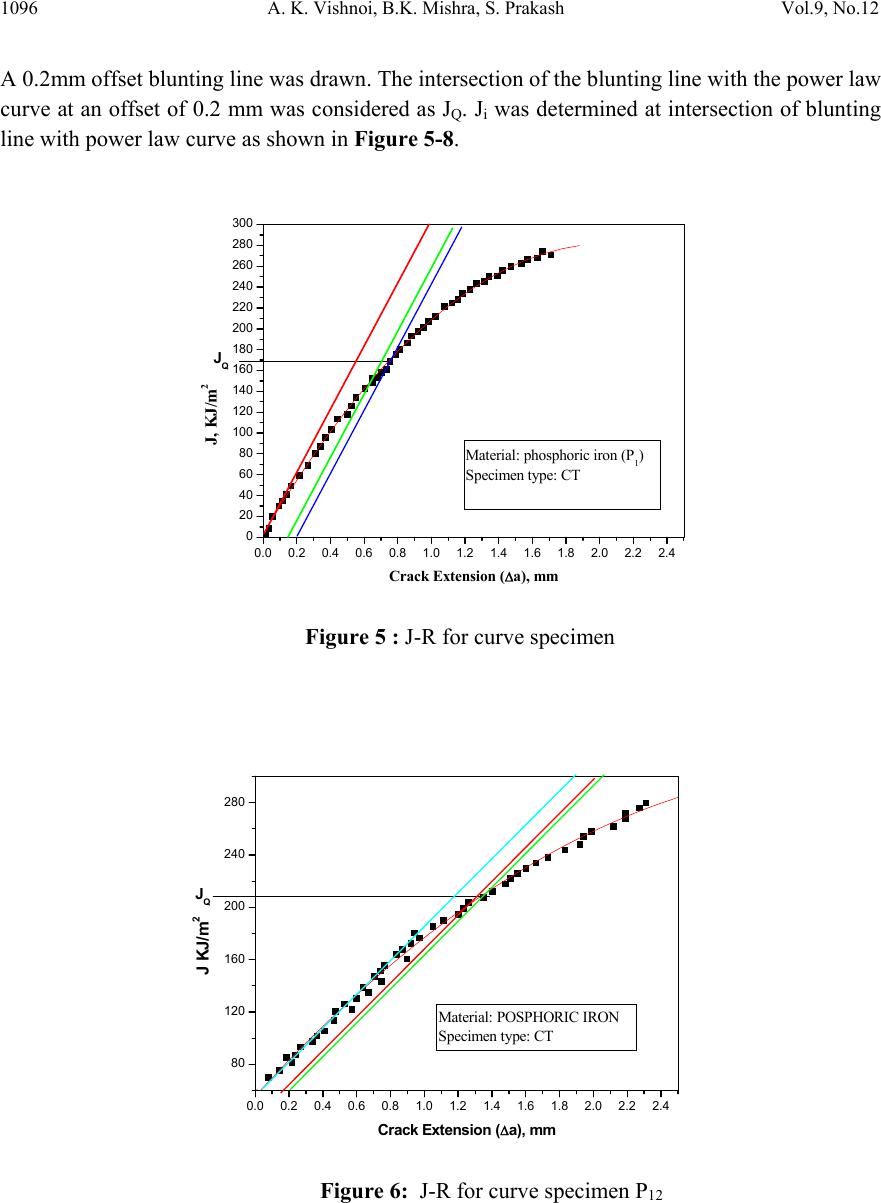 1096 A. K. Vishnoi, B.K. Mishra, S. Prakash Vol.9, No.12 A 0.2mm offset blunting line was drawn. The intersection of the blunting line with the power law curve at an offset of 0.2 mm was considered as JQ. Ji was determined at intersection of blunting line with power law curve as shown in Figure 5-8. 0.0 0.2 0.4 0.6 0.8 1.0 1.21.4 1.6 1.8 2.0 2.2 2.4 0 20 40 60 80 100 120 140 160 180 200 220 240 260 280 300 JQ J, KJ/m2 Crack Extension (Δa), mm Material: phosphoric iron (P1) Specimen type: CT Figure 5 : J-R for curve specimen 0.0 0.2 0.4 0.6 0.8 1.0 1.2 1.4 1.6 1.8 2.02.2 2.4 80 120 160 200 240 280 JQ J KJ/m2 Crack Extension (Δa), mm Material: POSPHORIC IRON Specimen type: CT Figure 6: J-R for curve specimen P12  Vol.9, No.12 An Experimental Study on Mechanical and Fracture Behavior 1097 0.0 0.2 0.4 0.60.8 1.0 1.2 1.4 1.61.8 2.0 2.22.4 0 100 200 300 400 500 600 700 800 900 1000 1100 1200 1300 1400 1500 JQ J KJ/m2 Crack Extension (Δa), mm Material: phosphoric iron (P2) Specimen type: CT Figure 7: J-R for curve specimen P21 0.0 0.2 0.4 0.6 0.8 1.0 1.2 1.4 1.6 1.8 2.0 2.2 2.4 0 100 200 300 400 500 600 700 800 900 1000 1100 1200 1300 1400 1500 JQ J KJ/m2 Crack Extension (Δa), mm Material: POSPHORIC IRON (P22) Specimen typ e : CT Figure 8: J-R for curve specimen P22 Table 4 : Thickness validity criteria of the specimens for fracture toughness test: Specimen σo MPa JQ KJ/m2B 10(JQ/ σo) P11 549 170 12.5 3.0 P12 458 210 12.5 4.5 P21 376.4 500 12.5 13.3 P22 371.1 590 12.5 15.8 σo = flow stress, JQ = critical value of J B = specimen thickness, and 10(JQ/ σo) = thickness criterion. 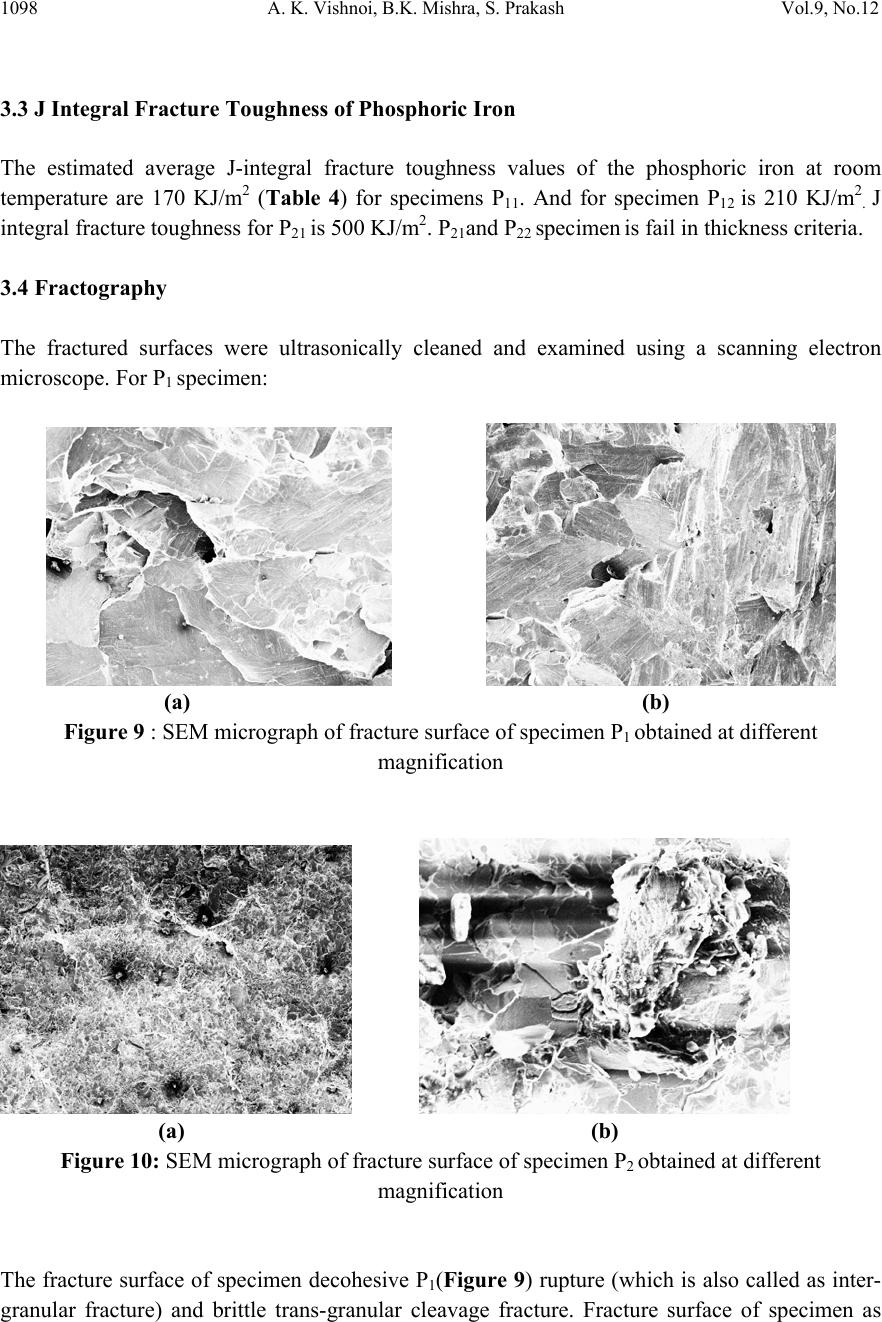 1098 A. K. Vishnoi, B.K. Mishra, S. Prakash Vol.9, No.12 3.3 J Integral Fracture Toughness of Phosphoric Iron The estimated average J-integral fracture toughness values of the phosphoric iron at room temperature are 170 KJ/m2 (Table 4) for specimens P11. And for specimen P12 is 210 KJ/m2. J integral fracture toughness for P21 is 500 KJ/m2. P21and P22 specimen is fail in thickness criteria. 3.4 Fractography The fractured surfaces were ultrasonically cleaned and examined using a scanning electron microscope. For P1 specimen: (a) (b) Figure 9 : SEM micrograph of fracture surface of specimen P1 obtained at different magnification (a) (b) Figure 10: SEM micrograph of fracture surface of specimen P2 obtained at different magnification The fracture surface of specimen decohesive P1(Figure 9) rupture (which is also called as inter- granular fracture) and brittle trans-granular cleavage fracture. Fracture surface of specimen as 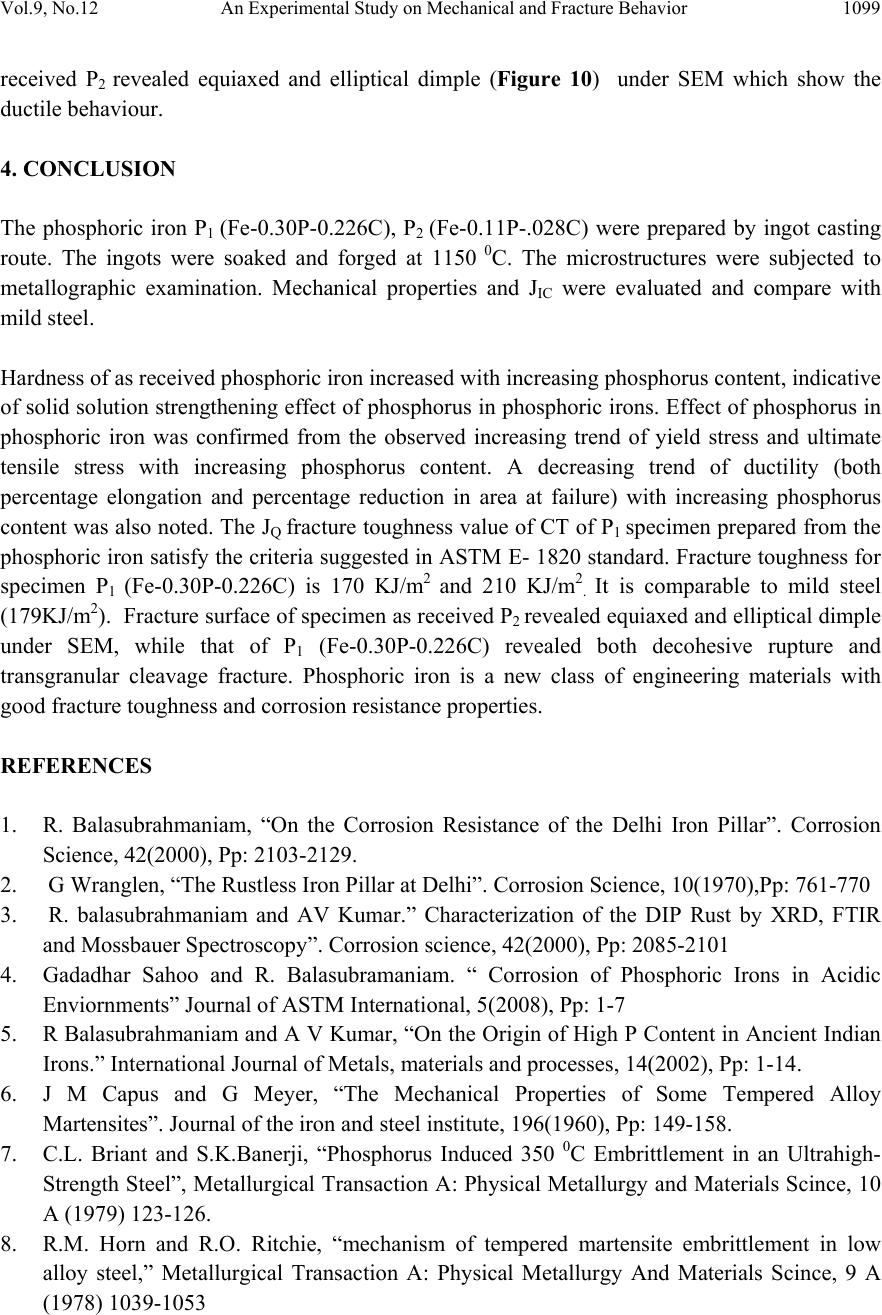 Vol.9, No.12 An Experimental Study on Mechanical and Fracture Behavior 1099 received P2 revealed equiaxed and elliptical dimple (Figure 10) under SEM which show the ductile behaviour. 4. CONCLUSION The phosphoric iron P1 (Fe-0.30P-0.226C), P2 (Fe-0.11P-.028C) were prepared by ingot casting route. The ingots were soaked and forged at 1150 0 C. The microstructures were subjected to metallographic examination. Mechanical properties and JIC were evaluated and compare with mild steel. Hardness of as received phosphoric iron increased with increasing phosphorus content, indicative of solid solution strengthening effect of phosphorus in phosphoric irons. Effect of phosphorus in phosphoric iron was confirmed from the observed increasing trend of yield stress and ultimate tensile stress with increasing phosphorus content. A decreasing trend of ductility (both percentage elongation and percentage reduction in area at failure) with increasing phosphorus content was also noted. The JQ fracture toughness value of CT of P1 specimen prepared from the phosphoric iron satisfy the criteria suggested in ASTM E- 1820 standard. Fracture toughness for specimen P1 (Fe-0.30P-0.226C) is 170 KJ/m2 and 210 KJ/m2. It is comparable to mild steel (179KJ/m2). Fracture surface of specimen as received P2 revealed equiaxed and elliptical dimple under SEM, while that of P1 (Fe-0.30P-0.226C) revealed both decohesive rupture and transgranular cleavage fracture. Phosphoric iron is a new class of engineering materials with good fracture toughness and corrosion resistance properties. REFERENCES 1. R. Balasubrahmaniam, “On the Corrosion Resistance of the Delhi Iron Pillar”. Corrosion Science, 42(2000), Pp: 2103-2129. 2. G Wranglen, “The Rustless Iron Pillar at Delhi”. Corrosion Science, 10(1970),Pp: 761-770 3. R. balasubrahmaniam and AV Kumar.” Characterization of the DIP Rust by XRD, FTIR and Mossbauer Spectroscopy”. Corrosion science, 42(2000), Pp: 2085-2101 4. Gadadhar Sahoo and R. Balasubramaniam. “ Corrosion of Phosphoric Irons in Acidic Enviornments” Journal of ASTM International, 5(2008), Pp: 1-7 5. R Balasubrahmaniam and A V Kumar, “On the Origin of High P Content in Ancient Indian Irons.” International Journal of Metals, materials and processes, 14(2002), Pp: 1-14. 6. J M Capus and G Meyer, “The Mechanical Properties of Some Tempered Alloy Martensites”. Journal of the iron and steel institute, 196(1960), Pp: 149-158. 7. C.L. Briant and S.K.Banerji, “Phosphorus Induced 350 0C Embrittlement in an Ultrahigh- Strength Steel”, Metallurgical Transaction A: Physical Metallurgy and Materials Scince, 10 A (1979) 123-126. 8. R.M. Horn and R.O. Ritchie, “mechanism of tempered martensite embrittlement in low alloy steel,” Metallurgical Transaction A: Physical Metallurgy And Materials Scince, 9 A (1978) 1039-1053 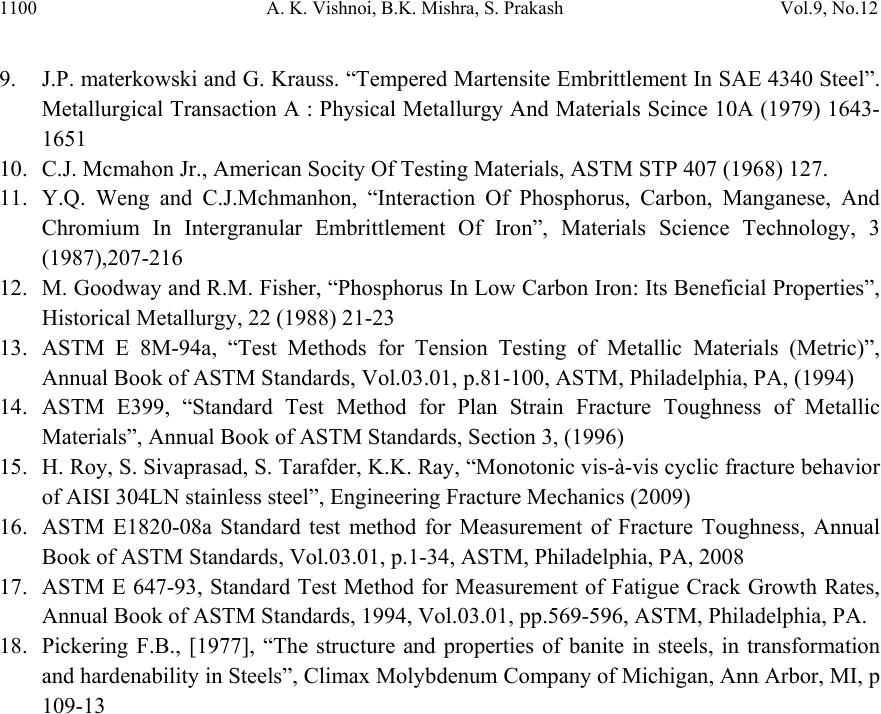 1100 A. K. Vishnoi, B.K. Mishra, S. Prakash Vol.9, No.12 9. J.P. materkowski and G. Krauss. “Tempered Martensite Embrittlement In SAE 4340 Steel”. Metallurgical Transaction A : Physical Metallurgy And Materials Scince 10A (1979) 1643- 1651 10. C.J. Mcmahon Jr., American Socity Of Testing Materials, ASTM STP 407 (1968) 127. 11. Y.Q. Weng and C.J.Mchmanhon, “Interaction Of Phosphorus, Carbon, Manganese, And Chromium In Intergranular Embrittlement Of Iron”, Materials Science Technology, 3 (1987),207-216 12. M. Goodway and R.M. Fisher, “Phosphorus In Low Carbon Iron: Its Beneficial Properties”, Historical Metallurgy, 22 (1988) 21-23 13. ASTM E 8M-94a, “Test Methods for Tension Testing of Metallic Materials (Metric)”, Annual Book of ASTM Standards, Vol.03.01, p.81-100, ASTM, Philadelphia, PA, (1994) 14. ASTM E399, “Standard Test Method for Plan Strain Fracture Toughness of Metallic Materials”, Annual Book of ASTM Standards, Section 3, (1996) 15. H. Roy, S. Sivaprasad, S. Tarafder, K.K. Ray, “Monotonic vis-à-vis cyclic fracture behavior of AISI 304LN stainless steel”, Engineering Fracture Mechanics (2009) 16. ASTM E1820-08a Standard test method for Measurement of Fracture Toughness, Annual Book of ASTM Standards, Vol.03.01, p.1-34, ASTM, Philadelphia, PA, 2008 17. ASTM E 647-93, Standard Test Method for Measurement of Fatigue Crack Growth Rates, Annual Book of ASTM Standards, 1994, Vol.03.01, pp.569-596, ASTM, Philadelphia, PA. 18. Pickering F.B., [1977], “The structure and properties of banite in steels, in transformation and hardenability in Steels”, Climax Molybdenum Company of Michigan, Ann Arbor, MI, p 109-13 |