Paper Menu >>
Journal Menu >>
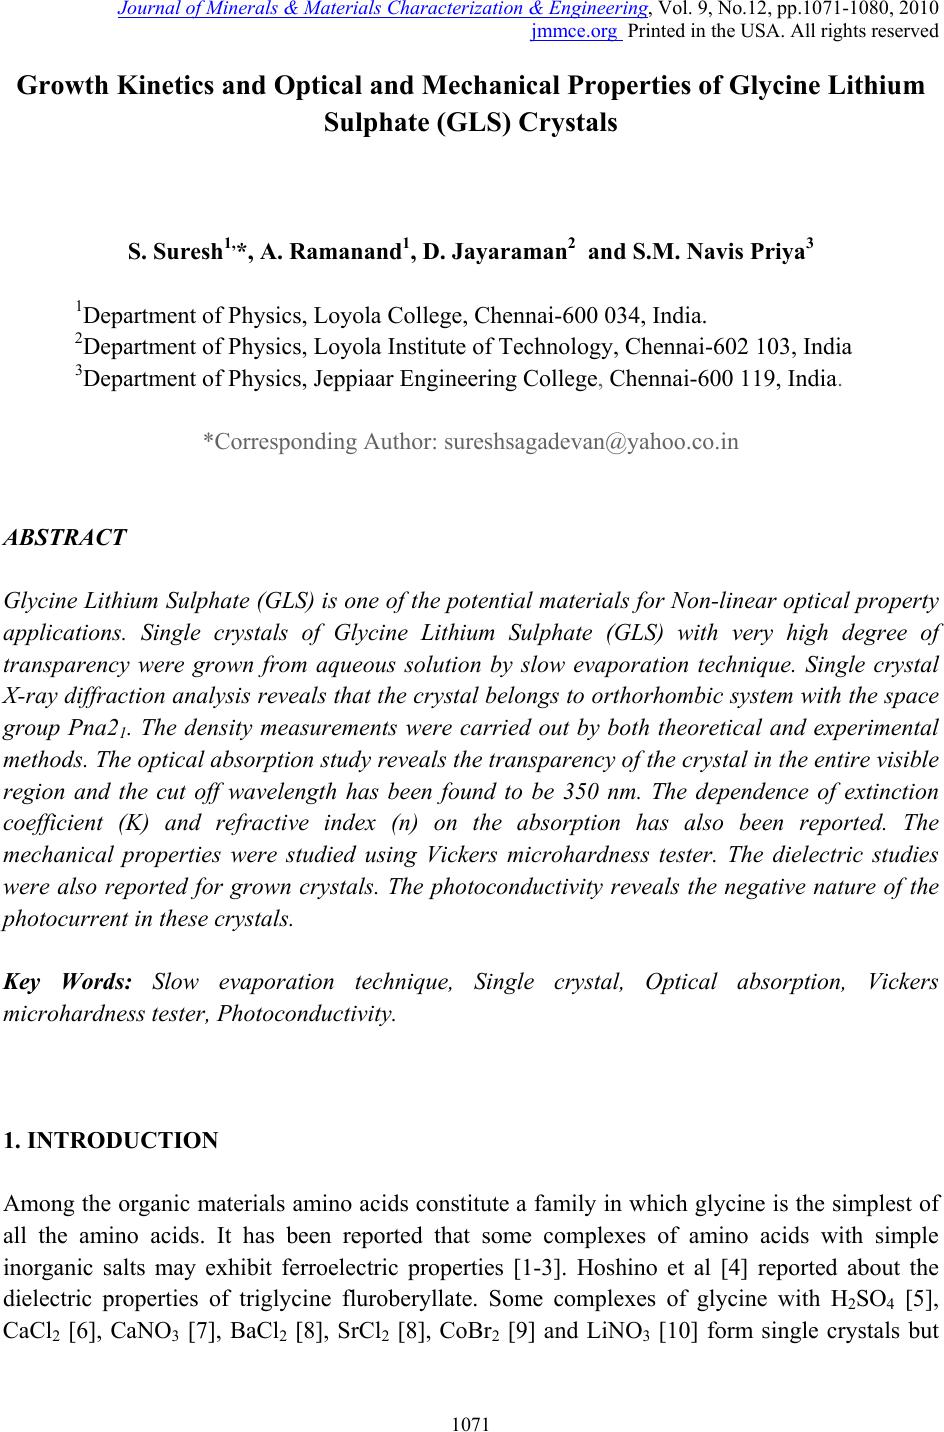 Journal of Minerals & Materials Characterization & Engineering, Vol. 9, No.12, pp.1071-1080, 2010 jmmce.org Printed in the USA. All rights reserved 1071 Growth Kinetics and Optical and Mechanical Properties of Glycine Lithium Sulphate (GLS) Crystals S. Suresh1,*, A. Ramanand1, D. Jayaraman2 and S.M. Navis Priya3 1Department of Physics, Loyola College, Chennai-600 034, India. 2Department of Physics, Loyola Institute of Technology, Chennai-602 103, India 3Department of Physics, Jeppiaar Engineering College, Chennai-600 119, India. *Corresponding Author: sureshsagadevan@yahoo.co.in ABSTRACT Glycine Lithium Sulphate (GLS) is one of the potential materials for Non-linear optical property applications. Single crystals of Glycine Lithium Sulphate (GLS) with very high degree of transparency were grown from aqueous solution by slow evaporation technique. Single crystal X-ray diffraction analysis reveals that the crystal belongs to orthorhombic system with the space group Pna21. The density measurements were carried out by both theoretical and experimental methods. The optical absorption study reveals the transparency of the crystal in the entire visible region and the cut off wavelength has been found to be 350 nm. The dependence of extinction coefficient (K) and refractive index (n) on the absorption has also been reported. The mechanical properties were studied using Vickers microhardness tester. The dielectric studies were also reported for grown crystals. The photoconductivity reveals the negative nature of the photocurrent in these crystals. Key Words: Slow evaporation technique, Single crystal, Optical absorption, Vickers microhardness tester, Photoconductivity. 1. INTRODUCTION Among the organic materials amino acids constitute a family in which glycine is the simplest of all the amino acids. It has been reported that some complexes of amino acids with simple inorganic salts may exhibit ferroelectric properties [1-3]. Hoshino et al [4] reported about the dielectric properties of triglycine fluroberyllate. Some complexes of glycine with H2SO4 [5], CaCl2 [6], CaNO3 [7], BaCl2 [8], SrCl2 [8], CoBr2 [9] and LiNO3 [10] form single crystals but 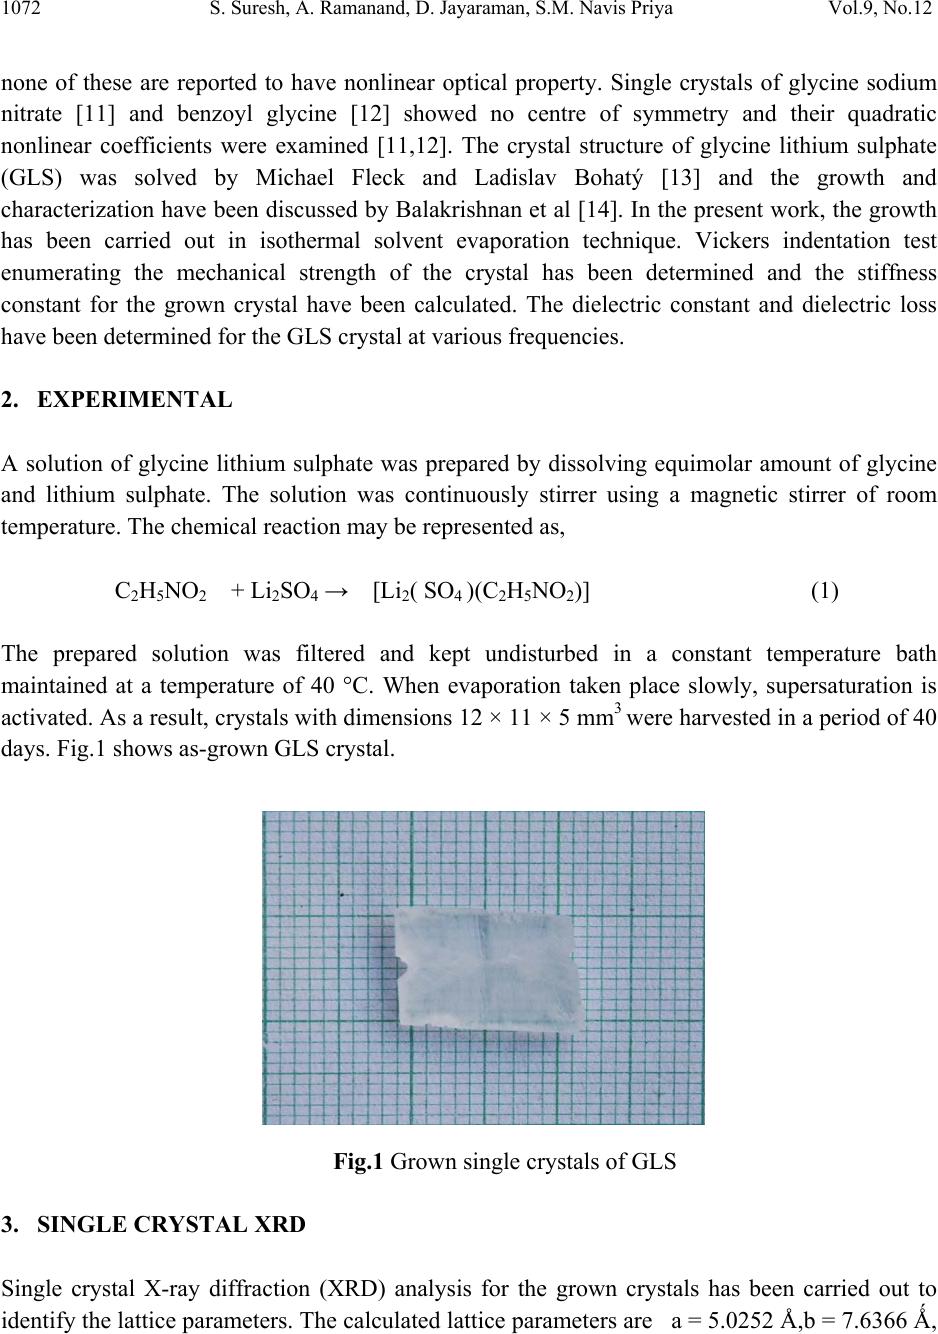 1072 S. Suresh, A. Ramanand, D. Jayaraman, S.M. Navis Priya Vol.9, No.12 none of these are reported to have nonlinear optical property. Single crystals of glycine sodium nitrate [11] and benzoyl glycine [12] showed no centre of symmetry and their quadratic nonlinear coefficients were examined [11,12]. The crystal structure of glycine lithium sulphate (GLS) was solved by Michael Fleck and Ladislav Bohatý [13] and the growth and characterization have been discussed by Balakrishnan et al [14]. In the present work, the growth has been carried out in isothermal solvent evaporation technique. Vickers indentation test enumerating the mechanical strength of the crystal has been determined and the stiffness constant for the grown crystal have been calculated. The dielectric constant and dielectric loss have been determined for the GLS crystal at various frequencies. 2. EXPERIMENTAL A solution of glycine lithium sulphate was prepared by dissolving equimolar amount of glycine and lithium sulphate. The solution was continuously stirrer using a magnetic stirrer of room temperature. The chemical reaction may be represented as, C2H5NO2 + Li2SO4 → [Li2( SO4 )(C2H5NO2)] (1) The prepared solution was filtered and kept undisturbed in a constant temperature bath maintained at a temperature of 40 °C. When evaporation taken place slowly, supersaturation is activated. As a result, crystals with dimensions 12 × 11 × 5 mm3 were harvested in a period of 40 days. Fig.1 shows as-grown GLS crystal. Fig.1 Grown single crystals of GLS 3. SINGLE CRYSTAL XRD Single crystal X-ray diffraction (XRD) analysis for the grown crystals has been carried out to identify the lattice parameters. The calculated lattice parameters are a = 5.0252 Å,b = 7.6366 Ǻ, 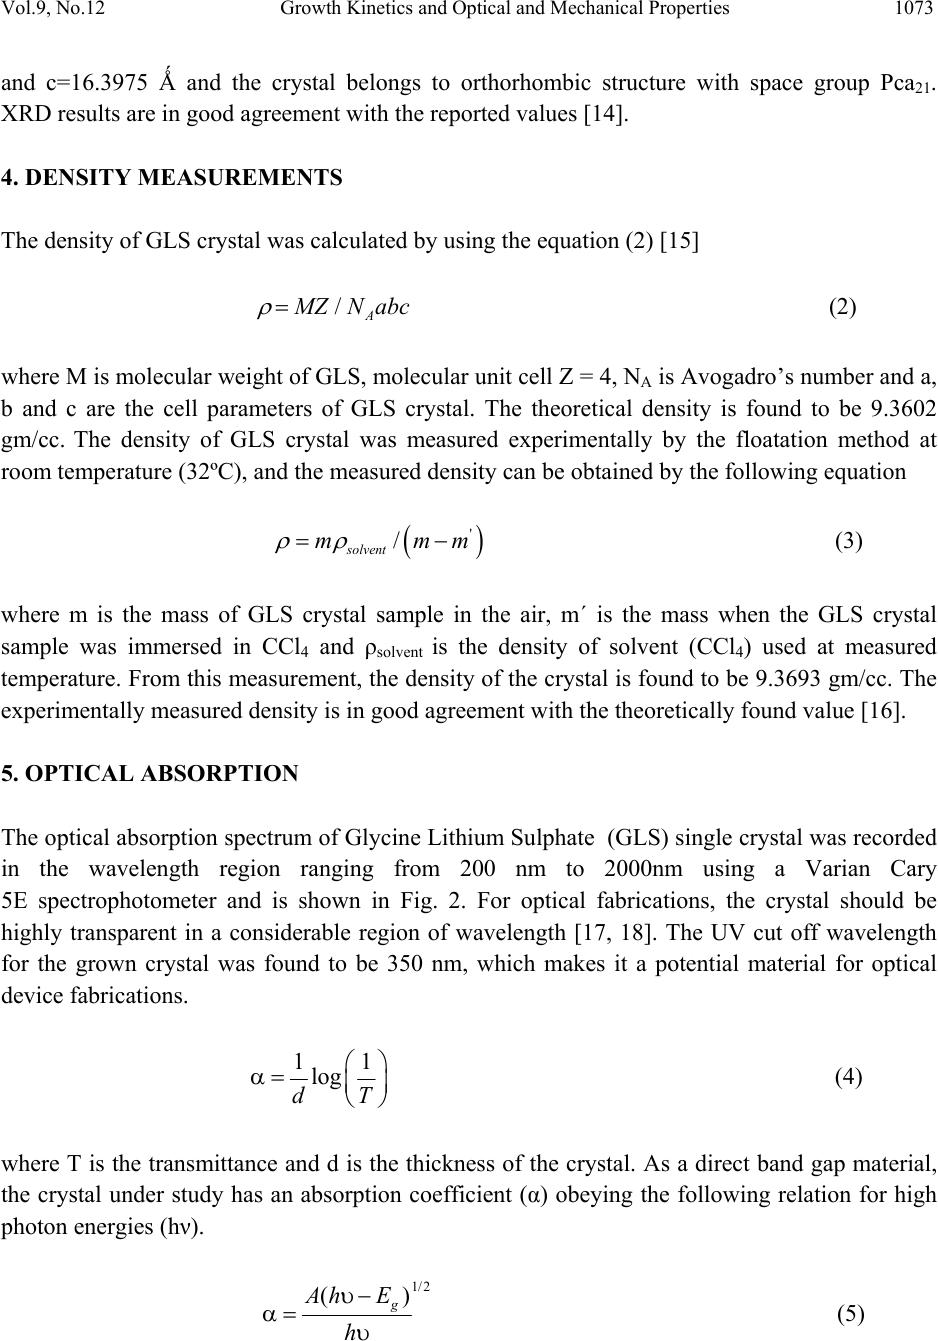 Vol.9, No.12 Growth Kinetics and Optical and Mechanical Properties 1073 and c=16.3975 Ǻ and the crystal belongs to orthorhombic structure with space group Pca21. XRD results are in good agreement with the reported values [14]. 4. DENSITY MEASUREMENTS The density of GLS crystal was calculated by using the equation (2) [15] /A M ZNabc ρ = (2) where M is molecular weight of GLS, molecular unit cell Z = 4, NA is Avogadro’s number and a, b and c are the cell parameters of GLS crystal. The theoretical density is found to be 9.3602 gm/cc. The density of GLS crystal was measured experimentally by the floatation method at room temperature (32ºC), and the measured density can be obtained by the following equation ( ) ' / solvent mmm ρρ =− (3) where m is the mass of GLS crystal sample in the air, m΄ is the mass when the GLS crystal sample was immersed in CCl4 and ρsolvent is the density of solvent (CCl4) used at measured temperature. From this measurement, the density of the crystal is found to be 9.3693 gm/cc. The experimentally measured density is in good agreement with the theoretically found value [16]. 5. OPTICAL ABSORPTION The optical absorption spectrum of Glycine Lithium Sulphate (GLS) single crystal was recorded in the wavelength region ranging from 200 nm to 2000nm using a Varian Cary 5E spectrophotometer and is shown in Fig. 2. For optical fabrications, the crystal should be highly transparent in a considerable region of wavelength [17, 18]. The UV cut off wavelength for the grown crystal was found to be 350 nm, which makes it a potential material for optical device fabrications. 11 log dT ⎛⎞ α= ⎜⎟ ⎝⎠ (4) where T is the transmittance and d is the thickness of the crystal. As a direct band gap material, the crystal under study has an absorption coefficient (α) obeying the following relation for high photon energies (hν). 1/2 () g Ah E h υ− α= υ (5)  1074 S. Suresh, A. Ramanand, D. Jayaraman, S.M. Navis Priya Vol.9, No.12 where Eg is the optical band gap of the crystal and A is a constant. The plot of variation of (αhν)2 versus hν is shown in Fig. 3. Eg was evaluated by the extrapolation of the linear part [19]. The band gap is found to be 3 .50 eV and as a consequence of wide band gap, the grown crystal has large transmittance in the visible region [20]. Fig. 2 Optical absorption spectrum of GLS Fig.3 Plot of α vs photon energy for single crystal GLS single crystals 6. OPTICAL CONSTANTS The optical constants (n, K) are determined from the transmission (T) and reflection (R) spectrum based on the following relations [21] 2 2 (1) exp() 1Rexp( 2) R t Tt −−α =−−α (6) where t is the thickness and α is related to extinction coefficient K by 4 K π αλ = (7) The reflectance (R) can be written in terms of refractive index (n) as [22] () () 2 2 1 1 n Rn − =+ (8) 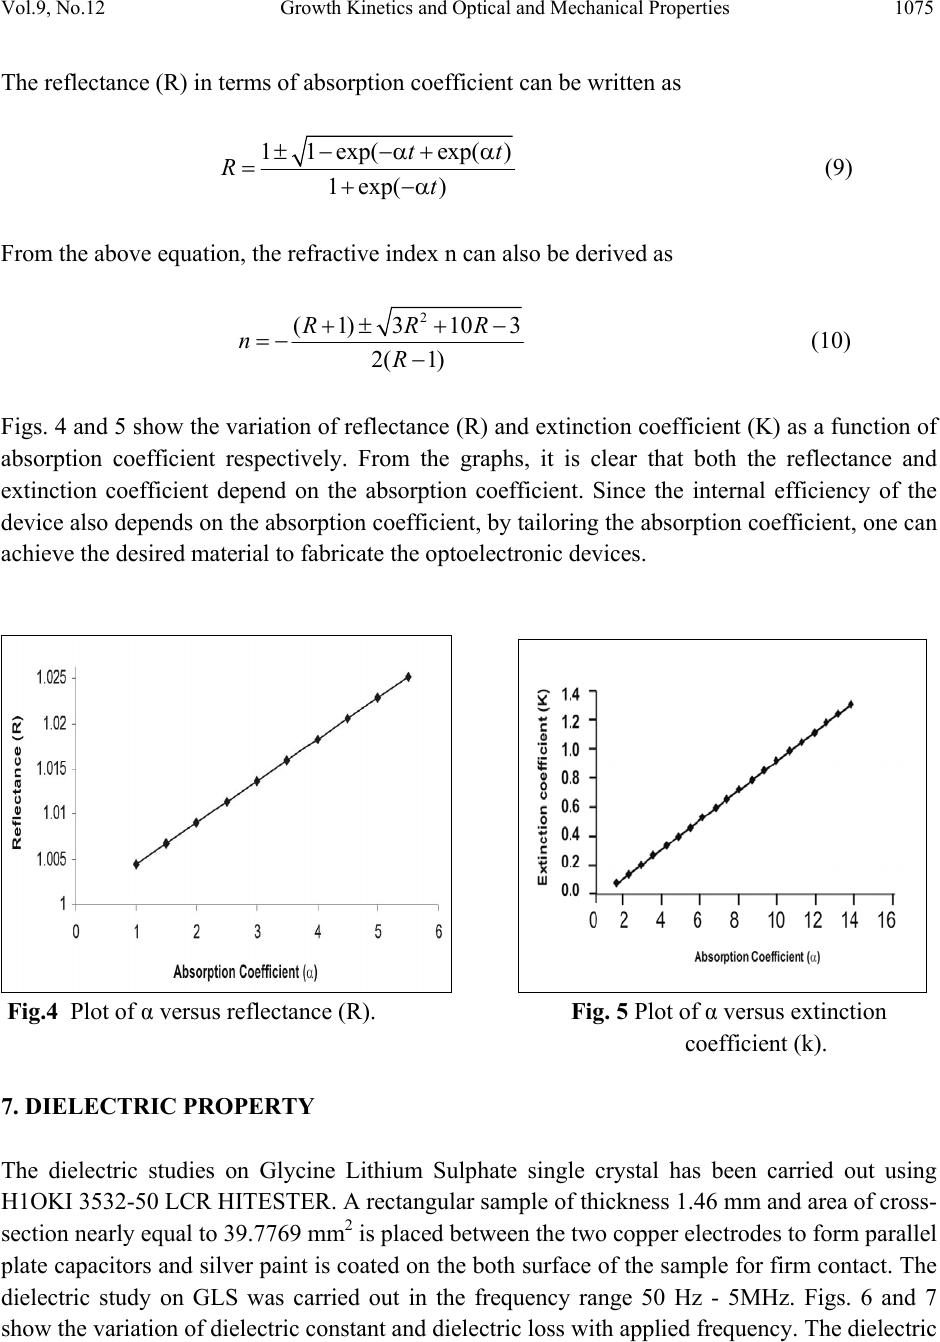 Vol.9, No.12 Growth Kinetics and Optical and Mechanical Properties 1075 The reflectance (R) in terms of absorption coefficient can be written as 11 exp(exp() 1 exp() tt Rt ±− −α+ α =+−α (9) From the above equation, the refractive index n can also be derived as 2 (1)3 103 2( 1) RRR nR +±+ − =− − (10) Figs. 4 and 5 show the variation of reflectance (R) and extinction coefficient (K) as a function of absorption coefficient respectively. From the graphs, it is clear that both the reflectance and extinction coefficient depend on the absorption coefficient. Since the internal efficiency of the device also depends on the absorption coefficient, by tailoring the absorption coefficient, one can achieve the desired material to fabricate the optoelectronic devices. Fig.4 Plot of α versus reflectance (R). Fig. 5 Plot of α versus extinction coefficient (k). 7. DIELECTRIC PROPERTY The dielectric studies on Glycine Lithium Sulphate single crystal has been carried out using H1OKI 3532-50 LCR HITESTER. A rectangular sample of thickness 1.46 mm and area of cross- section nearly equal to 39.7769 mm2 is placed between the two copper electrodes to form parallel plate capacitors and silver paint is coated on the both surface of the sample for firm contact. The dielectric study on GLS was carried out in the frequency range 50 Hz - 5MHz. Figs. 6 and 7 show the variation of dielectric constant and dielectric loss with applied frequency. The dielectric 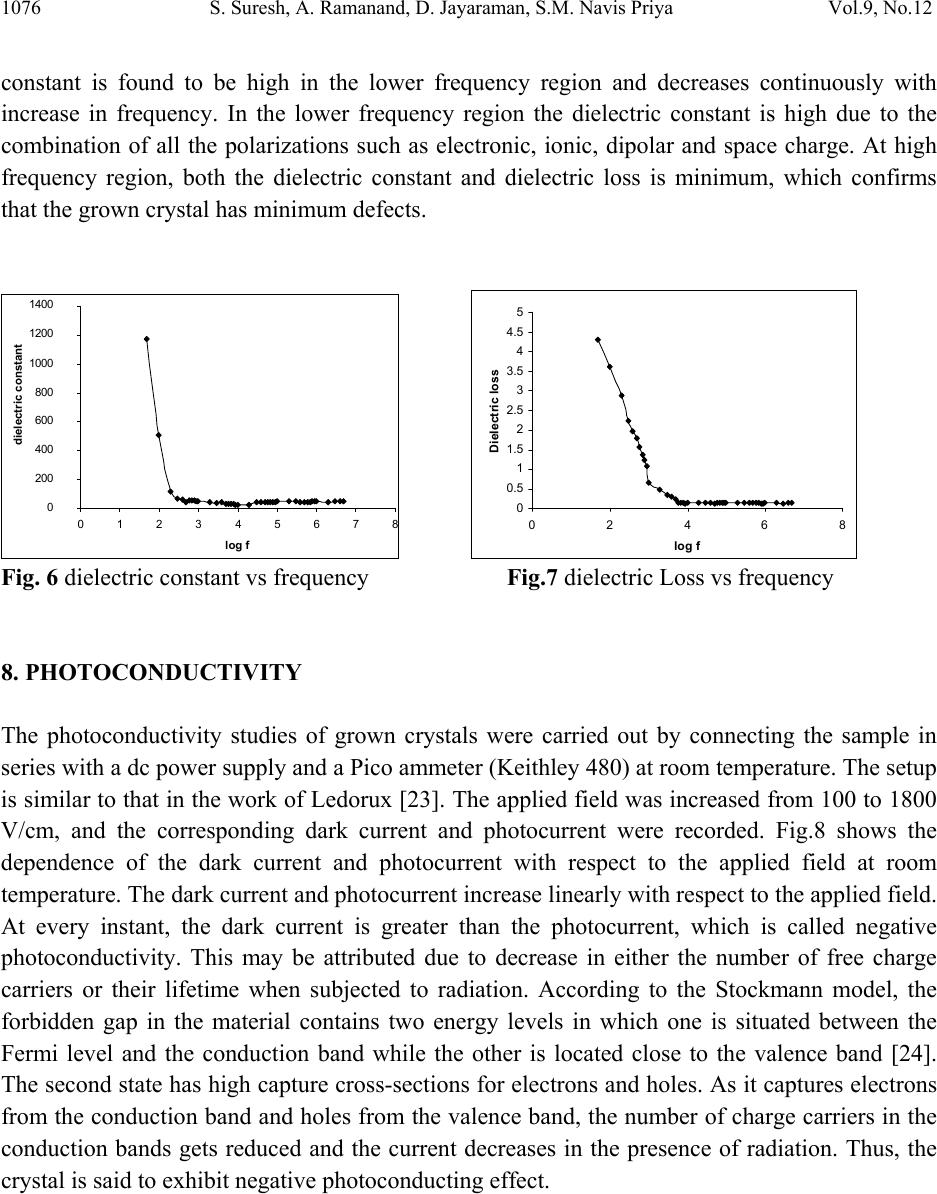 1076 S. Suresh, A. Ramanand, D. Jayaraman, S.M. Navis Priya Vol.9, No.12 constant is found to be high in the lower frequency region and decreases continuously with increase in frequency. In the lower frequency region the dielectric constant is high due to the combination of all the polarizations such as electronic, ionic, dipolar and space charge. At high frequency region, both the dielectric constant and dielectric loss is minimum, which confirms that the grown crystal has minimum defects. 0 200 400 600 800 1000 1200 1400 0123 45678 log f dielectric constant 0 0.5 1 1.5 2 2.5 3 3.5 4 4.5 5 02468 log f Dielectric loss Fig. 6 dielectric constant vs frequency Fig.7 dielectric Loss vs frequency 8. PHOTOCONDUCTIVITY The photoconductivity studies of grown crystals were carried out by connecting the sample in series with a dc power supply and a Pico ammeter (Keithley 480) at room temperature. The setup is similar to that in the work of Ledorux [23]. The applied field was increased from 100 to 1800 V/cm, and the corresponding dark current and photocurrent were recorded. Fig.8 shows the dependence of the dark current and photocurrent with respect to the applied field at room temperature. The dark current and photocurrent increase linearly with respect to the applied field. At every instant, the dark current is greater than the photocurrent, which is called negative photoconductivity. This may be attributed due to decrease in either the number of free charge carriers or their lifetime when subjected to radiation. According to the Stockmann model, the forbidden gap in the material contains two energy levels in which one is situated between the Fermi level and the conduction band while the other is located close to the valence band [24]. The second state has high capture cross-sections for electrons and holes. As it captures electrons from the conduction band and holes from the valence band, the number of charge carriers in the conduction bands gets reduced and the current decreases in the presence of radiation. Thus, the crystal is said to exhibit negative photoconducting effect.  Vol.9, No.12 Growth Kinetics and Optical and Mechanical Properties 1077 Fig. 8 Dark current and photocurrent as a function of the applied field. 9. MECHANICAL PROPERTY Microhardness studies of any system have a direct correlation with the crystal structure and are very sensitive to the presence of any other phase or phase transition and lattice perfections are prevalent in the system. The hardness of the material depends on the different parameters such as lattice energy, Debye temperature, heat of formation and interatomic spacing [25]. The hardness tests for GLS crystal was carried out by Leitz micro hardness tester with a diamond pyramidal indenter. The diagonal length of the indentation for various applied loads in kg is measured for a constant indentation period of 15 sec. The Vickers’ hardness number (Hv) is calculated using the relation [26] 2 2/ 8544.1 mmkg d P HV= (10) where P is the applied load in kg and d is the diagonal length in mm. The variation of Hv with the applied load P is shown in Fig. 9 and a plot of log P versus log d for the grown crystal is shown in Fig. 10 The plot between log P versus log d yields a straight line graph and its slope gives the work hardening index n, and is found to be 3.09. According to Meyer’s relation, n dKP 1 = (11)  1078 S. Suresh, A. Ramanand, D. Jayaraman, S.M. Navis Priya Vol.9, No.12 where K1 is the standard hardness value which can be found out from the plot of P versus dn. Since the material takes some time to revert to the elastic mode after every indentation, a correction x is applied to the d value and the Kick’s law is related as () 2 2xdKP += (12) From Eqs. (11) and (12) x K K d K K dn⎟ ⎟ ⎠ ⎞ ⎜ ⎜ ⎝ ⎛ + ⎟ ⎟ ⎠ ⎞ ⎜ ⎜ ⎝ ⎛ = 1 2 2/1 1 2 2/ (13) The slope of dn/2 versus d yields (k2/k1)1/2 and the intercept is a measure of x. The striking factor is that x is positive only when n<2 and negative for n>2 [27]. From the hardness value, the yield strength (σv) can be calculated using the relation, (){} () () n V Vn n n H− ⎥ ⎦ ⎤ ⎢ ⎣ ⎡ −− − −−= 2 21 25.12 21 9.2 σ (14) The load-dependent hardness parameters n, K1, and K2 and yield strength σv are calculated for the grown crystal and are given in Table 1. The elastic stiffness constant (C11) following Wooster’s empirical relation as C11 = Hv7/4 [28]. As indentation initiates plastic deformation in a crystal, which is highly directional in nature, the hardness measurement may be a function of the orientation of the indented crystal. Fig 10 shows the variation of Hv as a function of applied load ranging from 10 g to 50 g on (0 1 2) face for GLS crystal. It is very clear from the figure that Hv increases with increase of load. The calculated stiffness constant for different loads is shown in Table 2. 0 0.5 1 1.5 2 2.5 1.61.62 1.64 1.661.681.71.72 1.74 log d log p Fig. 9 Variation of Hardness versus P Fig.10 Plot of log P versus log d 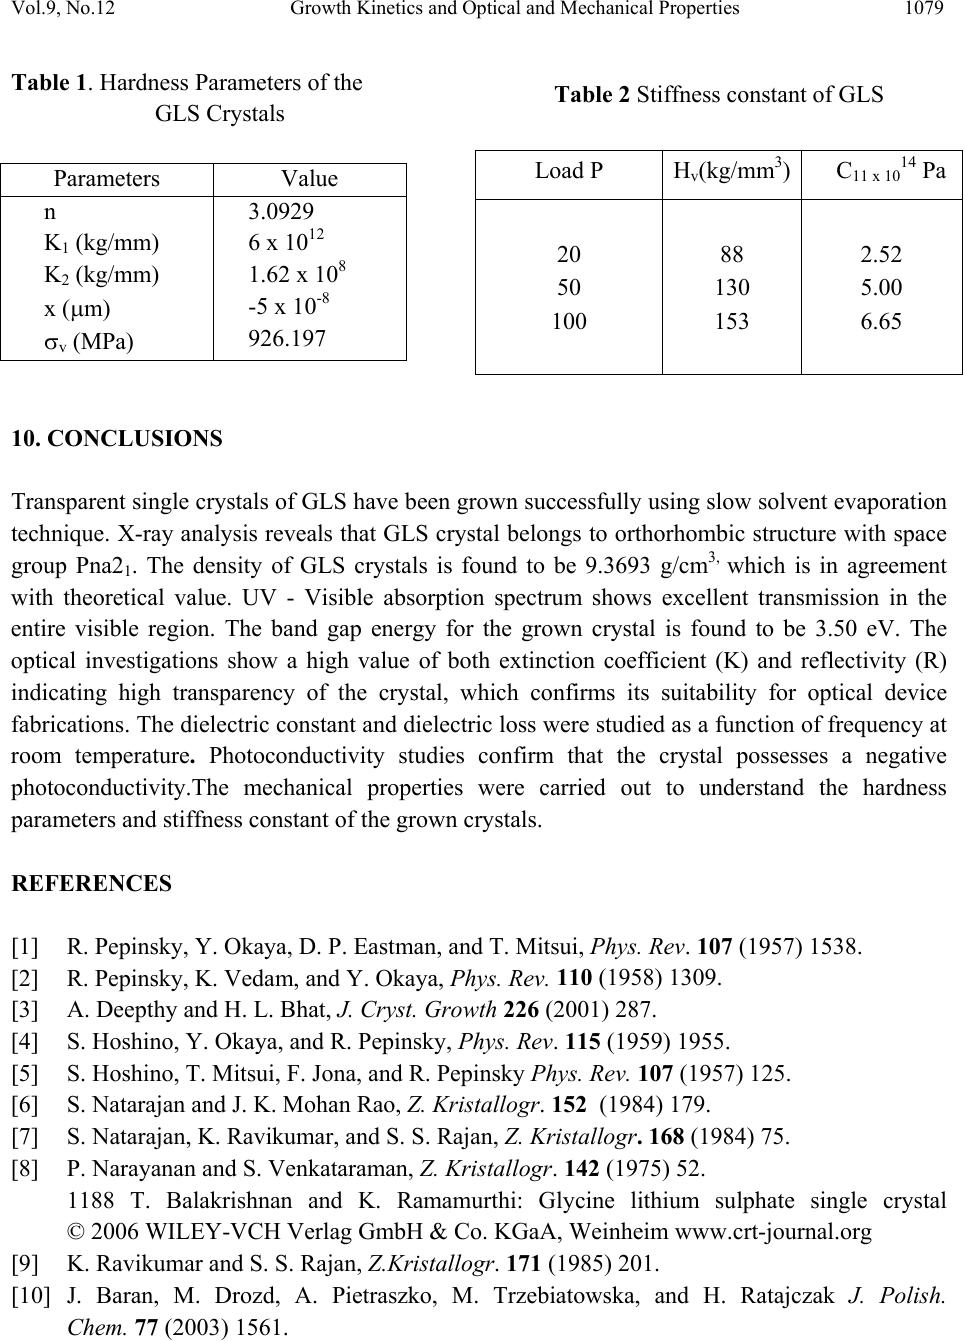 Vol.9, No.12 Growth Kinetics and Optical and Mechanical Properties 1079 Table 1. Hardness Parameters of the GLS Crystals Parameters Value n K1 (kg/mm) K2 (kg/mm) x (μm) σv (MPa) 3.0929 6 x 10¹² 1.62 x 10⁸ -5 x 10⁻⁸ 926.197 10. CONCLUSIONS Transparent single crystals of GLS have been grown successfully using slow solvent evaporation technique. X-ray analysis reveals that GLS crystal belongs to orthorhombic structure with space group Pna21. The density of GLS crystals is found to be 9.3693 g/cm3, which is in agreement with theoretical value. UV - Visible absorption spectrum shows excellent transmission in the entire visible region. The band gap energy for the grown crystal is found to be 3.50 eV. The optical investigations show a high value of both extinction coefficient (K) and reflectivity (R) indicating high transparency of the crystal, which confirms its suitability for optical device fabrications. The dielectric constant and dielectric loss were studied as a function of frequency at room temperature. Photoconductivity studies confirm that the crystal possesses a negative photoconductivity.The mechanical properties were carried out to understand the hardness parameters and stiffness constant of the grown crystals. REFERENCES [1] R. Pepinsky, Y. Okaya, D. P. Eastman, and T. Mitsui, Phys. Rev. 107 (1957) 1538. [2] R. Pepinsky, K. Vedam, and Y. Okaya, Phys. Rev. 110 (1958) 1309. [3] A. Deepthy and H. L. Bhat, J. Cryst. Growth 226 (2001) 287. [4] S. Hoshino, Y. Okaya, and R. Pepinsky, Phys. Rev. 115 (1959) 1955. [5] S. Hoshino, T. Mitsui, F. Jona, and R. Pepinsky Phys. Rev. 107 (1957) 125. [6] S. Natarajan and J. K. Mohan Rao, Z. Kristallogr. 152 (1984) 179. [7] S. Natarajan, K. Ravikumar, and S. S. Rajan, Z. Kristallogr. 168 (1984) 75. [8] P. Narayanan and S. Venkataraman, Z. Kristallogr. 142 (1975) 52. 1188 T. Balakrishnan and K. Ramamurthi: Glycine lithium sulphate single crystal © 2006 WILEY-VCH Verlag GmbH & Co. KGaA, Weinheim www.crt-journal.org [9] K. Ravikumar and S. S. Rajan, Z.Kristallogr. 171 (1985) 201. [10] J. Baran, M. Drozd, A. Pietraszko, M. Trzebiatowska, and H. Ratajczak J. Polish. Chem. 77 (2003) 1561. Table 2 Stiffness constant of GLS Load P Hv(kg/mm3) C11 x 1014 Pa 20 50 100 88 130 153 2.52 5.00 6.65 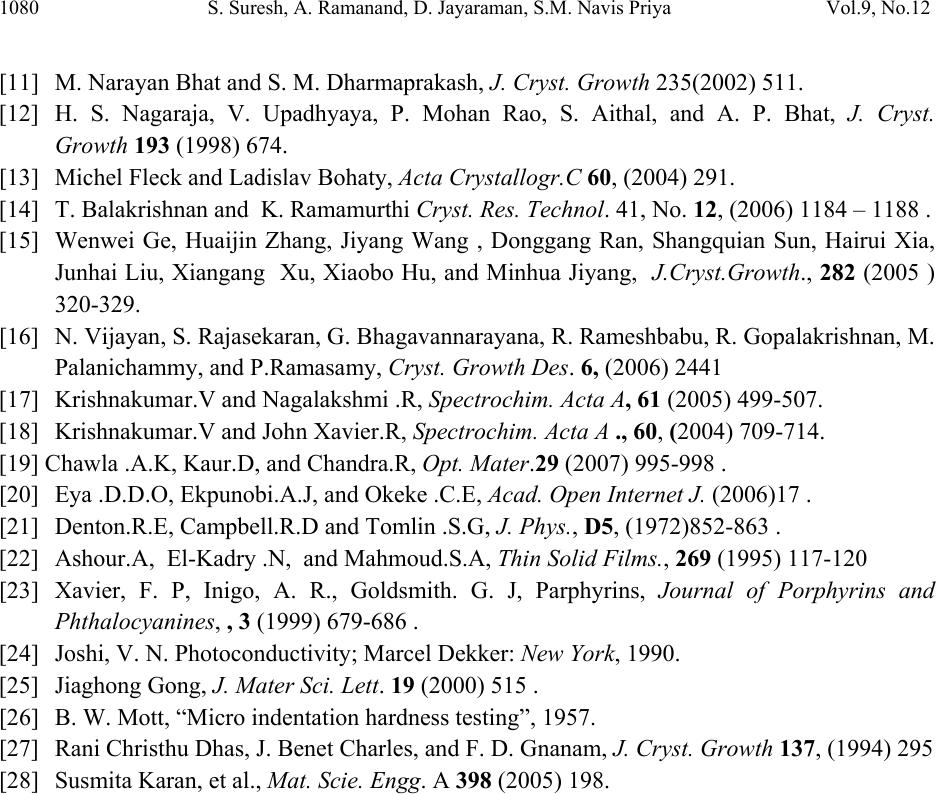 1080 S. Suresh, A. Ramanand, D. Jayaraman, S.M. Navis Priya Vol.9, No.12 [11] M. Narayan Bhat and S. M. Dharmaprakash, J. Cryst. Growth 235(2002) 511. [12] H. S. Nagaraja, V. Upadhyaya, P. Mohan Rao, S. Aithal, and A. P. Bhat, J. Cryst. Growth 193 (1998) 674. [13] Michel Fleck and Ladislav Bohaty, Acta Crystallogr.C 60, (2004) 291. [14] T. Balakrishnan and K. Ramamurthi Cryst. Res. Technol. 41, No. 12, (2006) 1184 – 1188 . [15] Wenwei Ge, Huaijin Zhang, Jiyang Wang , Donggang Ran, Shangquian Sun, Hairui Xia, Junhai Liu, Xiangang Xu, Xiaobo Hu, and Minhua Jiyang, J.Cryst.Growth., 282 (2005 ) 320-329. [16] N. Vijayan, S. Rajasekaran, G. Bhagavannarayana, R. Rameshbabu, R. Gopalakrishnan, M. Palanichammy, and P.Ramasamy, Cryst. Growth Des. 6, (2006) 2441 [17] Krishnakumar.V and Nagalakshmi .R, Spectrochim. Acta A, 61 (2005) 499-507. [18] Krishnakumar.V and John Xavier.R, Spectrochim. Acta A ., 60, (2004) 709-714. [19] Chawla .A.K, Kaur.D, and Chandra.R, Opt. Mater.29 (2007) 995-998 . [20] Eya .D.D.O, Ekpunobi.A.J, and Okeke .C.E, Acad. Open Internet J. (2006)17 . [21] Denton.R.E, Campbell.R.D and Tomlin .S.G, J. Phys., D5, (1972)852-863 . [22] Ashour.A, El-Kadry .N, and Mahmoud.S.A, Thin Solid Films., 269 (1995) 117-120 [23] Xavier, F. P, Inigo, A. R., Goldsmith. G. J, Parphyrins, Journal of Porphyrins and Phthalocyanines, , 3 (1999) 679-686 . [24] Joshi, V. N. Photoconductivity; Marcel Dekker: New York, 1990. [25] Jiaghong Gong, J. Mater Sci. Lett. 19 (2000) 515 . [26] B. W. Mott, “Micro indentation hardness testing”, 1957. [27] Rani Christhu Dhas, J. Benet Charles, and F. D. Gnanam, J. Cryst. Growth 137, (1994) 295 [28] Susmita Karan, et al., Mat. Scie. Engg. A 398 (2005) 198. |