Paper Menu >>
Journal Menu >>
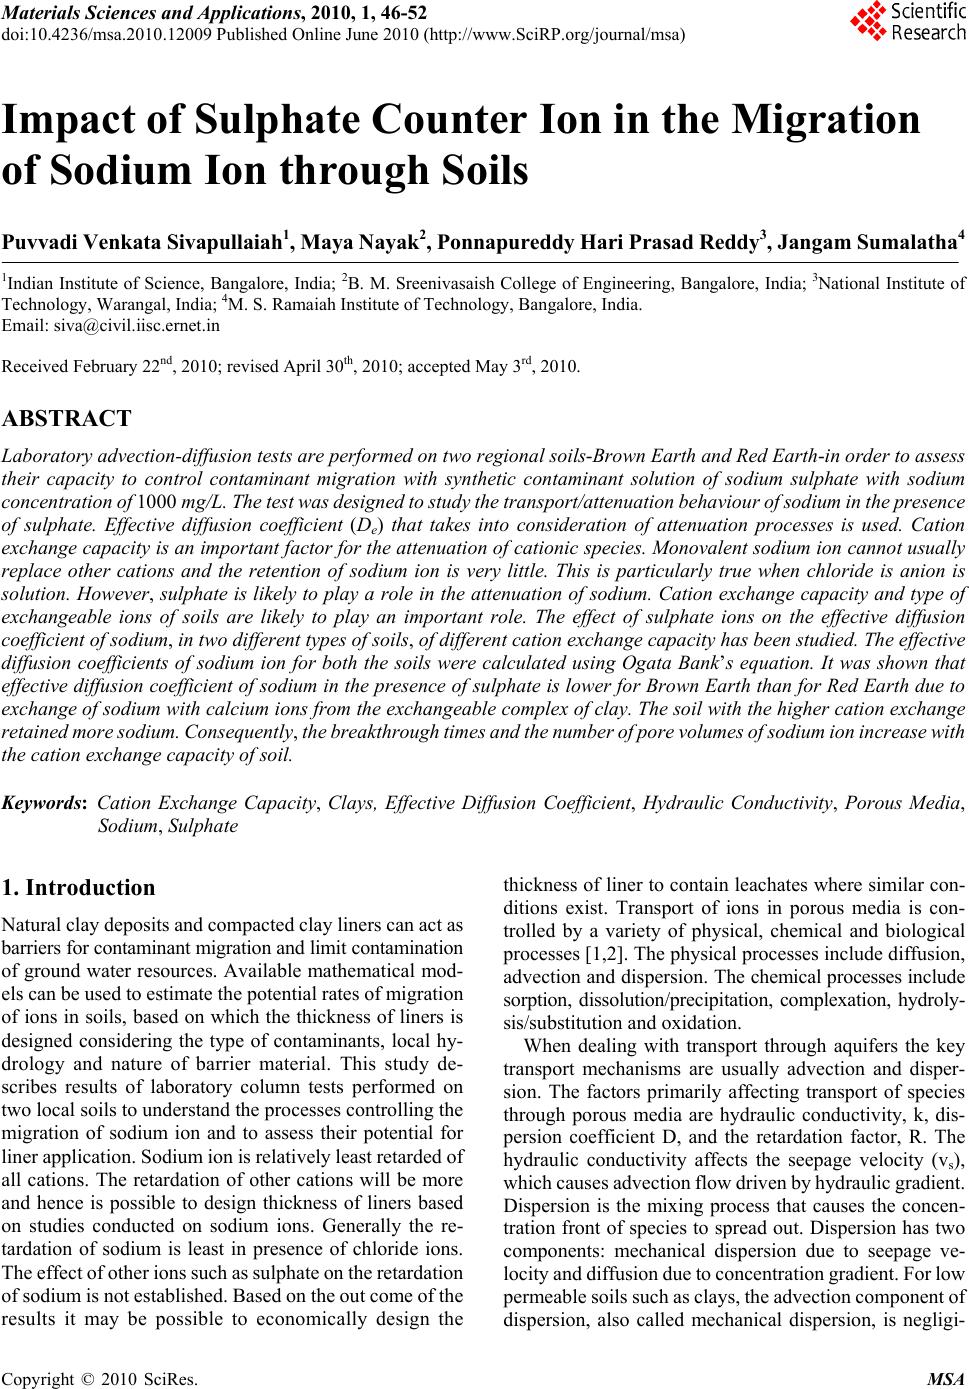 Materials Sciences and Applicatio ns, 2010, 1, 46-52 doi:10.4236/msa.2010.12009 Published Online June 2010 (http://www.SciRP.org/journal/msa) Copyright © 2010 SciRes. MSA Impact of Sulphate Counter Ion in the Migration of Sodium Ion through Soils Puvvadi Venkata Sivapullaiah1, Maya Nayak2, Pon napureddy Hari Prasad Reddy3, Jangam Sumalatha4 1Indian Institute of Science, Bangalore, India; 2B. M. Sreenivasaish College of Engineering, Bangalore, India; 3National Institute of Technology, Warangal, India; 4M. S. Ramaiah Institute of Technology, Bangalore, India. Email: siva@civil.iisc.ernet.in Received February 22nd, 2010; revised April 30th, 2010; accepted May 3rd, 2010. ABSTRACT Laboratory advection-diffusion tests are performed on two regional soils-Brown Earth and Red Earth -in order to assess their capacity to control contaminant migration with synthetic contaminant solution of sodium sulphate with sodium concentr ation of 1000 mg/L. The test was de signed to study the tr ansport/attenuatio n behaviour of sodium in t he presence of sulphate. Effective diffusion coefficient (De) that takes into consideration of attenuation processes is used. Cation exchange capacity is an important factor for the attenuation of cationic species. Monovalent sodium ion cannot usually replace other cations and the retention of sodium ion is very little. This is particularly true when chloride is anion is solution. However, sulphate is likely to play a role in the attenuation of sodium. Cation exchange capacity and type of exchangeable ions of soils are likely to play an important role. The effect of sulphate ions on the effective diffusion coefficient of sodium, in two different types of soils, of different cation exchange capacity ha s been studied. The effective diffusion coefficients of sodium ion for both the soils were calculated using Ogata Bank’s equation. It was shown that effective diffusion coefficient of sodium in the presence of su lphate is lower for Brown Ea rth than for Red Earth due to exchange of sodium with calcium ions from the exchangeable complex of clay. The soil with the higher cation exchange retained more sodi um. Consequentl y, the breakthr ough times and the number of pore volumes of sodium i on increase with the cation exchange capacity of soil. Keywords: Cation Exchange Capacity, Clays, Effective Diffusion Coefficient, Hydraulic Conductivity, Porous Media, Sodium, Sulphate 1. Introduction Natural clay deposits and compacted clay liners can act as barriers for contaminant migration and limit contamination of ground water resources. Available mathematical mod- els can be used to estimate the potential rates of migration of ions in soils, based on which the thickness of liners is designed considering the type of contaminants, local hy- drology and nature of barrier material. This study de- scribes results of laboratory column tests performed on two local soils to understand the processes controlling the migration of sodium ion and to assess their potential for liner application. Sodium ion is relatively least retarded of all cations. The retardation of other cations will be more and hence is possible to design thickness of liners based on studies conducted on sodium ions. Generally the re- tardation of sodium is least in presence of chloride ions. The effect of other ions suc h as sulphate on the retardation of sodi um i s not est ablishe d. Base d on the out com e of t he results it may be possible to economically design the thickness of liner to contain leachates where similar con- ditions exist. Transport of ions in porous media is con- trolled by a variety of physical, chemical and biological processes [1,2]. The physical processes include diffusion, adve ction and dis persion. T he chemical processes include sorption, dissolution/precipitation, complexation, hydroly- sis/substitutio n and oxidation. When dealing with transport through aquifers the key transport mechanisms are usually advection and disper- sion. The factors primarily affecting transport of species through porous media are hydraulic conductivity, k, dis- persion coefficient D, and the retardation factor, R. The hydraulic conductivity affects the seepage velocity (vs), which caus es advection flow dr iven by hydrauli c gradient. Dispersion is the mixing process that causes the concen- tration front of species to spread out. Dispersion has two components: mechanical dispersion due to seepage ve- locity and di ffusion due to con centration gradient. Fo r low permeable s oils such as clay s, the advect ion com ponent of dispersion, also called mechanical dispersion, is negligi- 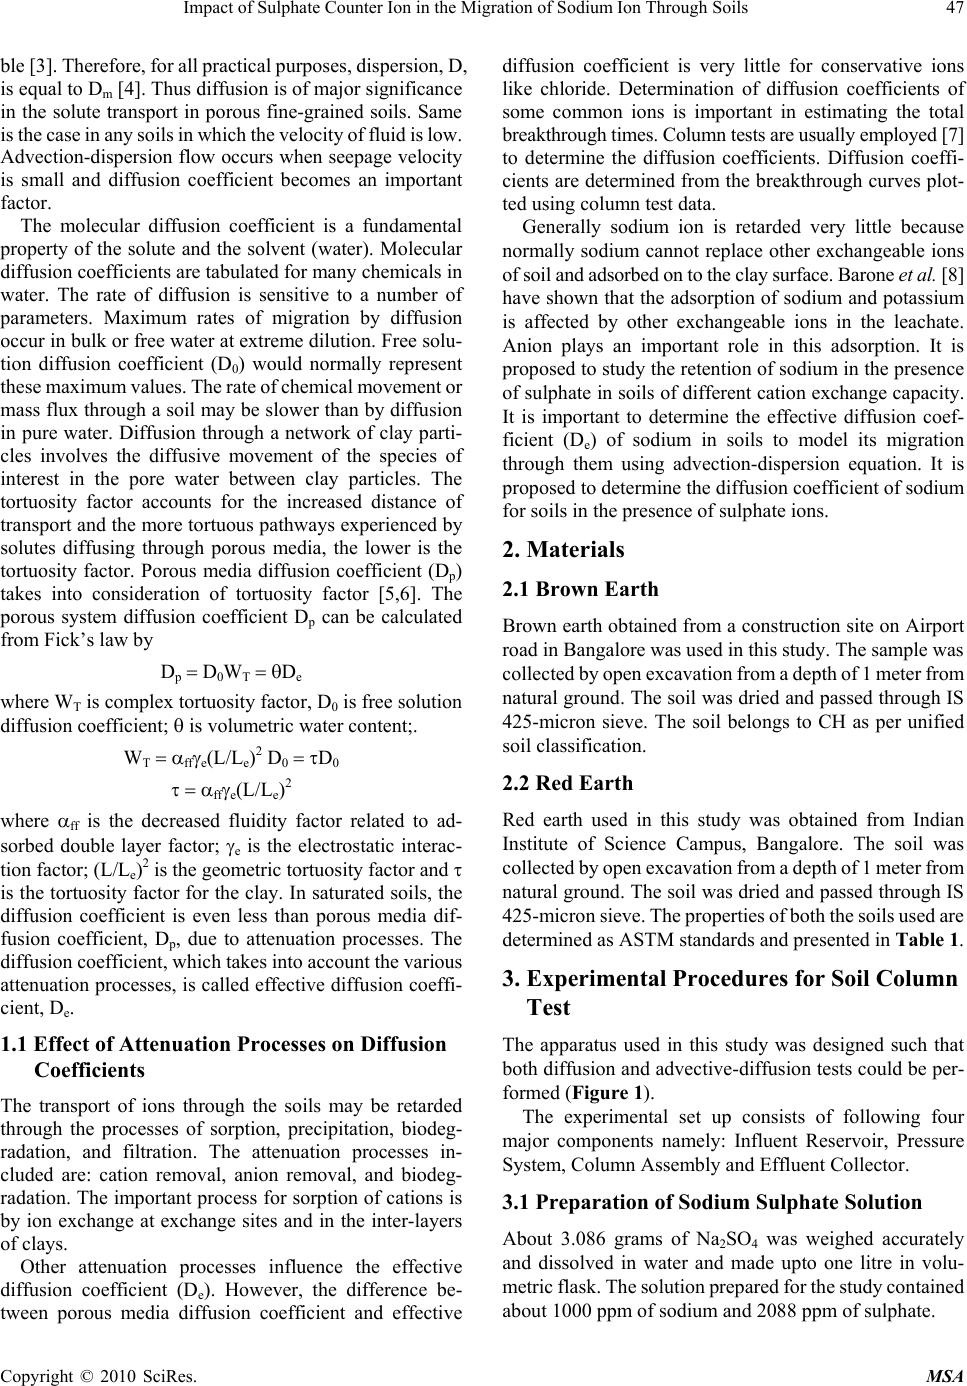 Impact of Sulphate Counter Ion in the Migration of Sodium Ion Through Soils 47 ble [3]. Theref ore, for all prac tical purposes, dispe rsion, D, is equal to Dm [4]. Thus diffusion is of major significance in the solute transport in porous fine-grained soils. Same is the case in any soils in which the velocity of fluid is low. Advection-dispersion flow occurs when seepage velocity is small and diffusion coefficient becomes an important factor. The molecular diffusion coefficient is a fundamental property of the solute and the solvent (water). Molecular diffusion coefficients are tabulated for many chemicals in water. The rate of diffusion is sensitive to a number of parameters. Maximum rates of migration by diffusion occur in bulk or free water at extreme dilution. Free solu- tion diffusion coefficient (D0) would normally represent these maximum values. The rate of chem ical movement or mass flux through a soil may be slower than by diffusion in pure water. Diffusion through a network of clay parti- cles involves the diffusive movement of the species of interest in the pore water between clay particles. The tortuosity factor accounts for the increased distance of transport and the more tortuous pathways experienced by solutes diffusing through porous media, the lower is the tortuosity factor. Porous media diffusion coefficient (Dp) takes into consideration of tortuosity factor [5,6]. The porous system diffusion coefficient Dp can be calculated from Fick’s law by Dp D0WT De where WT is complex tortuosity factor, D0 is free solution diffusion coefficient; is volumetric water content;. WT ffe(L/Le)2 D0 D0 ffe(L/Le)2 where ff is the decreased fluidity factor related to ad- sorbed double layer factor; e is the electrostatic interac- tion factor; (L/L e)2 is the ge ometric tortuosity factor and is the tortuosity factor for the clay. In saturated soils, the diffusion coefficient is even less than porous media dif- fusion coefficient, Dp, due to attenuation processes. The diffusion c oeffi cient, whi ch takes i nto acc ount the variou s attenuation processes, is called effective diffu sion coeffi- cient, De. 1.1 Effect of Attenuation Processes on Diffusion Coefficients The transport of ions through the soils may be retarded through the processes of sorption, precipitation, biodeg- radation, and filtration. The attenuation processes in- cluded are: cation removal, anion removal, and biodeg- radation. The important process for sorption of cations is by ion exchange at exchange sites and in the inter-layers of clays. Other attenuation processes influence the effective diffusion coefficient (De). However, the difference be- tween porous media diffusion coefficient and effective diffusion coefficient is very little for conservative ions like chloride. Determination of diffusion coefficients of some common ions is important in estimating the total breakthrough times. Colum n tests are usually employed [7] to determine the diffusion coefficients. Diffusion coeffi- cients are determined fro m the breakthrough curves plot- ted using column test data. Generally sodium ion is retarded very little because normally sodium cannot replace other exchangeable ions of soil and adsorbed on to the clay surface. Barone et al. [8] have shown that the adsorption of sodium and potassium is affected by other exchangeable ions in the leachate. Anion plays an important role in this adsorption. It is proposed to study the retention of sodium in the presence of sulphate in soils of different cation exchange capacity. It is important to determine the effective diffusion coef- ficient (De) of sodium in soils to model its migration through them using advection-dispersion equation. It is proposed to determine the diffusion coefficient of sodium for soils in the presence of sulphate ions. 2. Materials 2.1 Brown Earth Brown earth obtain ed from a construction site on Airport road in Bangalore was used in this study. The sample was collected b y open excavat ion from a de pth of 1 me ter from natural ground. Th e soil was dried and passed through IS 425-micron sieve. The soil belongs to CH as per unified soil classification. 2.2 Red Earth Red earth used in this study was obtained from Indian Institute of Science Campus, Bangalore. The soil was collected b y open excavat ion from a de pth of 1 me ter from natural ground. Th e soil was dried and passed through IS 425-micron sieve. The properties of both the soils used are determ i ned as A STM st an dar ds a n d pre se nt e d in Table 1. 3. Experimental Procedures for Soil Column Test The apparatus used in this study was designed such that both diffusion and advective-diffusion tests could be per- formed (Figure 1). The experimental set up consists of following four major components namely: Influent Reservoir, Pressure System, Column Assembly and Effluent Collector. 3.1 Preparation of Sodium Sulphate Solution About 3.086 grams of Na2SO4 was weighed accurately and dissolved in water and made upto one litre in volu- metric flask. T he solution prepared for t he study contained about 1000 ppm of sodium and 2088 ppm of sulphate. Copyright © 2010 SciRes. MSA 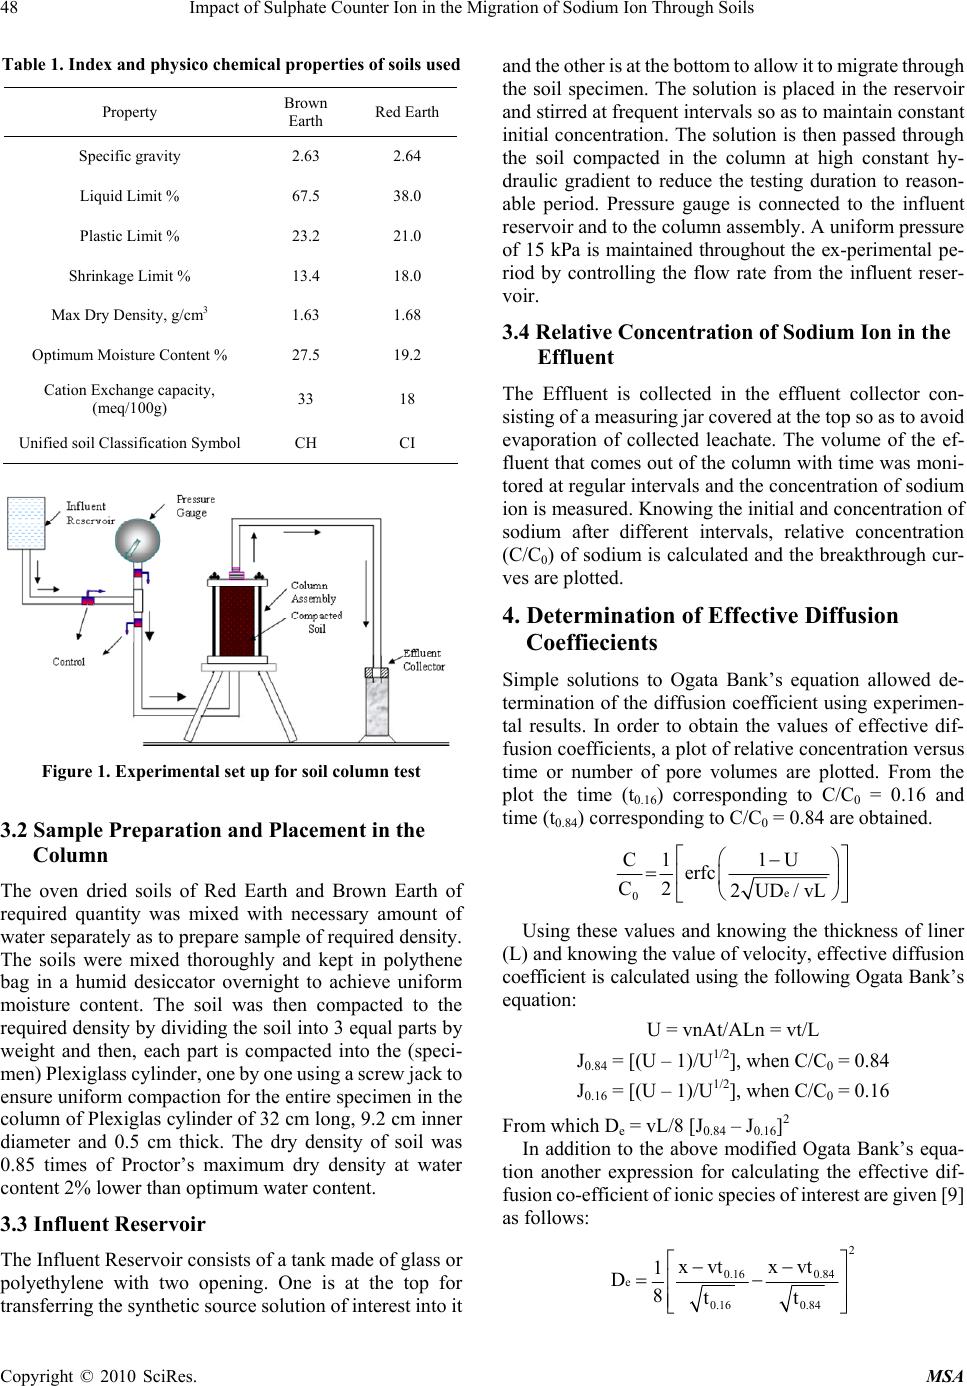 48 Impact of Sulphate Counter Ion in the Migration of Sodium Ion Through Soils Table 1. Index and physico chemical prope r t ies of soils use d Property Brown Earth Red Earth Specific gravity 2.63 2.64 Liquid Limi t % 67.5 38.0 Plastic Limit % 23.2 21.0 Shrinkage Limit % 13.4 18.0 Max Dry Density, g/cm3 1.63 1.68 Optimum Moisture Content % 27.5 19.2 Cation Exchange capacity, (meq/100g) 33 18 Unified soil Classification SymbolCH CI Figure 1. Experimental set up for soil column test 3.2 Sample Preparation and Placement in the Column The oven dried soils of Red Earth and Brown Earth of required quantity was mixed with necessary amount of water separately as to prepare sample of required density. The soils were mixed thoroughly and kept in polythene bag in a humid desiccator overnight to achieve uniform moisture content. The soil was then compacted to the required density by dividing the soil into 3 equal parts by weight and then, each part is compacted into the (speci- men) Plexiglas s cylinder, one by one using a screw jack to ensure uniform compaction for the entire specimen in the column of Plexiglas cylin der of 32 cm long, 9.2 cm inner diameter and 0.5 cm thick. The dry density of soil was 0.85 times of Proctor’s maximum dry density at water content 2% lower than optimum water content. 3.3 Influent Reservoir The Influent Reservoir consists of a tank made of glass or polyethylene with two opening. One is at the top for transferring the synthetic source solution of interest into it and the other is at the bottom to allow it to migrate through the soil specimen. The solution is placed in the reservoir and stirred at frequent intervals so as to maintain constant initial concentration. The solution is then passed through the soil compacted in the column at high constant hy- draulic gradient to reduce the testing duration to reason- able period. Pressure gauge is connected to the influent reservoir and to the column assembly. A uniform pressu re of 15 kPa is maintained throughout the ex-perimental pe- riod by controlling the flow rate from the influent reser- voir. 3.4 Relative Concentration of Sodium Ion in the Effluent The Effluent is collected in the effluent collector con- sisting o f a m easur i ng ja r co ve red at t he top so as t o a v oi d evaporation of collected leachate. The volume of the ef- fluent that comes out of the colu mn with time was moni- tored at regular intervals and the concentration of sodium ion is measured. Know ing the initial and concen tration of sodium after different intervals, relative concentration (C/C0) of sodium is calculated and the breakthrough cur- ves are plotted. 4. Determination of Effective Diffusion Coeffiecients Simple solutions to Ogata Bank’s equation allowed de- termination of the diffusion coefficient using experimen- tal results. In order to obtain the values of effective dif- fusion coefficients, a plot of relative concentration versus time or number of pore volumes are plotted. From the plot the time (t0.16) corresponding to C/C0 = 0.16 and time (t0.84) corresponding to C/C0 = 0.84 are obtained. e 0 C1 1U erfc C2 2UD/vL Using these values and knowing the thickness of liner (L) and k nowin g the v a lue o f velocity, effective diffusion coefficient is calculated using the following Ogata Bank’s equation: U = vnAt/ALn = vt/L J0.84 = [(U – 1)/U1/2], when C/C0 = 0.84 J0.16 = [(U – 1)/U1/2], when C/C0 = 0.16 From which De = vL/8 [J0.84 – J0.16]2 In addition to the above modified Ogata Bank’s equa- tion another expression for calculating the effective dif- fusion co-efficient of ionic s pecies of interest are given [9] as follows: 2 0.16 0.84 e 0.16 0.84 xvt xvt 1 D8tt Copyright © 2010 SciRes. MSA  Impact of Sulphate Counter Ion in the Migration of Sodium Ion Through Soils 49 where t0.16 = time at C/C0 = 0.16; t0.84 = time at C/C0 = 0.84 It was observed that the values of effective diffusion co-efficient obtained using both Ogata Bank’s equation and Fried and Cambarnous equation were same. 5. Results and Discussion The various aspects examined for Brown Earth and Red Earth are 1) Rate of flow of salt solution through the compacted soil column; 2) Variation of concentration of individual ions in the effluent with time; 3) Calculation of diffusion coefficient of ions; 4) Prediction of the breakthrough curves. 5.1 Brown Earth Rate of flow of sodium sulphate solution through soil column: Brown earth is compacted into the column assembly and initially saturated with distilled water. Then the so- dium sulphate solution containing 1000 ppm of sodium is passed through the soil column under a pressure of 15 kPa. The rate of flow of the leachate through the soil colum n is monitored. While carrying out column experiments it is necessary to monitor the rate of flow of influent fluid through soil column. For this the volume of leachate (or effluent) col- lected for different periods is measured. Using this data variation of rate of flow with time is plotted as shown in Figure 2. From the graph it can be observed that the variation of rate of fl ow is almost constant with an average rate of flow being 3.78 × 10⁻⁴ cm3/s. This amounts to an average permeability of about 1.1 × 10⁻⁶ cm/s. It can be seen from Figure 3 that the cumulative vol- ume increases linearly upto about 480 hours with the cumulative rate of leachate flow being about 8.26 × 10⁻⁴ cm3/s. With further increase in time leachate flow rate reduces with an average cumulative flow rate being 4.35 × 0.0002 0.00025 0.0003 0.00035 0.0004 0.00045 0.0005 0.00055 0.0006 0.00065 0 1000200030004000500 Cumulative time (Hours) Flow rate (cm3/sec) 0 Sodium Sulphate Brown Earth Figure 2. Variation of flow rate of sodium sulphate solution with time in Brown Earth 10-4 cm3/s and hence velocity also reduces. This decrease in velocity may be due to precipitation of salts formed by reaction between leachate and the soil. Proba bly Ca2+ ions present on the surface of clay particles as exchangeable ions reacts with sulphate to form Ca2SO4. Ca2+Clay + Na2SO4 Ca2SO4 + Na+Clay Normally Na+ ions cannot replace exchangeable Ca2+ from clay exchangeable ion complex. But because of precipitation of Ca2SO4, Calcium ions are removed from ion complex and Na+ ions get into exchangeable ion complex. With increase in time all the exchangeable Ca2+ are precipitated as Ca2SO4. No more precipitation occurs after the complete removal of available calcium and the rate of flow through th e soil remains constant. Then the seepage velocity remains fairly constant for long time. This constant velocity is about 5.46 × 10⁻⁶ cm/s. Variation of concentration of sodium ion with cumu- lative time. The effective diffusion coefficients of ions in both the soils were determined from the curve of variation of concentration with time using the Ogata Bank’s equation. The detailed calculations are shown in Table 2. Figure 4 shows the variation of relative concentration of sodium ion with cumulative time, which represents the breakthrough curve of sodium. From the graph it can be seen that, the curve is S-Shaped and the relative concen- tration increasing gradually with time. 50% of the initial concentration (i.e., C/C0 = 0.5) of Na+ is reached at 2210 hours and 100% of initial concentration (i.e., C/C0 = 1) after 4854 hours. From the curve the value of t0.16 (time corresponding to C/C0 = 0.16) and t0.84 (time corresponding to C/C0 = 0.84) are obtained which are used in calculating the diffusion co-efficient of Na+ ion. The diffusion co- efficient of Na+- ion as calculated is 2.771 × 10⁻⁶. Also the total time taken for the leachate to reach C/C0 = 1 is obtained which is useful in designing the thickness of liner. 5.2 Red Earth Rate of flow of sodium sulphate solution through Red Earth soil column. 0 1000 2000 3000 4000 5000 6000 7000 8000 01000 2000 3000 4000 5000 6000 Cumulative Time (Hours) Cumulative V olu me (cm3) Sodium Sul phate Brown Ea rth Figure 3. Variation of cumulative volume with time for Brown Earth Copyright © 2010 SciRes. MSA  50 Impact of Sulphate Counter Ion in the Migration of Sodium Ion Through Soils Table 2. Calculation of effective diffusion coefficient of so- dium ions in soils Soil Type Sl. No. Parameters B rown Earth Red Earth 1 Hydraulic conductiv- ity, k, cm/sec 1.10E-06 2.99E-06 2 Darcy velocity, V, cm/sec 5.49E-06 1.50E-05 3 t0.16 in hours 2110 587 4 t0.84 in hours 3009 772 5 U0.16= 0.16 vt L 1.390 1.055 6 U0.84= 0.84 vt L 1.982 1.388 7 vL/8 2.059E-05 5.618E-05 8 U0.16 - 1 0.3901 -0.055 9 U0.84-1 0.982 0.388 10 U0.16 1.17901 0.762 11 U0.84 1.408 1.273 12 0.16 0.16 0.16 U-1 J=U 0.331 -0.072 13 0.84 0.84 0.84 1U JU 0.698 0.305 14 [J0.84 - J0.16] -0.367 -0.377 15 [J0.84 - J0.16]2 0.135 0.143 16 De=vL/8 * [J0.84 - J0.16]2 cm2/sec 2.770E-06 7.995E-06 17 D0 cm2/sec 1.33E-05 1.33E-05 18 = De/D0 0.208 0.601 As explained earlier the Red Earth soil sample is compacted in 3 equal layers to 0.85 times dry density and dry of optimum by 2% and i nitially saturated with distilled water. Then the influent sodium sulphate solution con- taining 1000 ppm of sodium and 2088 ppm of sulphate is passed throu gh the Red Earth soil col umn under a constant pressure of 15 kPa, and the volume of effluent flow through the Red Earth soil column is monitored. 0 0.2 0.4 0.6 0.8 1 1.2 05001000 1500 2000 2500 3000 3500 4000 4500 5000 5500 Cumulative Time ( Hours) C/C o Sodium Brown Earth Figure 4. Variation of relative concentration of sodium with time for brown earth Figure 5 shows the variation of rate of flow of sodium sulphate through column. It can be seen from the graph that the rate of flow is almost constant throughout the experiment wit h an average flow rate of 1. 052 × 10-3 cm3/s. Thus the permeability of Red Earth to leachate is about 2.99 × 10⁻⁶ cm/s. Figure 6 shows the variation of cumulative volume of leachate with cumulative time. From the graph it can be observed that the cumulative volume increases almost linearly with time without much change. Hence the cumulative rate of flow of leachate remains almost con- stant at about 1.25 × 10⁻³ cm3/s. Also the velocity also remains constant and is found to be about 1.50 × 10⁻⁵ cm/s. However this velocity is more compared to that of Brown Earth, which is attributed to the fact that velocity of a flui d in soil mainly depends on its porosity. Even though porosities of Brown Earth and Red Earth are nearly same seepage velocity is more in Red Earth than in Brown Earth. This is because the amount of ab- sorbed water present in voids is different for differe nt soils. The higher the CEC, higher would be adsorbed water. Thus, in Red Earth amount of adsorbed waters with CEC of 18.5 meq/100 g is less than that of Brown Earth with CEC of 30.77 meq/100 g. Variation of concentration of sodium ion with cumula- tive time. 0.0E+00 5.0E-04 1.0E-03 1.5E-03 2.0E-03 2.5E-03 3.0E-03 3.5E-03 4.0E-03 05001000 1500 20002500 3000 Cumulative time (Hours) Flow Rate (cm 3 / sec) Red Earth Figure 5. Variation of flo w rate of sodium sulphate with time in Red Earth Copyright © 2010 SciRes. MSA  Impact of Sulphate Counter Ion in the Migration of Sodium Ion Through Soils 51 0 2000 4000 6000 8000 10000 12000 05001000 1500 2000 2500 3000 CUm u lativ e Tim e ( Hou r s ) Cumulative Volume (cm3) Sodi um S ul phat e Red Eart h Figure 6. Variation of cumulative volume with time for Red Earth Figure 7 shows the variation of relative concentration of sodium with cum ulative time for Red Earth soil sample. From the graph it can be observed that the curve is S-Shaped and the relative concentration increasing gradually with time. 50% of the initial concentration (i.e. , C/C0 = 0.5) of Na+ reaches at 696 hours and 100% of initial concentration (i.e., C/C0 = 1) after 2113 hours. From the curve the value of t0.16 (time corresponding to C/C0 = 0.16) and t0.84 (time corresponding to C/C0 = 0.84) are obtained which are used in calculating the diffusion co-efficient of Na+ ion. The diffusion co-efficient of Na+ ion as calculated is 8.0E-06. Also the total time taken for the leachate to stabilize, i.e., to reach C/C0 = 1 is obtained which is useful in designing the thickness of liner. 5.3 Comparison of Variation of Concentration of Sodium Ion in Brown Earth and Red Earth From Figure 8, it can be observed that the number of pore volumes of fl ow for sodium ion to reach C/C0 = 0.5 occurs at 5 pore volume for Brown Earth and 4.15 pore volume for Red Eart h. Thus the breakthrou gh of sodi um at C/C0 = 0.5 is h i gher fo r Brown Ear th than t h a t of Red E a r th. This is a consequence of mechanism of retention of sodium in soils, which is explained as follows. Sodium ion, considered as classical conservative ion, gets retarded in two soils studied to varying extents in the presence of sulphate. 0 0.2 0.4 0.6 0.8 1 1.2 05001000 1500 2000 2500 3000 Cumulative Time (Hours) C/C0 So di um Red E arth Figure 7. Variation of relative concentration of sodium with time for Red Earth C/C 0 Number of Pore volumes of flow Brown Earth Red Ea rt h Sodium Figure 8. Variation of relative concentration of sodium with time for Brow n Earth and Red Earth The retardation of so dium is due to retention of s odium in place of exchangeable calcium. Calcium cannot nor- mally be replaced by sodium. But in the presence of sul- phate ion, calcium can form insoluble salt and is removed from ion complex of the clay. Then sodium occupies the exchangeable position and is retained. The higher the cation exchange capacity of the soil with respect to cal- cium the higher should be the retention. 5.4 Effect of Sulphate Ion on Theoretical Break through Curves of Sodium in Brown Earth and Red Earth Using the experimental determined effective diffusion coefficient and knowing the field hydraulic data simula- tions were conducted with available m athematical models using Matlab v 6 to predict bre akthroug h curves of sodium ion for the soils. Breakthrough curves of sodium ion in soils are obtained using Ogata Bank’s Equation (10) for advection-dispersion process. Figure 9. Breakthrough curves for sodium ion in Brown Earth and Red Earth Copyright © 2010 SciRes. MSA  52 Impact of Sulphate Counter Ion in the Migration of Sodium Ion Through Soils Copyright © 2010 SciRes. MSA ss 0e e C1 ZvtvZZvt erfcexp erfc C2 D 2(Dt) 2(Dt) s e where, C/C0 = ratio of effluent concentration to influent concentration De = Effective diffusion coefficient of contaminating species Z = Thickness of the liner t = Time vs =Seepage velocity of pore fluid Two types of compacted soils were considered in the simulation. The thickness of the clay layer used in the liner system was 1 m. For obtaining vs, the usual perme- ability of most in-situ soils of about 1.25 × 10⁻⁷ cm/s and porosity of about 0.4 is assumed. The hydraulic gradient of 1 is taken. The theoretical breakthrough curves of so- dium obtained are presented in Figure 9. It can be ob- serv ed th at us ing th e exp eri mentally determined effective diffusion coefficient and assuming the same field condi- tions breakthrough of so dium ion in Brow n Earth is about 24 years where as for Red Earth is about 11 years. Thus it can be concluded that sodium ion is taking considerably more time for breakthrough in Brown Earth than in Red Earth. Thus the effect of small variation in the effective diffusion coefficients is significant on breakthrough times. 6. Conclusions 1) The number of pore volumes required for break- through for sodium is higher for Brown Earth than Red Earth. Consequently the effective diffusi on co-efficient of sodium is much lower for Brown Earth than Red Earth. Because of higher cation exchange capacity of Brown Earth sodium is retarded more in B rown Eart h than in Red Earth. 2) The reason for the retardation of sodium by these soils is the exchange of sodium with calcium ions from the exchangeable complex of clay. The exchange is possible because of removal of calcium from the exchangeable complex to form calcium sulphate, sodium ions occupy exchangeable sites and are retarded. 3) At same field conditions small variation in the ef- fective diffusion coefficient causes large variations in the breakthrough times for different type of soils. REFERENCES [1] R. A. Freeze and J. A. Cherry, “Groundwater,” Prentice- Hall, Inc., EngleWood Cliffs, 1979. [2] D. E. Daniel and C. D. Shackel ford, “Diffu sion in Sat urated Soil. I: Background,” Geotechnical Engineering, Vol. 117, No. 3, 1991, pp. 467-484. [3] R. W. Gillham and J. A. Cherry, “Contaminant Transport by Ground Wate r in Non Indurated Deposits, in Rec ent Trends in Hydrogeology,” In: T. N. Narisimhan, Ed., Geological Society of America, 1982, pp. 31-62. [4] Y. Acar and L. Haider, “Transport of Low-Concentration Contaminant in Saturated Earthen Barriers,” Geotechnical Engineering, Vol. 116, No. 7, 1990, pp. 1031-1052. [5] R. K. Rowe, R. M. Quigley and R. J. Booker, “Clayey Barrier Systems for Waste Disposal Facilities,” E & FN Spon Press, London, 1995. [6] H. D. Sharma and S. P. Lewis, “Waste Containment Systems, Waste Stabilization and Landfills: Design and Evaluation,” John Wiley & Sons Inc., New York, 1994. [7] C. D. Shackelford, “Labora tory Diffusion Testi ng for Waste Disposal: A Review,” Journal of Contaminant Hydrology, Vol. 7, No. 3, 1991, pp. 177-217. [8] F. S. Barone, E. K. Yanful, R. M. Quigley and R. K. Rowe, “Effect of Multiple Contaminant Migration on Diffusion and Adsorption of Some Domestic Waste Contaminants in a Natural Clayey Soil,” Canadian Geotechnical Journal,Vol. 26, 1988, pp . 189-1 98. [9] J. J. Fried and M. A. Combarnous, “Dispersion in Porous Media,” In: Show, V. T. Ed., Advances in Hydroscience, Academic Press, New York, Vol. 7, 1971, pp. 169-282. [10] A. Ogata and R. B. Banks, “A Solution of the Differential Equation of Longitudinal Dispersion in Porous Media,” US Geological S urvey , No. 411-A, 1961, p. 7. |