Paper Menu >>
Journal Menu >>
 Journal of Minerals & Materials Characterization & Engineering, Vol. 9, No.10, pp.887-906, 2010 jmmce.org Printed in the USA. All rights reserved 887 Effects of Reinforcement Combinations of Calcium Carbonate Nanofiller on the Mechanical and Creep Properties of Polypropylene Chris Chukwutoo Ihueze1* and Chinedum Ogonna Mgbemena2 1Department of Industrial / Production Engineering, Nnamdi Azikiwe University Awka 2Department of Mechanical Engineering, Nnamdi Azikiwe University Awka *Corresponding Author: ihuezechukwutoo @yahoo.com ABSTRACT This paper investigated the effects of calcium cabonate nanofiller on the mechanical behavior of homo polypropylene by conducting tensile and creep tests. The Young’s Modulus of the nanocomposite showed some improvement with the incorporation of the calcium carbonate nano-filler while the tensile strength deteriorated. The stearic acid coated fillers showed the highest improvement in the above tensile properties at low volume fractions not exceeding 0.10 while the deformation rate increases with the inclusion of the nanofiller. The creep parameters evaluated include optimum elastic modulus estimated as 2GPa at 10% volume fraction, creep rate at ambient as 0.004-0.043hr-1, and creep limit at ambient as 60-113MPa as opposed to the tensile strength of PPC predicted as 45MPa for treated and 37.5MPa for untreated, all as against 123MPa for neat and unreinforced PP, though at 0.05 volume fraction the tensile strength was evaluated as 140MPa and 133.3MPa for coated and uncoated PPC respectively. Keywords: volume fraction, nanofiller , mechanical and creep properties, minimum creep rate, minimum creep strength, limit strain. 1. INTRODUCTION Nanocomposites have attracted attention in recent years because of improved mechanical, thermal, solvent resistant and fire retardant properties compared to the pure or conventional composite materials. Manias[1] defined nanocomposites as multi-phase solid materials where one of the phases has one, two or three dimensions of less than 100 nano metres (nm) or structures with nano-scale repeat distances between the different phases that make up the material.  888 C.C. Ihueze and C.O. Mgbemena Vol.9, No.10 Polypropylene is isotactic, notch sensitive and brittle under severe conditions of deformation such as low temperature or high temperature, hence limiting wider range of usage for manufacturing process. It is a versatile material widely used for automotive components, home appliances, and industrial applications attributed to their high impact strength and toughness when filler is incorporated. To meet demanding engineering and structural specifications, PP is rarely used in its original state and is often transformed into composites by the inclusion of fillers or reinforcements. Introduction of fillers or reinforcements into PP often alters the crystalline structure and morphology of PP and consequently results in property changes [2]. Among the promising nanofillers that have stirred much interest among researchers include organo clay, nano silica, carbon nano tube and nano calcium carbonate. Studies have shown that the large surface area possessed by these nano fillers promotes better interfacial interactions with the polymer matrix compared to conventional micrometer sized particles, leading to better property enhancement [3]. There are a number of inorganic mineral fillers used in polypropylene. The most common of these fillers are talc, calcium carbonate and barium sulphate; other mineral fillers used are wollastonite and mica. Mineral fillers are generally much less expensive than polypropylene resin itself. Mineral fillers reduce the costs of the compound formed with polypropylene and also increase the stiffness. Mineral fillers also provide reinforcement to the polymer matrix as well. Some mineral filler are surface treated to improve their handling and performance characteristics [4]. Silanes, glycols, and stearates are used commercially to improve dispersion and processing, as well as to react with impurities. Loadings of CaCO3 in PP typically run from 10 to 50%, although concentration as high as 80% has been produced [5]. CaCO3 is usually selected as filler when a moderate increase in stiffness is desired. The main secondary additive employed in CaCO3 is a stearate. The stearic acid acts as a processing aid, helping to disperse the CaCO3 particles. It also helps to prevent the absorption of stabilizers into the filler. Finally, as an added benefit, it acts to cushion the system, resulting in improved impact. The dispersion qualities of CaCO3 particles play a crucial role in its toughening efficiency. Also [5-10] studied the compounding methods for PP reinforced with different nanofiller loadings of calcium carbonate to specify appropriate loading for optimum dispersion of filler at 0.10 volume fraction. The visco-elastic nature of the matrix in many reinforced plastics causes their properties to be time and temperature dependent. Under a constant stress they exhibit creep which will be more pronounced as the temperature increases [11]. The mechanical properties of plastics are therefore viscoelastic, this means that they vary with time under load, the rate of loading and the temperature. Reinforcements are expected to improve the mechanical properties associated with  Vol.9, No.10 Effects of Reinforcement Combinations of Calcium Carbonate Nanofiller 889 creep; hence this study investigates the influence of reinforcements on the mechanical properties associated with creep and the influence of creep on the PP/ CaCO3 nanocomposites mechanical properties. 2. EXPERIMENTAL, THEORETICAL AND COMPUTATIONAL CONSIDERATIONS 2.1 Materials and Sample Preparation The grade of polypropylene used in this work was SEETEC Homo polymer PP by LG Chem Korea. This acts as the matrix. The homo polymer PP has a density of 0.90g/cm3 and a melt flow rate of 14g/10 minutes (2.16kg at 230oC). The nano filler used in this work was calcium carbonate purchased from the local market in Aba. The calcium carbonate used was CALCO brand by Freedom Chemical Industries Nigeria which is of 44nm in particle size. The mould release agent used was Petroleum jelly (Vaseline). The nanocomposites of this work were prepared by melting the PP in a mixer and melt compounding it with a coated calcium carbonate and uncoated calcium carbonate respectively at filler loadings of 0%, 5%, 10%, 15%, 20%, 25%, 30%, 35% to 60% volume fractions of the coated and uncoated calcium carbonate respectively. The tensile samples were cast in a collapsible aluminum mould in accordance with ASTM standard D638 for tensile tests and the creep specimen was prepared as dumbbells by compression moulding in accordance to ASTM D2990 for tensile creep tests. The PP was melted from its pelletized form at a temperature exceeding 1800C in a mixing container. Measured amounts of calcium carbonate was added to the melted PP by volume fractions and stirred continuously for 10 minutes to ensure a uniform dispersion of the mixture. The compounded mixture was cast in an aluminum mould that has been treated with a mould releasing agent and dried. The composite was allowed to cure and was later de-moulded. The above procedure was repeated for the stearic acid coated calcium carbonate previously prepared at 5%, 10%, 15%, 20%, and 30% to 60% volume fractions as shown in Table 1. 2.2 Properties of Composites and Computational Relations The mass of a nanocomposite material is the sum of the masses of the matrix (polymer) and the re-enforcing phase (filler). The properties of a composite material are a function of the starting materials [12] . The modulus of elasticity of the particle filled composite may be predicted using the following equations: φ φ φφ  890 C.C. Ihueze and C.O. Mgbemena Vol.9, No.10 where E = Modulus of elasticity, φ = volume fractions, Subscripts c, f and p represent the composites, filler and polymer [10, 13]. Also Guth [14] developed a relation for computing the modulus of composites of spherical particulate fillers as φ φ where E is the Young’s modulus of the composite, Em is the matrix Young’s modulus and φ is the volume fraction of the filler. It has been reported that equation (3) is only applicable to composites filled with a certain amount of spherical fillers. If the filler concentration is higher than 0.10, the modulus increases much more rapidly than equation (3) would predict, attributed to the formation of a network by the spherical filler [10]. Table 1: Compositions of Constituents taken for Experiments by Volume Fractions Specimen Code PP Coated CaCo3 Uncoated CaCo3 PPC – 0 – – – PPC – 1 0.95 0.05 0.05 PPC – 2 0.90 0.10 0.10 PPC – 3 0.85 0.15 0.15 PPC – 4 0.80 0.20 0.20 PPC – 5 0.75 0.25 0.25 PPC – 6 0.70 0.30 0.30 PPC – 7 0.65 0.35 0.35 PPC – 8 0.60 0.40 0.40 PPC – 9 0.55 0.45 0.45 PPC – 10 0.50 0.50 0.50 PPC – 11 0.40 0.60 0.60 2.3 Mechanical Properties Testing and Evaluation The tensile experiments were performed on ABBA Universal Testing Machine at CUTIX PlC, Nnewi at a laboratory temperature of 250C with a cross head speed of 100mm/minute. A minimum of six samples were tested in each case for the coated and uncoated specimen at their various volume fractions. The results of this section are as in Tables 2 and 3. 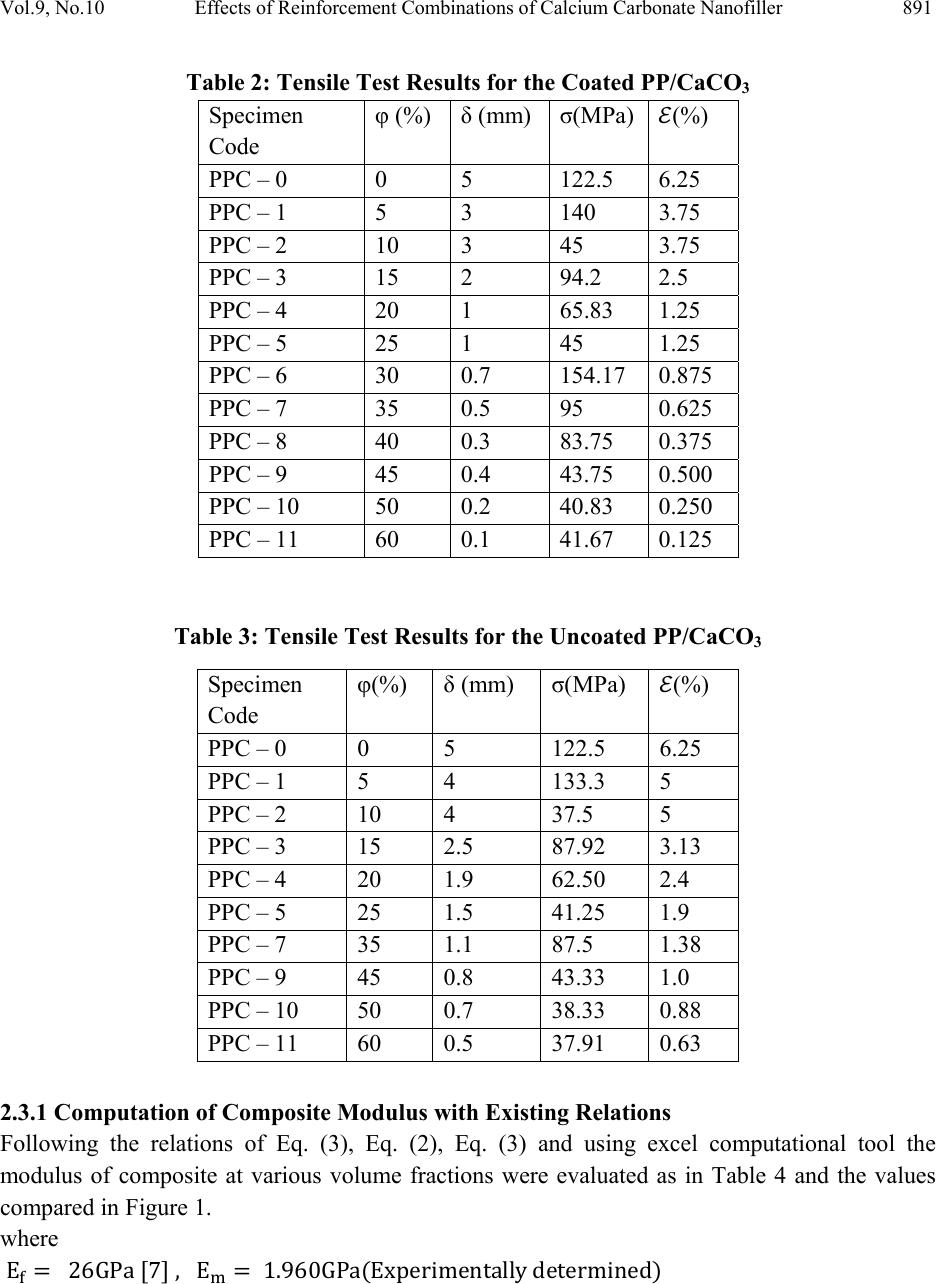 Vol.9, No.10 Effects of Reinforcement Combinations of Calcium Carbonate Nanofiller 891 Table 2: Tensile Test Results for the Coated PP/CaCO3 Specimen Code φ (%) δ (mm) σ(MPa) (%) PPC – 0 0 5 122.5 6.25 PPC – 1 5 3 140 3.75 PPC – 2 10 3 45 3.75 PPC – 3 15 2 94.2 2.5 PPC – 4 20 1 65.83 1.25 PPC – 5 25 1 45 1.25 PPC – 6 30 0.7 154.17 0.875 PPC – 7 35 0.5 95 0.625 PPC – 8 40 0.3 83.75 0.375 PPC – 9 45 0.4 43.75 0.500 PPC – 10 50 0.2 40.83 0.250 PPC – 11 60 0.1 41.67 0.125 Table 3: Tensile Test Results for the Uncoated PP/CaCO3 2.3.1 Computation of Composite Modulus with Existing Relations Following the relations of Eq. (3), Eq. (2), Eq. (3) and using excel computational tool the modulus of composite at various volume fractions were evaluated as in Table 4 and the values compared in Figure 1. where Specimen Code φ(%) δ (mm) σ(MPa) (%) PPC – 0 0 5 122.5 6.25 PPC – 1 5 4 133.3 5 PPC – 2 10 4 37.5 5 PPC – 3 15 2.5 87.92 3.13 PPC – 4 20 1.9 62.50 2.4 PPC – 5 25 1.5 41.25 1.9 PPC – 7 35 1.1 87.5 1.38 PPC – 9 45 0.8 43.33 1.0 PPC – 10 50 0.7 38.33 0.88 PPC – 11 60 0.5 37.91 0.63 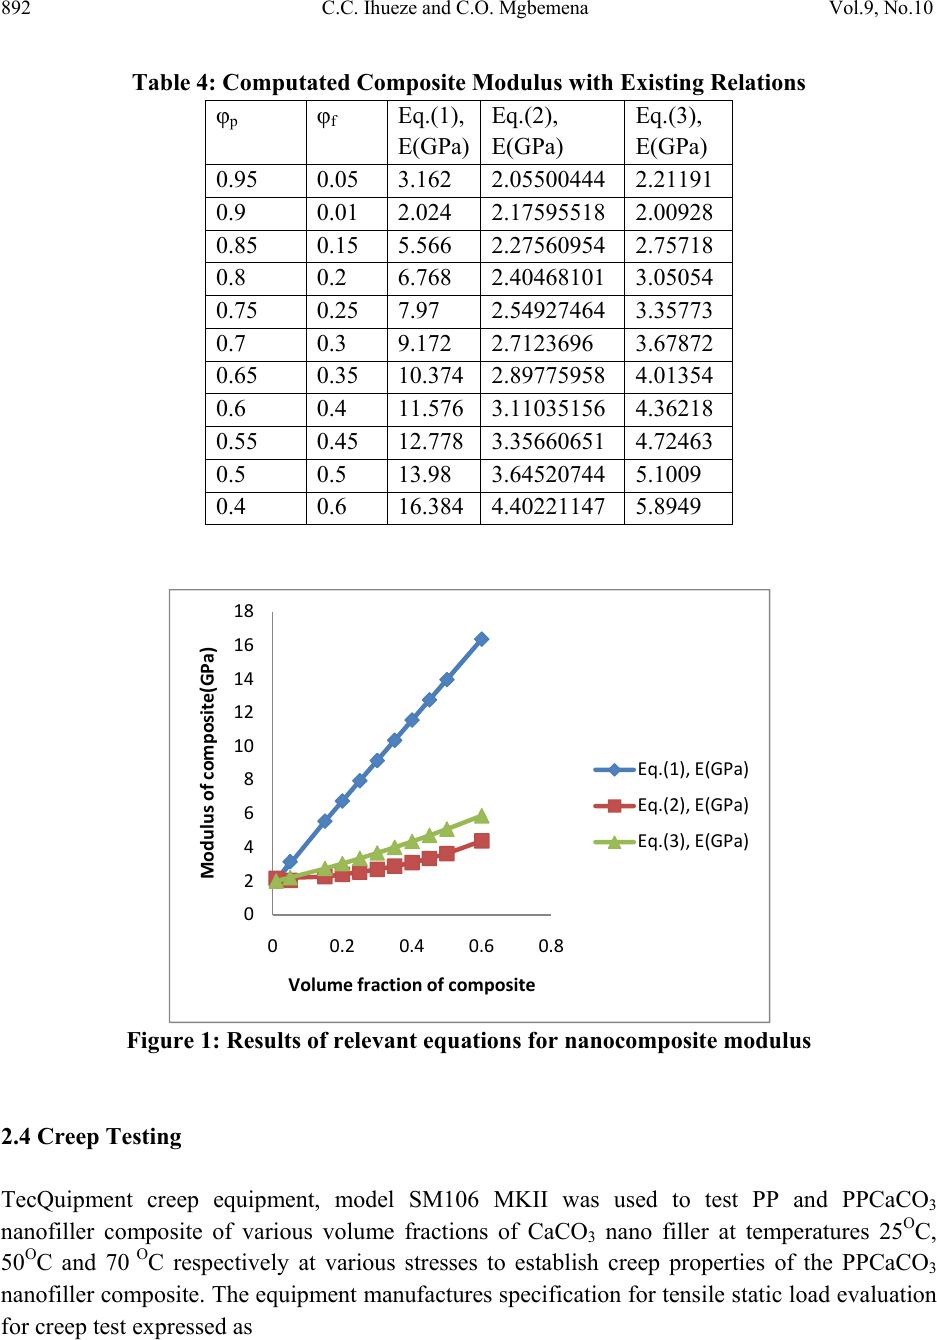 892 C.C. Ihueze and C.O. Mgbemena Vol.9, No.10 Table 4: Computated Composite Modulus with Existing Relations φp φf Eq.(1), E(GPa) Eq.(2), E(GPa) Eq.(3), E(GPa) 0.95 0.05 3.162 2.05500444 2.21191 0.9 0.01 2.024 2.17595518 2.00928 0.85 0.15 5.566 2.27560954 2.75718 0.8 0.2 6.768 2.40468101 3.05054 0.75 0.25 7.97 2.54927464 3.35773 0.7 0.3 9.172 2.7123696 3.67872 0.65 0.35 10.374 2.89775958 4.01354 0.6 0.4 11.576 3.11035156 4.36218 0.55 0.45 12.778 3.35660651 4.72463 0.5 0.5 13.98 3.64520744 5.1009 0.4 0.6 16.384 4.40221147 5.8949 Figure 1: Results of relevant equations for nanocomposite modulus 2.4 Creep Testing TecQuipment creep equipment, model SM106 MKII was used to test PP and PPCaCO3 nanofiller composite of various volume fractions of CaCO3 nano filler at temperatures 25OC, 50OC and 70 O C respectively at various stresses to establish creep properties of the PPCaCO3 nanofiller composite. The equipment manufactures specification for tensile static load evaluation for creep test expressed as 0 2 4 6 8 10 12 14 16 18 00.2 0.4 0.6 0.8 Modulusofcomposite(GPa) Volumefractionofcomposite Eq.(1),E(GPa) Eq.(2),E(GPa) Eq.(3),E(GPa) 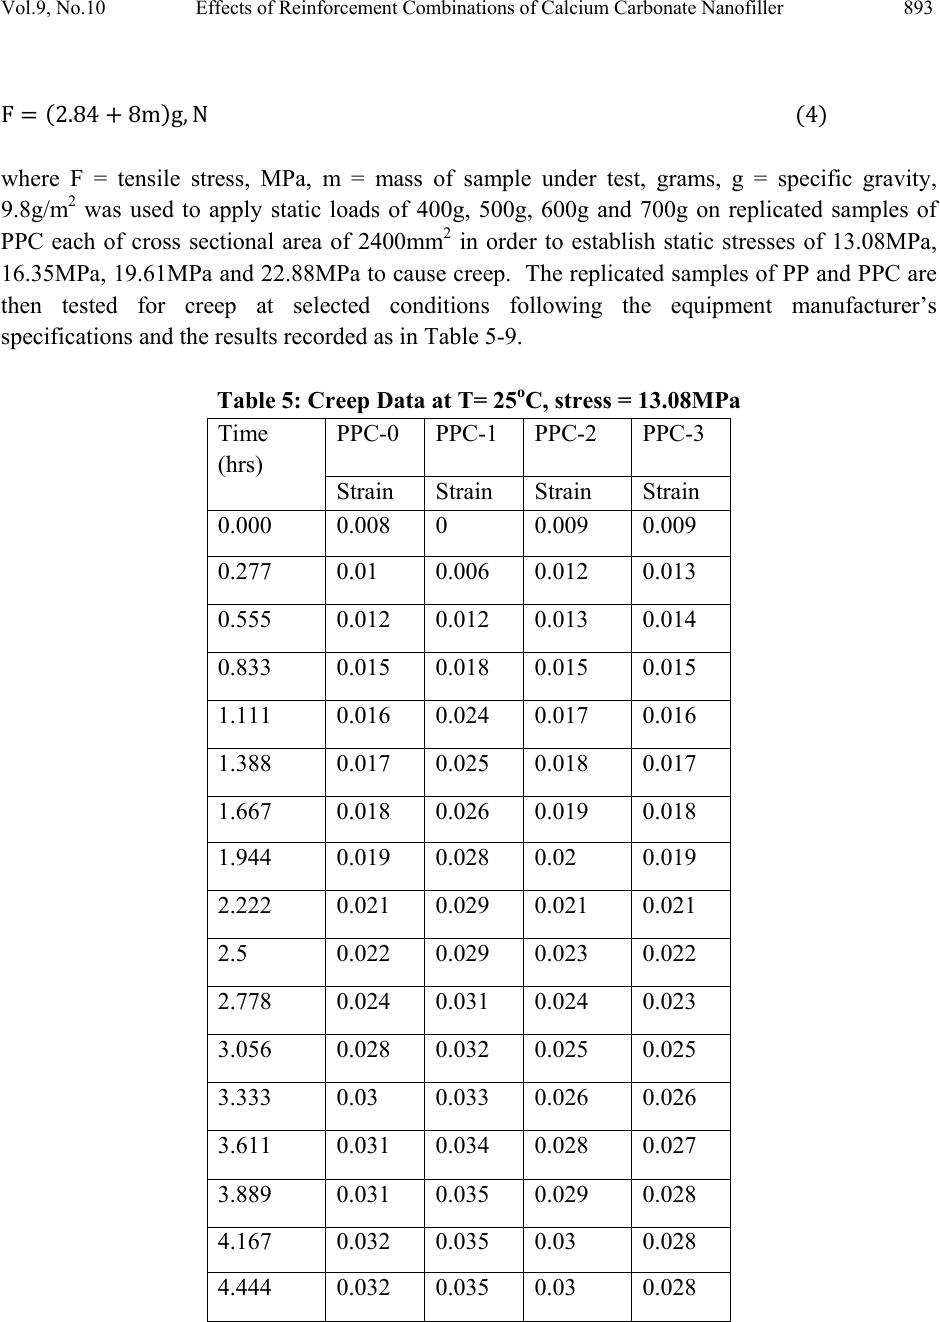 Vol.9, No.10 Effects of Reinforcement Combinations of Calcium Carbonate Nanofiller 893 where F = tensile stress, MPa, m = mass of sample under test, grams, g = specific gravity, 9.8g/m2 was used to apply static loads of 400g, 500g, 600g and 700g on replicated samples of PPC each of cross sectional area of 2400mm2 in order to establish static stresses of 13.08MPa, 16.35MPa, 19.61MPa and 22.88MPa to cause creep. The replicated samples of PP and PPC are then tested for creep at selected conditions following the equipment manufacturer’s specifications and the results recorded as in Table 5-9. Table 5: Creep Data at T= 25oC, stress = 13.08MPa Time (hrs) PPC-0 PPC-1 PPC-2 PPC-3 Strain Strain Strain Strain 0.000 0.008 0 0.009 0.009 0.277 0.01 0.006 0.012 0.013 0.555 0.012 0.012 0.013 0.014 0.833 0.015 0.018 0.015 0.015 1.111 0.016 0.024 0.017 0.016 1.388 0.017 0.025 0.018 0.017 1.667 0.018 0.026 0.019 0.018 1.944 0.019 0.028 0.02 0.019 2.222 0.021 0.029 0.021 0.021 2.5 0.022 0.029 0.023 0.022 2.778 0.024 0.031 0.024 0.023 3.056 0.028 0.032 0.025 0.025 3.333 0.03 0.033 0.026 0.026 3.611 0.031 0.034 0.028 0.027 3.889 0.031 0.035 0.029 0.028 4.167 0.032 0.035 0.03 0.028 4.444 0.032 0.035 0.03 0.028 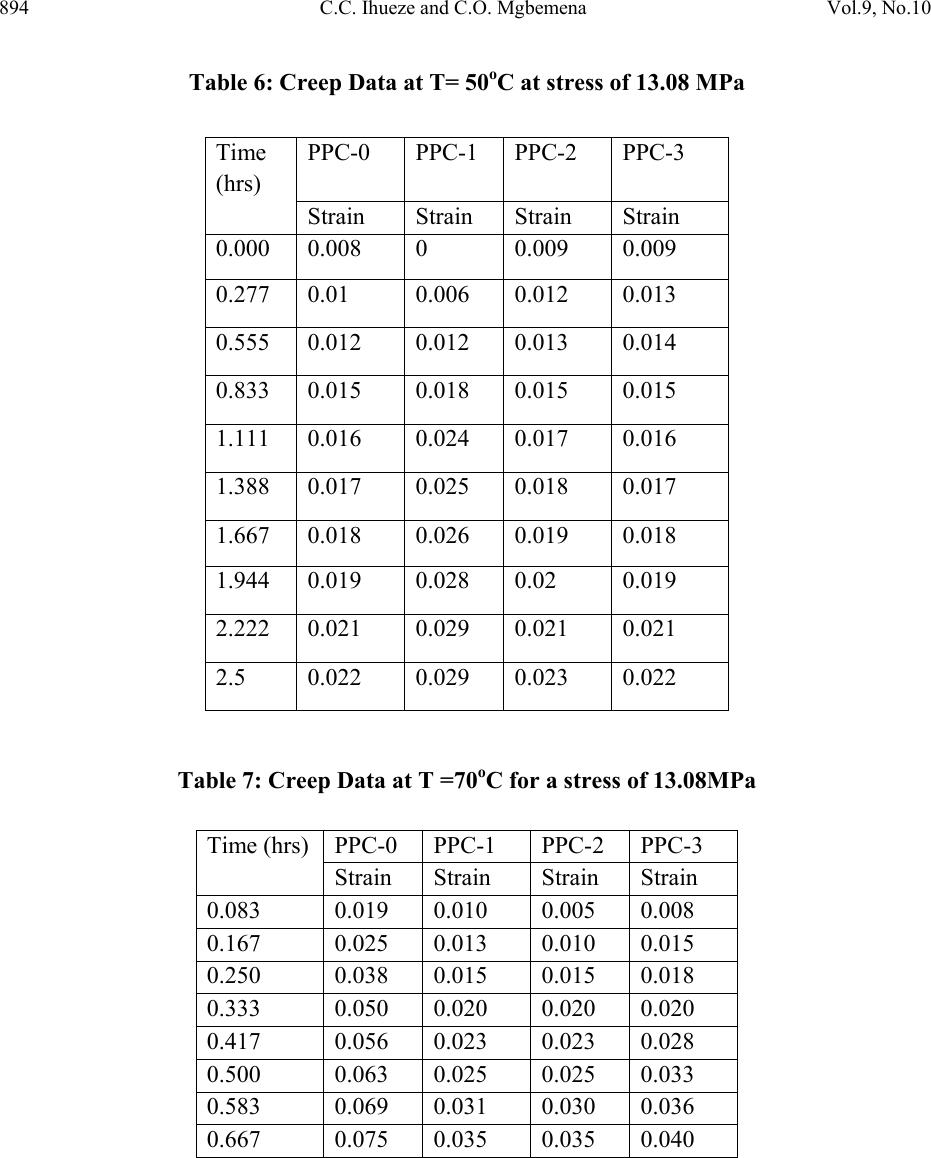 894 C.C. Ihueze and C.O. Mgbemena Vol.9, No.10 Table 6: Creep Data at T= 50oC at stress of 13.08 MPa Table 7: Creep Data at T =70oC for a stress of 13.08MPa Time (hrs) PPC-0 PPC-1 PPC-2 PPC-3 Strain Strain Strain Strain 0.083 0.019 0.010 0.005 0.008 0.167 0.025 0.013 0.010 0.015 0.250 0.038 0.015 0.015 0.018 0.333 0.050 0.020 0.020 0.020 0.417 0.056 0.023 0.023 0.028 0.500 0.063 0.025 0.025 0.033 0.583 0.069 0.031 0.030 0.036 0.667 0.075 0.035 0.035 0.040 Time (hrs) PPC-0 PPC-1 PPC-2 PPC-3 Strain Strain Strain Strain 0.000 0.008 0 0.009 0.009 0.277 0.01 0.006 0.012 0.013 0.555 0.012 0.012 0.013 0.014 0.833 0.015 0.018 0.015 0.015 1.111 0.016 0.024 0.017 0.016 1.388 0.017 0.025 0.018 0.017 1.667 0.018 0.026 0.019 0.018 1.944 0.019 0.028 0.02 0.019 2.222 0.021 0.029 0.021 0.021 2.5 0.022 0.029 0.023 0.022 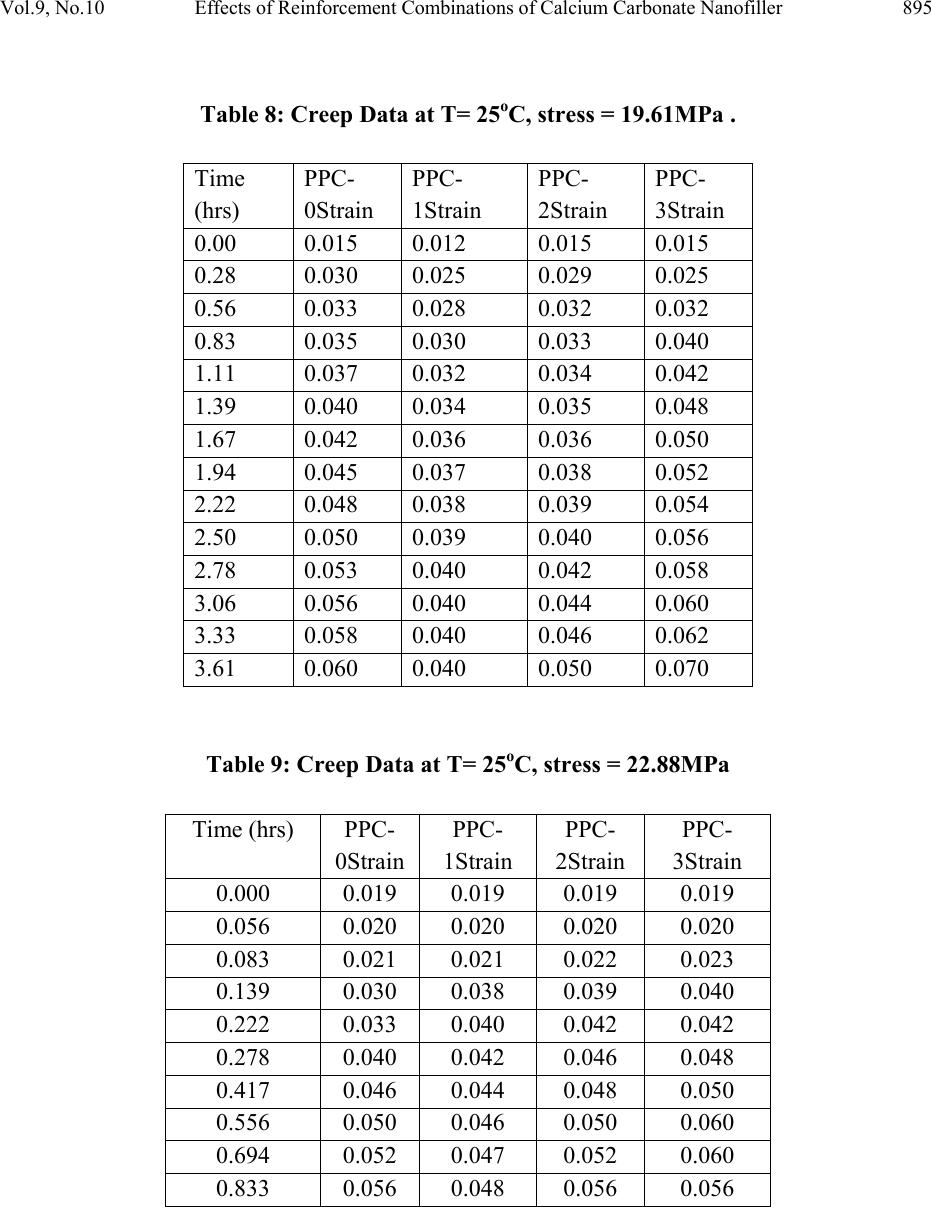 Vol.9, No.10 Effects of Reinforcement Combinations of Calcium Carbonate Nanofiller 895 Table 8: Creep Data at T= 25oC, stress = 19.61MPa . Time (hrs) PPC- 0Strain PPC- 1Strain PPC- 2Strain PPC- 3Strain 0.00 0.015 0.012 0.015 0.015 0.28 0.030 0.025 0.029 0.025 0.56 0.033 0.028 0.032 0.032 0.83 0.035 0.030 0.033 0.040 1.11 0.037 0.032 0.034 0.042 1.39 0.040 0.034 0.035 0.048 1.67 0.042 0.036 0.036 0.050 1.94 0.045 0.037 0.038 0.052 2.22 0.048 0.038 0.039 0.054 2.50 0.050 0.039 0.040 0.056 2.78 0.053 0.040 0.042 0.058 3.06 0.056 0.040 0.044 0.060 3.33 0.058 0.040 0.046 0.062 3.61 0.060 0.040 0.050 0.070 Table 9: Creep Data at T= 25oC, stress = 22.88MPa Time (hrs) PPC- 0Strain PPC- 1Strain PPC- 2Strain PPC- 3Strain 0.000 0.019 0.019 0.019 0.019 0.056 0.020 0.020 0.020 0.020 0.083 0.021 0.021 0.022 0.023 0.139 0.030 0.038 0.039 0.040 0.222 0.033 0.040 0.042 0.042 0.278 0.040 0.042 0.046 0.048 0.417 0.046 0.044 0.048 0.050 0.556 0.050 0.046 0.050 0.060 0.694 0.052 0.047 0.052 0.060 0.833 0.056 0.048 0.056 0.056 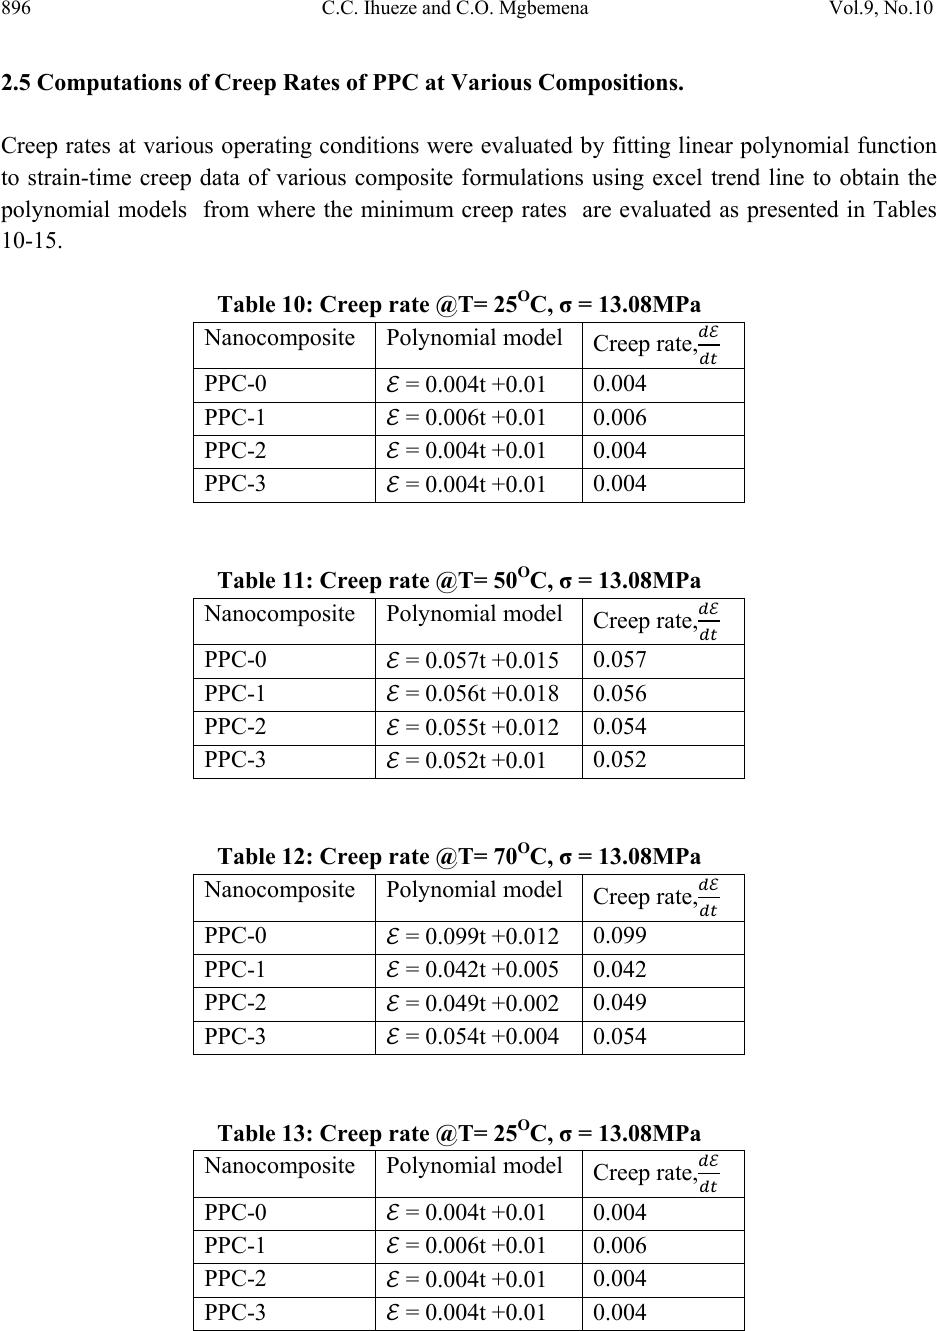 896 C.C. Ihueze and C.O. Mgbemena Vol.9, No.10 2.5 Computations of Creep Rates of PPC at Various Compositions. Creep rates at various operating conditions were evaluated by fitting linear polynomial function to strain-time creep data of various composite formulations using excel trend line to obtain the polynomial models from where the minimum creep rates are evaluated as presented in Tables 10-15. Table 10: Creep rate @T= 25OC, σ = 13.08MPa Nanocomposite Polynomial model Creep rate, PPC-0 = 0.004t +0.01 0.004 PPC-1 = 0.006t +0.01 0.006 PPC-2 = 0.004t +0.01 0.004 PPC-3 = 0.004t +0.01 0.004 Table 11: Creep rate @T= 50OC, σ = 13.08MPa Nanocomposite Polynomial model Creep rate, PPC-0 = 0.057t +0.015 0.057 PPC-1 = 0.056t +0.018 0.056 PPC-2 = 0.055t +0.012 0.054 PPC-3 = 0.052t +0.01 0.052 Table 12: Creep rate @T= 70OC, σ = 13.08MPa Nanocomposite Polynomial model Creep rate, PPC-0 = 0.099t +0.012 0.099 PPC-1 = 0.042t +0.005 0.042 PPC-2 = 0.049t +0.002 0.049 PPC-3 = 0.054t +0.004 0.054 Table 13: Creep rate @T= 25OC, σ = 13.08MPa Nanocomposite Polynomial model Creep rate, PPC-0 = 0.004t +0.01 0.004 PPC-1 = 0.006t +0.01 0.006 PPC-2 = 0.004t +0.01 0.004 PPC-3 = 0.004t +0.01 0.004 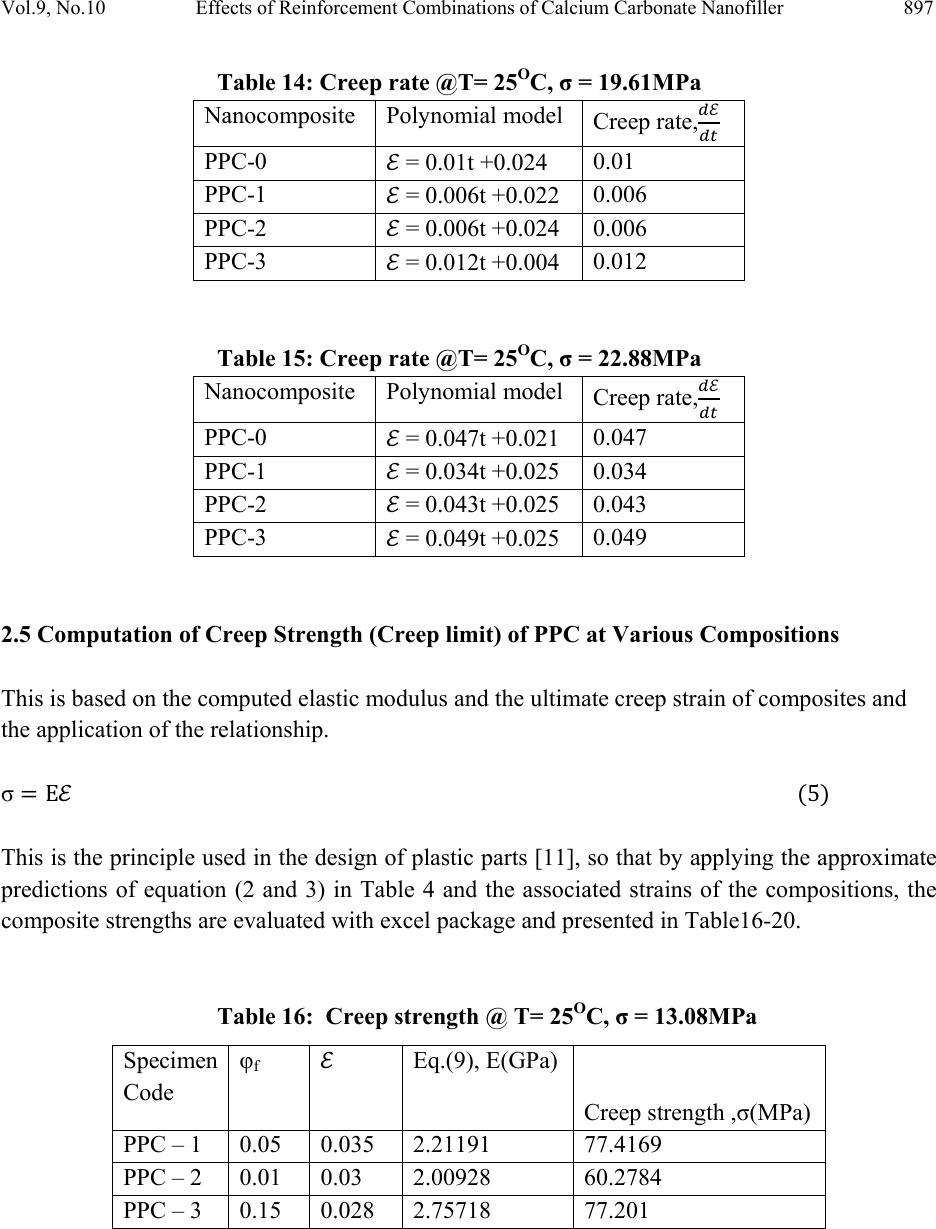 Vol.9, No.10 Effects of Reinforcement Combinations of Calcium Carbonate Nanofiller 897 Table 14: Creep rate @T= 25OC, σ = 19.61MPa Nanocomposite Polynomial model Creep rate, PPC-0 = 0.01t +0.024 0.01 PPC-1 = 0.006t +0.022 0.006 PPC-2 = 0.006t +0.024 0.006 PPC-3 = 0.012t +0.004 0.012 Table 15: Creep rate @T= 25OC, σ = 22.88MPa Nanocomposite Polynomial model Creep rate, PPC-0 = 0.047t +0.021 0.047 PPC-1 = 0.034t +0.025 0.034 PPC-2 = 0.043t +0.025 0.043 PPC-3 = 0.049t +0.025 0.049 2.5 Computation of Creep Strength (Creep limit) of PPC at Various Compositions This is based on the computed elastic modulus and the ultimate creep strain of composites and the application of the relationship. σ This is the principle used in the design of plastic parts [11], so that by applying the approximate predictions of equation (2 and 3) in Table 4 and the associated strains of the compositions, the composite strengths are evaluated with excel package and presented in Table16-20. Table 16: Creep strength @ T= 25OC, σ = 13.08MPa Specimen Code φf Eq.(9), E(GPa) Creep strength ,σ(MPa) PPC – 1 0.05 0.035 2.21191 77.4169 PPC – 2 0.01 0.03 2.00928 60.2784 PPC – 3 0.15 0.028 2.75718 77.201 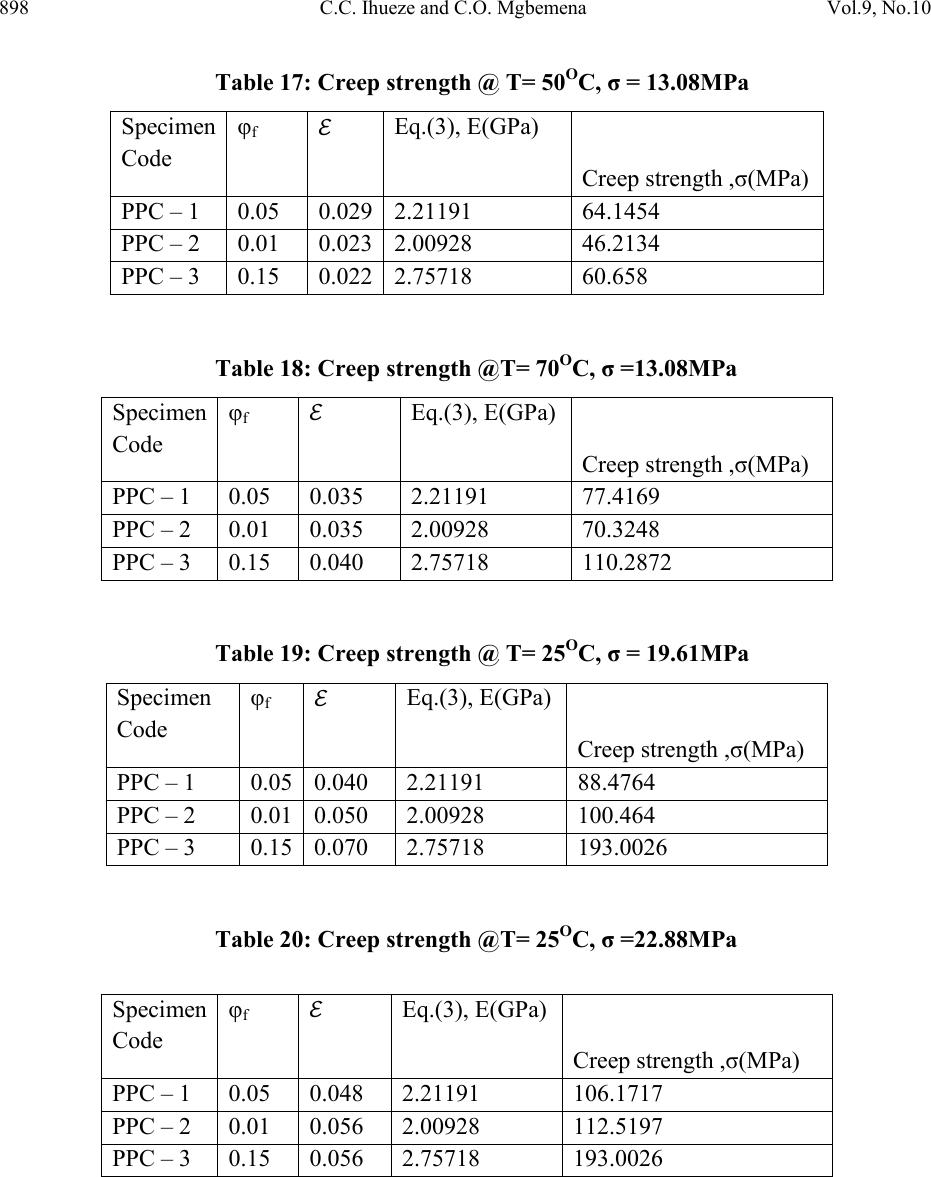 898 C.C. Ihueze and C.O. Mgbemena Vol.9, No.10 Table 17: Creep strength @ T= 50OC, σ = 13.08MPa Table 18: Creep strength @T= 70OC, σ =13.08MPa Table 19: Creep strength @ T= 25OC, σ = 19.61MPa Table 20: Creep strength @T= 25OC, σ =22.88MPa Specimen Code φf Eq.(3), E(GPa) Creep strength ,σ(MPa) PPC – 1 0.05 0.0292.21191 64.1454 PPC – 2 0.01 0.0232.00928 46.2134 PPC – 3 0.15 0.0222.75718 60.658 Specimen Code φf Eq.(3), E(GPa) Creep strength ,σ(MPa) PPC – 1 0.05 0.035 2.21191 77.4169 PPC – 2 0.01 0.035 2.00928 70.3248 PPC – 3 0.15 0.040 2.75718 110.2872 Specimen Code φf Eq.(3), E(GPa) Creep strength ,σ(MPa) PPC – 1 0.05 0.040 2.21191 88.4764 PPC – 2 0.01 0.050 2.00928 100.464 PPC – 3 0.15 0.070 2.75718 193.0026 Specimen Code φf Eq.(3), E(GPa) Creep strength ,σ(MPa) PPC – 1 0.05 0.048 2.21191 106.1717 PPC – 2 0.01 0.056 2.00928 112.5197 PPC – 3 0.15 0.056 2.75718 193.0026  Vol.9, No.10 Effects of Reinforcement Combinations of Calcium Carbonate Nanofiller 899 3. DISCUSSION OF RESULTS In order to select proper materials for high temperature applications, it is necessary to acquire accurate design parameters such as, tensile strength, elastic modulus, limit strain, creep rate and creep strength from experimental data. Table 2 and Table 3 presented the influence of reinforcement combinations, the volume fraction on the tensile properties of PP. While the elongation at break decreases with increasing volume fraction, the tensile strength at 0.10 volume fraction is 45MPa for the stearic acid coated calcium carbonate nanofiller. For the uncoated nanofiller composite the maximum tensile strength at 0.10 volume fraction was 37.5MPa, elongation at break also decreases with increasing volume fraction. Three classical equations were used to evaluate modulus of the reinforced composite at various volume fractions. Equation (1), Equation (2) and Equation (3) approximately predicted the composite modulus at 0.10 volume fraction as approximately 2GPa as shown in Table 4 [7]. It has been reported that equation (9) is only applicable to composites filled with a certain amount of spherical fillers. If the filler concentration is higher than 10 vol. %, the modulus increases much more rapidly than equation (9) would predict, attributed to the formation of a network by the spherical filler [10]. Tables 5-7 describe the influence of temperature and reinforcement combinations (volume fraction) on the creep properties of PP. The data show that deformation increases with temperature, decreases with volume fraction in the range 0.05 – 0.10 and fairly constant within the range of volume fraction specified. Tables 5, 8 and 9 show the influence of static stress level on the deformation behavior of PP at various volume fractions. Deformation was found to increase with increasing stress level but is fairly constant within the volume fraction range 0 – 0.15 considered. Creep rate at various temperature levels were evaluated by fitting first order polynomial to data of Tables 5, 6 and 7 using excel trend line on Figures 3, 4 and 5. Figures 3, 4 and 5 actually describe the steady state creep when a linear model is fit to the data. The first order steady state creep models obtained for reinforcement combinations are found in Tables 10 – 15. The creep rate at various reinforcement combinations are found in the table also, the creep rate increasing with increasing stress level. The creep limit or creep strength was also evaluated for the different reinforcement combinations and was found to decrease with increasing temperature as shown in Tables 16 – 18. Creep limit was also found to increase with increased stress level due to increased deformation as found in Table 19 and 20 above.  900 C.C. Ihueze and C.O. Mgbemena Vol.9, No.10 The minimum creep rate as influenced by stress level at 0.10 volume fraction was evaluated and found to increase with temperature in the range 250C – 500C but increases with static stress level as found in Table 21 and Figure 11. At 700C it was found that the minimum creep rate decreases but increases with static stress level as found in Table 21 and Figure 10 also. This study evaluated the limit strains at various reinforcement combinations as well as the modulus at recommended volume fraction of PPC of 0.10 to aid Pseudo Plastic Design of plastic parts which uses the modulus and limit strain to evolve the design strength limit (Crawford, 1998). Figures 9 and 10 showing lower creep rate at temperature level 700C and higher creep limit at 700C means that it may not be safe operating at that deformation rate because the limit stress was evaluated based on the limit strain evaluated at the elevated temperature. This therefore recommends the usage of PPC at temperature in the range of 250C – 500C at volume fraction not exceeding 0.10 and strain 5% (0.05). Above all the minimum creep limit and creep rate as influenced by stress level and temperature is found to increase with stress level, decreasing with increasing temperature but showing increasing creep limit that may be attributed to strain hardening effects. Table 21: Minimum creep rate as influenced by stress level at φf = 0.10 Creep Static stress(MPa) Creep rate at 25OC(hr- 1) Creep rate at 50OC(hr- 1) Creep rate at 70OC(hr-1) 13.08 0.004 0.054 0.049 19.61 0.006 0.056 0.051 22.88 0.043 0.093 0.088 Table 22: Minimum creep limit as influenced by stress level and temperature at φf = 0.10 Creep static stress(MPa) Creep limit at 25OC(MPa) Creep limit at 50OC(MPa) Creep limit at 70OC(MPa) 13.08 60.2784 46.2134 70.3248 19.61 100.464 81.0650 110.5104 22.88 112.5197 94.4547 122.5661  Vol.9, No.10 Effects of Reinforcement Combinations of Calcium Carbonate Nanofiller 901 Figure 3: Influence of volume fraction on the strain -time behavior of PPC at 25oC and 13.08MPa Figure 4: Influence of volume fraction on the strain -time behavior of PPC at 50oC and 13.08MPa 0 0.005 0.01 0.015 0.02 0.025 0.03 0.035 0.04 0246 Strain(mm/mm) Time(hrs) T=25oC PPC‐0Strain PPC‐1Strain PPC‐2Strain PPC‐3Strain 0 0.01 0.02 0.03 0.04 0.05 0.06 0.07 00.51 Strain(mm/mm) Time(mins) T=50oC PPC‐0Strain PPC‐1Strain PPC‐2Strain PPC‐3Strain  902 C.C. Ihueze and C.O. Mgbemena Vol.9, No.10 Figure 5: Influence of volume fraction on the strain -time behavior of PPC at 70oC and 13.08MPa Figure 6: Influence of stress level on the strain -time behavior of PPC at 25oC and 13.08MPa 0 0.01 0.02 0.03 0.04 0.05 0.06 0.07 0.08 00.2 0.4 0.6 0.8 Strain(mm/mm) Time(hrs) T=70oC PPC‐0Strain PPC‐1Strain PPC‐2Strain PPC‐3Strain 0 0.005 0.01 0.015 0.02 0.025 0.03 0.035 0.04 024 Strain(mm/mm) Time(hrs) 13.08MPa PPC‐0Strain PPC‐1Strain PPC‐2Strain PPC‐3Strain 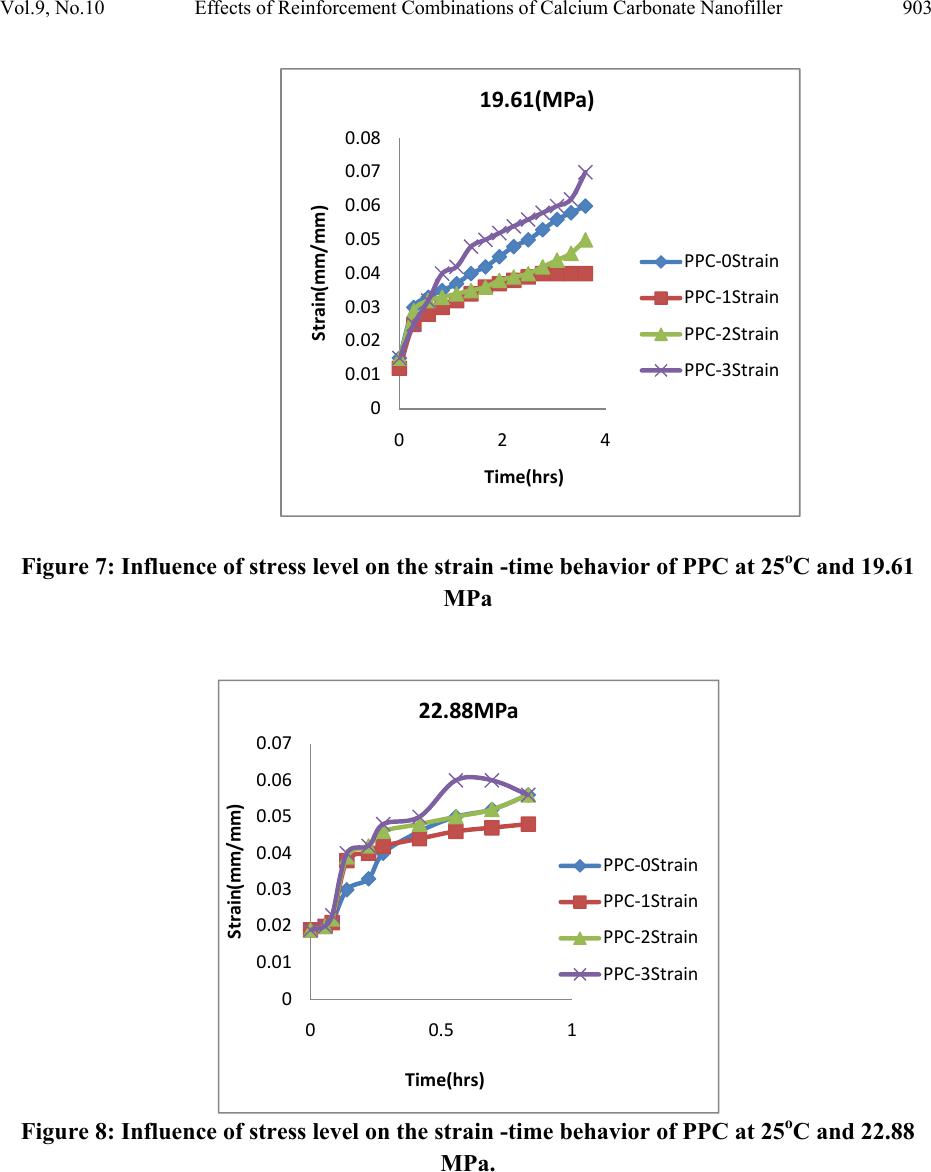 Vol.9, No.10 Effects of Reinforcement Combinations of Calcium Carbonate Nanofiller 903 Figure 7: Influence of stress level on the strain -time behavior of PPC at 25oC and 19.61 MPa Figure 8: Influence of stress level on the strain -time behavior of PPC at 25oC and 22.88 MPa. 0 0.01 0.02 0.03 0.04 0.05 0.06 0.07 0.08 024 Strain(mm/mm) Time(hrs) 19.61(MPa) PPC‐0Strain PPC‐1Strain PPC‐2Strain PPC‐3Strain 0 0.01 0.02 0.03 0.04 0.05 0.06 0.07 00.51 Strain(mm/mm) Time(hrs) 22.88MPa PPC‐0Strain PPC‐1Strain PPC‐2Strain PPC‐3Strain 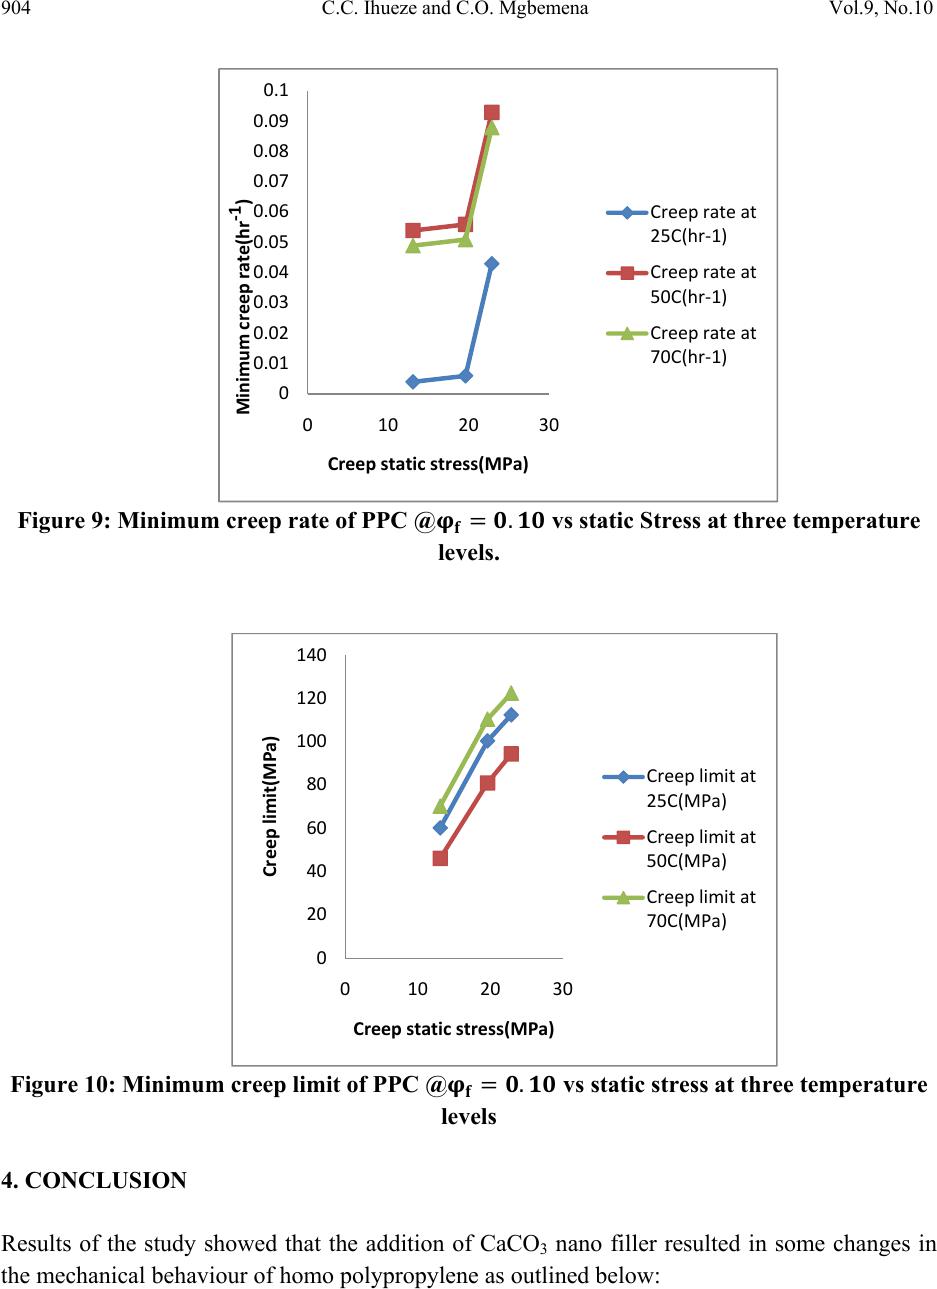 904 C.C. Ihueze and C.O. Mgbemena Vol.9, No.10 Figure 9: Minimum creep rate of PPC @ vs static Stress at three temperature levels. Figure 10: Minimum creep limit of PPC @ vs static stress at three temperature levels 4. CONCLUSION Results of the study showed that the addition of CaCO3 nano filler resulted in some changes in the mechanical behaviour of homo polypropylene as outlined below: 0 0.01 0.02 0.03 0.04 0.05 0.06 0.07 0.08 0.09 0.1 0102030 Minimumcreeprate(hr‐1) Creepstaticstress(MPa) Creeprateat 25C(hr‐1) Creeprateat 50C(hr‐1) Creeprateat 70C(hr‐1) 0 20 40 60 80 100 120 140 0 102030 Creeplimit(MPa) Creepstaticstress(MPa) Creeplimitat 25C(MPa) Creeplimitat 50C(MPa) Creeplimitat 70C(MPa) 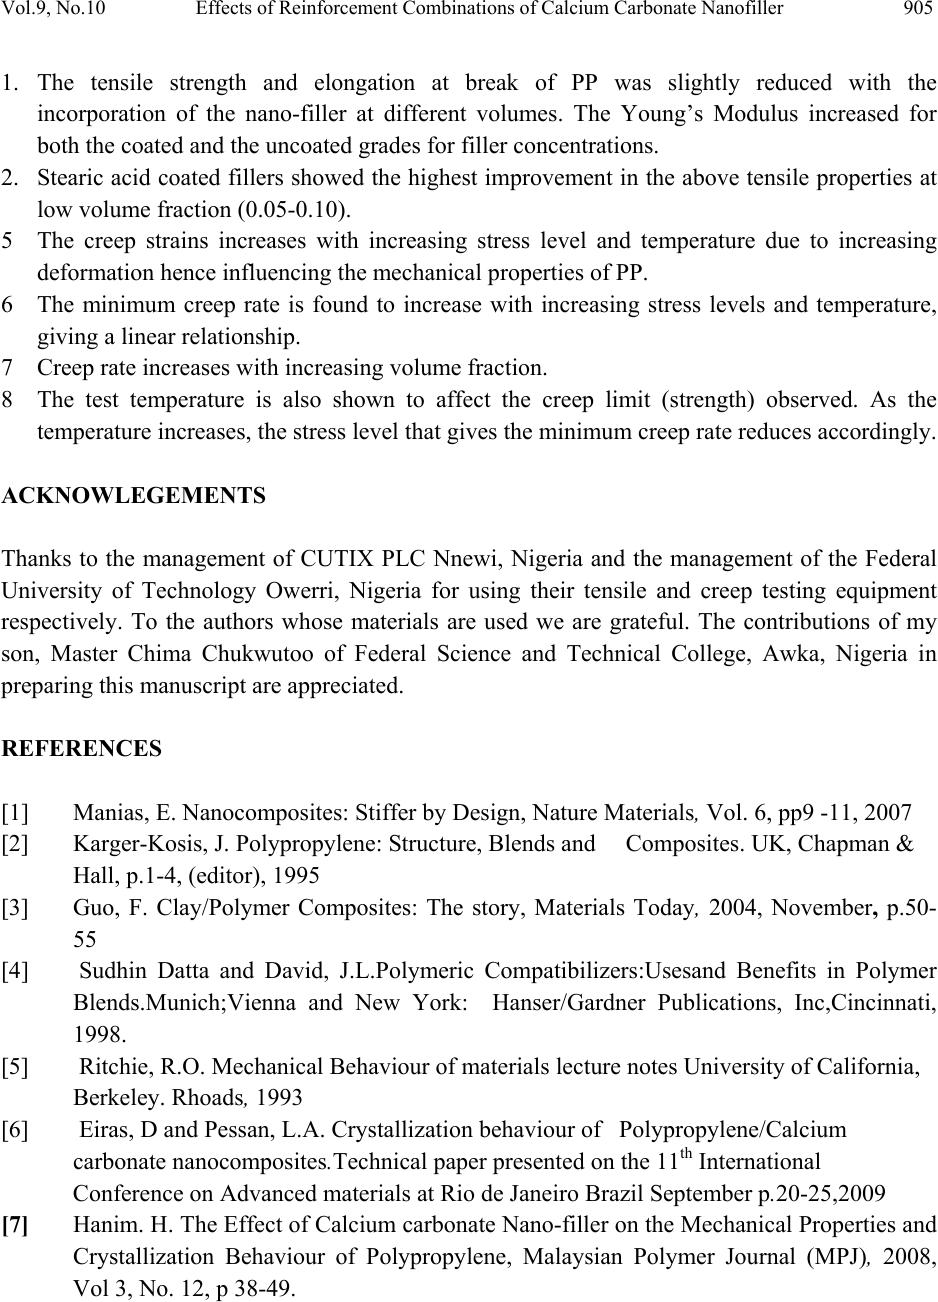 Vol.9, No.10 Effects of Reinforcement Combinations of Calcium Carbonate Nanofiller 905 1. The tensile strength and elongation at break of PP was slightly reduced with the incorporation of the nano-filler at different volumes. The Young’s Modulus increased for both the coated and the uncoated grades for filler concentrations. 2. Stearic acid coated fillers showed the highest improvement in the above tensile properties at low volume fraction (0.05-0.10). 5 The creep strains increases with increasing stress level and temperature due to increasing deformation hence influencing the mechanical properties of PP. 6 The minimum creep rate is found to increase with increasing stress levels and temperature, giving a linear relationship. 7 Creep rate increases with increasing volume fraction. 8 The test temperature is also shown to affect the creep limit (strength) observed. As the temperature increases, the stress level that gives the minimum creep rate reduces accordingly. ACKNOWLEGEMENTS Thanks to the management of CUTIX PLC Nnewi, Nigeria and the management of the Federal University of Technology Owerri, Nigeria for using their tensile and creep testing equipment respectively. To the authors whose materials are used we are grateful. The contributions of my son, Master Chima Chukwutoo of Federal Science and Technical College, Awka, Nigeria in preparing this manuscript are appreciated. REFERENCES [1] Manias, E. Nanocomposites: Stiffer by Design, Nature Materials, Vol. 6, pp9 -11, 2007 [2] Karger-Kosis, J. Polypropylene: Structure, Blends and Composites. UK, Chapman & Hall, p.1-4, (editor), 1995 [3] Guo, F. Clay/Polymer Composites: The story, Materials Today, 2004, November, p.50- 55 [4] Sudhin Datta and David, J.L.Polymeric Compatibilizers:Usesand Benefits in Polymer Blends.Munich;Vienna and New York: Hanser/Gardner Publications, Inc,Cincinnati, 1998. [5] Ritchie, R.O. Mechanical Behaviour of materials lecture notes University of California, Berkeley. Rhoads, 1993 [6] Eiras, D and Pessan, L.A. Crystallization behaviour of Polypropylene/Calcium carbonate nanocomposites.Technical paper presented on the 11th International Conference on Advanced materials at Rio de Janeiro Brazil September p.20-25,2009 [7] Hanim. H. The Effect of Calcium carbonate Nano-filler on the Mechanical Properties and Crystallization Behaviour of Polypropylene, Malaysian Polymer Journal (MPJ), 2008, Vol 3, No. 12, p 38-49. 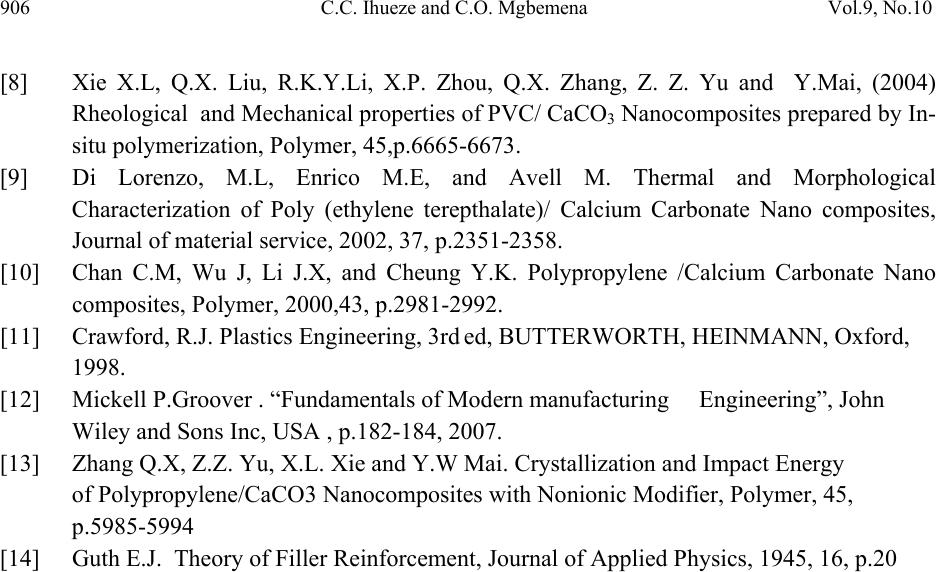 906 C.C. Ihueze and C.O. Mgbemena Vol.9, No.10 [8] Xie X.L, Q.X. Liu, R.K.Y.Li, X.P. Zhou, Q.X. Zhang, Z. Z. Yu and Y.Mai, (2004) Rheological and Mechanical properties of PVC/ CaCO3 Nanocomposites prepared by In- situ polymerization, Polymer, 45,p.6665-6673. [9] Di Lorenzo, M.L, Enrico M.E, and Avell M. Thermal and Morphological Characterization of Poly (ethylene terepthalate)/ Calcium Carbonate Nano composites, Journal of material service, 2002, 37, p.2351-2358. [10] Chan C.M, Wu J, Li J.X, and Cheung Y.K. Polypropylene /Calcium Carbonate Nano composites, Polymer, 2000,43, p.2981-2992. [11] Crawford, R.J. Plastics Engineering, 3rd ed, BUTTERWORTH, HEINMANN, Oxford, 1998. [12] Mickell P.Groover . “Fundamentals of Modern manufacturing Engineering”, John Wiley and Sons Inc, USA , p.182-184, 2007. [13] Zhang Q.X, Z.Z. Yu, X.L. Xie and Y.W Mai. Crystallization and Impact Energy of Polypropylene/CaCO3 Nanocomposites with Nonionic Modifier, Polymer, 45, p.5985-5994 [14] Guth E.J. Theory of Filler Reinforcement, Journal of Applied Physics, 1945, 16, p.20 |